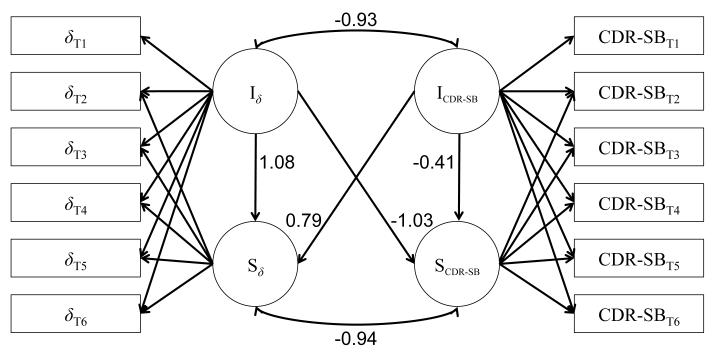
Figure 2.
Parallel process growth model examining the relationship between latent intercepts (I) and slopes (S) for both δ, the latent variable representing the dementia phenotype, and the Clinical Dementia Rating Scale Sum of Boxes (CDR-SB) across six approximately annual evaluations (T1 - T6). Numbers associated with each path represent standardized parameter estimates. δT1 = observed factor score for δ at time 1; CDR-SBT1 = observed CDR-SB score at time 1; Iδ = latent intercept of δ; Sδ = latent slope of δ; ICDR-SB = latent intercept of CDR-SB; SCDR-SB = latent slope of CDR-SB.

