

Abstract
Background
Multiple chronic conditions and low skeletal muscle mass are common features of aging that are detrimental to physical performance. This study evaluates the simultaneous impact of these conditions on physical performance in older adults.
Methods
Five studies from 2003 to 2012 were pooled to include 2,398 adults aged ≥65 years with diagnosed chronic diseases measured by self-administered questionnaire. Low muscle mass was defined as an appendicular skeletal muscle mass index less than that of the sex-specific lowest quintile in the population of older adults. Poor physical performances were defined as the lowest quintile of grip strength and gait speed in the population of older adults and the slowest sex-specific 20% of Timed Up and Go (TUG) test at each study site. Chi-squared and logistic regression tests were applied for data analysis.
Results
Mean age of the study participants, of whom approximately 50% were men, was 74.3 years. Slow gait speed was nearly three times more likely to occur in the presence of low muscle mass coupled with chronic disease than in the absence of both factors after adjustment for study site, age, sex, education, marital status, body mass index, tobacco and alcohol use, and comorbidities. The independent effect of low muscle mass was generally stronger than that of each disease. Participants with more than two chronic diseases and low muscle mass were significantly more likely to perform poorly than those with no risk factors (odds ratio [OR] = 2.51 in patients with low grip strength, OR = 3.89 in patients with low gait speed, and OR = 3.67 in patients with poor TUG test scores, all P < 0 .05) after adjustment.
Conclusions
The combined association of chronic disease and low skeletal mass with physical performance was stronger than the effect of either factor alone.
Keywords: Chronic disease, Low muscle mass, Physical performance
Background
The proportion of older adults (>65 y) in the overall population is growing in numerous countries [1]. With aging comes impaired physical performance, which is correlated with incident functional limitation in daily activities [2,3] and is a predictor of adverse health effects such as hospitalization, severe limitation of mobility, and death [4]. To prevent such impairment, individuals at high risk can be identified by determining the factors contributing to physical performance. Studies have indicated that low muscle mass and chronic disease are linked to poor physical performance [5-12] and that age-related loss of skeletal muscle mass is a common phenomenon among older adults [12]. One study reported the prevalence of low muscle mass to increase from 8.9% in women aged 76–80 years to 10.9% at 86–95 years of age [13]. Muscle mass has been reported to decline 1–2% annually after age 50 years [14], which contributes to a decline in muscle strength [5,15]. The link between muscle mass and physical performance remains controversial. Some studies have indicated that low muscle mass is associated with low grip strength and poor mobility in older men and women [5,6,16], whereas others have observed no such association [15,17,18].
Previous studies have reported that low muscle strength and impaired physical performance have been linked to chronic diseases, including diabetes [9,10,19], hypertension [8], arthritis [12], and osteoporosis [11]. Older people with diabetes have less muscle strength and a slower gait than those without diabetes [9,10,19], and those with arthritis have less muscle strength than the general population at a similar age [12]. One prospective study revealed that having two or more chronic diseases is associated with a greater decline in grip strength than having no chronic disease [8]. The co-occurrence of low muscle mass and chronic disease is common as people age, and both factors are associated with poor physical function. However, the combined association of chronic disease and low muscle mass with physical function has not yet been examined. Therefore, in this study we explored the combined association of these factors with physical function in older adults.
Methods
Participants
Our pooled dataset was derived from 5 cohort studies of community-dwelling older adults from 2003 to 2012 that constitute the study entitled Sarcopenia and Translational Aging Research in Taiwan (START) [20]. We used 4 studies, excluding one study in which body composition was not measured. The four individual cohort studies comprising the present study were Healthy Aging Longitudinal Study in Taiwan (HALST) (n = 990), Taichung Community Health Study for the Elderly (TCHS-E) (n = 1042), Tianliao Old People (TOP) study (n = 549), and Comprehensive Geriatric Assessment and Frailty Study of Elderly Outpatients (CGAFSEO) (n = 431) [21-23]. These studies recruited subjects representative of older residents living in the northern (HALST, CGAFSEO), central (TCHS-E), and southern (HALST, TOP) regions of Taiwan. For the studies that are still ongoing (follow-up phase), only baseline data are reported here. All of the cohort studies had written informed consent, and were approved by the respective institutional review boards (HALST and CGAFSEO by Medical Research Ethics Committee of National Health Research Institutes and Research Ethics Committee of the National Taiwan University Hospital, TCHS-E by Institutional Review Board of China Medical University, TOP by Research Ethics Committee of National Cheng Kung University, and IPFCEH by Research Ethics Committee of Hualien Tzu Chi Hospital).
Our pooled data were therefore for 3,012 subjects ranging in age from 55 to 102 years (Figure 1). We excluded subjects aged younger than 65 years; those with cancer, stroke, and low cognitive function; and those with incomplete information on muscle mass and chronic disease. The exclusion criteria for stroke and cancer were applied on the basis of patients’ self-reported illness diagnosed by physicians. Subjects’ cognitive status was measured with the Mini-Mental State Examination (MMSE) at three study sites and the Short Portable Mental Status Questionnaire (SPMSQ) at one study site. For studies using the MMSE, low cognition was defined as a score of <18 in subjects with ≤9 years of education or a score of <25 in subjects with >9 years of education. For the study using the SPMSQ, low cognition was defined as four or more incorrect answers in subjects with ≤9 years of education, three or more incorrect answers in subjects with high school education, and two or more incorrect answers in subjects with senior high school education or higher. Ultimately, 2,398 community-dwelling older adults with a mean age of 74.3 ± 6.1 years were analyzed in this study. The study was approved by the institutional review boards at each site, and written informed consent was provided by each participant.
Figure 1.
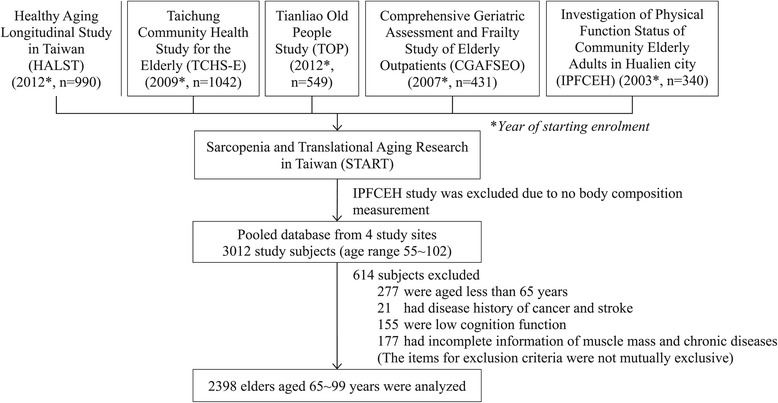
Flowchart of study subjects.
Measurements
Low muscle mass
All participants underwent a standardized procedure for measuring body composition with an eight-contact-electrode bioelectrical impedance analysis device (Tanita BC-418; Tanita Corp., Tokyo, Japan) [24]. The device measures whole-body and segmental impedance (±1Ω) at a frequency of 50 kHz and provides valid estimates of muscle mass (kg) in all four extremities [25]. Appendicular muscle mass was calculated as the sum of the estimated muscle mass of the arms and legs. Appendicular muscle mass index (ASMI) normalized to height was defined as the ratio of appendicular muscle mass (kg) to height squared (m2) [18,25]. Muscle mass was considered low if ASMI was in the lowest 20% of the sex-specific distribution in the study population (7.11 kg/m2 for men and 5.63 kg/m2 for women).
Physical performance
Functional performance was assessed using the hand grip strength test, gait speed, and Timed Up and Go (TUG) test. Hand grip strength (kg) was measured using a standard calibrated hand dynamometer. The average grip strength of dominant hand was used in analysis. Participants who ranked in the lowest 20% for sex and body mass index (BMI)-specific distribution were considered to have low grip strength [26]. To measure gait speed, the participants walked at their typical pace over a fixed distance ranging from 3 to 5 m at different study sites [27]. Gait speed was determined by dividing the walking distance by total walking time, and participants ranking in the lowest 20% for sex- and height-specific distributions were considered to have a slow gait [26]. The cutoff points of gait speed and hand grip strength were published in our previous study [20]. Three study sites performed the TUG test, in which each participant stood in front of a chair of standard height, walked 3 m, turned, and returned to a sitting position in the chair [28]. At two of the three sites, subjects were asked to complete the TUG test at their usual pace, and at the third, subjects were asked to perform the test as quickly as possible [29]. Because the distributions of time required to complete the TUG test differed at different sites, site-specific distributions for TUG test results were used. Participants for whom the time required to complete the TUG test ranked in the highest 20% for sex by site were considered to have poor functional mobility.
Chronic disease
Data on chronic disease were collected using a self-report questionnaire. Patients were asked whether they had diabetes, hypertension, heart disease, chronic obstructive pulmonary disease (COPD), chronic kidney disease (CKD), arthritis, or osteoporosis. Comorbidity was measured as the total number of 7 chronic diseases and categorized as 0, 1, and 2 or more.
Covariates
Data on the sociodemographic characteristics and health-related behaviors of the participants, including age, sex, education, marital status, obesity status, smoking status, alcohol use, and physical activity level, were collected using a questionnaire. BMI, calculated as body weight (kg) divided by the square of height (m), was used to classify obesity status as underweight (<18.5 kg/m2), normal (18.5–24 kg/m2), overweight (24–26.9 kg/m2), or obese (≥27 kg/m2), as defined by the Taiwan Department of Health [30]. Energy expenditure through physical activity was derived from a standardized questionnaire. Information on various leisure activities and time spent per week performing each activity were obtained. Physical-activity energy expenditure per person was calculated as the total amount of time spent in each activity multiplied by typical energy expenditure and expressed in kilocalories expended per kilogram of body weight per week (kcal/kg/week) [31]. Participants were divided into site- and sex-specific tertiles of total energy expenditure from physical activity.
Statistical analysis
To examine the correlations between physical performance and covariates (sociodemographic characteristics, obesity status, and health behaviors) and chronic disease, we compared the proportion in each covariate and chronic disease between participants with and without poor physical performance using the chi-square test. To test the combined association of chronic disease and muscle mass on physical performance, five common chronic diseases, each with a prevalence of >10% in older adults, were analyzed: diabetes, hypertension, heart disease, arthritis, and osteoporosis (COPD and CKD were excluded). Unadjusted odds ratio (OR) and 95% confidence interval (CI) were used to assess the combined association of chronic disease and muscle mass with physical performance, and multiple logistic regression was used to adjust for covariates. Two-sided P values were calculated and statistical significance set at P < 0.05. Analyses were performed using SAS® software version 9.3 (SAS Institute Inc., Cary, NC, USA).
Results
Table 1 presents sociodemographic factors, health behaviors, chronic diseases, and low muscle mass categorized by low grip strength, gait speed, and TUG test performance. The combined association of chronic disease and low muscle mass with physical performance is presented in Table 1. The independent effect of low muscle mass significantly increased the odds of low grip strength among participants without hypertension (OR = 1.93), arthritis (OR = 1.72), or osteoporosis (OR = 1.65). We did not observe an independent effect of each disease on grip strength. While diabetes and low muscle mass coexisted, the increased odds of low grip strength (OR = 2.43) was observed in participants.
Table 1.
Effects of socio-demographic factors, health behavior, chronic disease, and muscle mass on physical performance
| Grip strength | Gait speed | TUG test performance | |||||||
|---|---|---|---|---|---|---|---|---|---|
| Normal | Low | Normal | Low | Normal | Low | ||||
| Variables | n (%) | n (%) | p-value | n (%) | n (%) | p-value | n (%) | n (%) | p-value |
| Socio-demographic variables | |||||||||
| Age (years) | <0.001 | <0.001 | <0.001 | ||||||
| 65-69 | 602 (30.54) | 61 (14.91) | 611 (31.58) | 51 (11.78) | 553 (35.96) | 34 (8.92) | |||
| 70-74 | 609 (30.90) | 80 (19.56) | 599 (30.96) | 89 (20.55) | 467 (30.36) | 81 (21.26) | |||
| 75-79 | 435 (22.07) | 100 (24.45) | 427 (22.07) | 106 (24.48) | 301 (19.57) | 100 (26.25) | |||
| ≥80 | 325 (16.49) | 168 (41.08) | 298 (15.40) | 187 (43.19) | 217 (14.11) | 166 (43.57) | |||
| Gender | <0.001 | 0.579 | 0.959 | ||||||
| Woman | 964 (48.91) | 236 (57.70) | 968 (50.03) | 223 (51.50) | 793 (51.56) | 197 (51.71) | |||
| Man | 1007 (51.09) | 173 (42.30) | 967 (49.97) | 210 (48.50) | 745 (48.44) | 184 (48.29) | |||
| Education years | 0.003 | <0.001 | <0.001 | ||||||
| ≤6 | 998 (51.23) | 241 (59.21) | 969 (50.55) | 263 (61.74) | 619 (40.62) | 213 (57.10) | |||
| >6 | 950 (48.77) | 166 (40.79) | 948 (49.45) | 163 (38.26) | 905 (59.38) | 160 (42.90) | |||
| Marital status | 0.927 | 0.002 | 0.7480 | ||||||
| Married | 1718 (96.35) | 282 (96.25) | 1634 (96.97) | 359 (93.73) | 1250 (95.64) | 299 (95.22) | |||
| Unmarried | 65 (3.65) | 11 (3.75) | 51 (3.03) | 24 (6.27) | 57 (4.36) | 15 (4.78) | |||
| BMI (kg/m2) | 0.737 | <0.001 | <0.001 | ||||||
| <18.5 | 66 (3.35) | 15 (3.67) | 57 (2.95) | 24 (5.54) | 42 (2.73) | 17 (4.46) | |||
| 18.5-24 | 828 (42.01) | 162 (39.61) | 832 (43.00) | 155 (35.80) | 665 (43.24) | 141 (37.01) | |||
| 24-27 | 633 (32.12) | 131 (32.03) | 630 (32.56) | 126 (29.10) | 506 (32.90) | 105 (27.56) | |||
| ≥27 | 444 (22.53) | 101 (24.69) | 416 (21.50) | 128 (29.56) | 325 (21.13) | 118 (30.97) | |||
| Health behavior | |||||||||
| Smoking | 0.150 | 0.641 | 0.723 | ||||||
| No | 1820 (92.34) | 386 (94.38) | 1793 (92.66) | 404 (93.30) | 1429 (92.91) | 352 (92.39) | |||
| Yes | 151 (7.66) | 23 (5.62) | 142 (7.34) | 29 (6.70) | 109 (7.09) | 29 (7.61) | |||
| Alcohol drink | 0.001 | 0.010 | 0.016 | ||||||
| No | 1610 (81.68) | 361 (88.26) | 1583 (81.81) | 377 (87.07) | 1224 (79.58) | 324 (85.04) | |||
| Yes | 361 (18.32) | 48 (11.74) | 352 (18.19) | 56 (12.93) | 314 (20.42) | 57 (14.96) | |||
| Physical activity a | <0.001 | <0.001 | <0.001 | ||||||
| Low | 560 (29.61) | 190 (48.10) | 541 (29.01) | 195 (47.68) | 404 (27.54) | 186 (51.24) | |||
| Normal | 627 (33.16) | 127 (32.15) | 621 (33.30) | 135 (33.01) | 504 (34.36) | 106 (29.20) | |||
| High | 704 (37.23) | 78 (19.75) | 703 (37.69) | 79 (19.32) | 559 (38.10) | 71 (19.56) | |||
| Chronic disease | |||||||||
| Diabetes | <0.001 | <0.001 | <0.001 | ||||||
| No | 1590 (80.67) | 287 (70.17) | 1563 (80.78) | 310 (71.59) | 1232 (80.10) | 266 (69.82) | |||
| Yes | 381 (19.33) | 122 (29.83) | 372 (19.22) | 123 (28.41) | 306 (19.90) | 115 (30.18) | |||
| Hypertension | <0.001 | <0.001 | <0.001 | ||||||
| No | 910 (46.17) | 125 (30.56) | 886 (45.79) | 147 (33.95) | 693 (45.06) | 110 (28.87) | |||
| Yes | 1061 (53.83) | 284 (69.44) | 1049 (54.21) | 286 (66.05) | 845 (54.94) | 271 (71.13) | |||
| Heart disease | 0.260 | <0.001 | <0.001 | ||||||
| No | 1604 (81.38) | 323 (78.97) | 1599 (82.64) | 318 (73.44) | 1246 (81.01) | 275 (72.18) | |||
| Yes | 367 (18.62) | 86 (21.03) | 336 (17.36) | 115 (26.56) | 292 (18.99) | 106 (27.82) | |||
| COPD | 0.225 | 0.706 | 0.294 | ||||||
| No | 1916 (97.21) | 393 (96.09) | 1879 (97.11) | 419 (96.77) | 1490 (96.88) | 365 (95.80) | |||
| Yes | 55 (2.79) | 16 (3.91) | 56 (2.89) | 14 (3.23) | 48 (3.12) | 16 (4.20) | |||
| CKD | 0.010 | 0.519 | 0.729 | ||||||
| No | 1836 (93.15) | 366 (89.49) | 1788 (92.40) | 404 (93.30) | 1421 (92.39) | 350 (91.86) | |||
| Yes | 135 (6.85) | 43 (10.51) | 147 (7.60) | 29 (6.70) | 117 (7.61) | 31 (8.14) | |||
| Arthritis | <0.001 | <0.001 | <0.001 | ||||||
| No | 1528 (77.52) | 259 (63.33) | 1484 (76.69) | 295 (68.13) | 1166 (75.81) | 251 (65.88) | |||
| Yes | 443 (22.48) | 150 (36.67) | 451 (23.31) | 138 (31.87) | 372 (24.19) | 130 (34.12) | |||
| Osteoporosis | 0.212 | <0.001 | 0.001 | ||||||
| No | 1618 (82.09) | 325 (79.46) | 1611 (83.26) | 321 (74.13) | 1264 (82.18) | 283 (74.28) | |||
| Yes | 353 (17.91) | 84 (20.54) | 324 (16.74) | 112 (25.87) | 274 (17.82) | 98 (25.72) | |||
| Muscle mass | |||||||||
| Low ASMI | 0.009 | <0.001 | 0.005 | ||||||
| No | 1601 (81.23) | 309 (75.55) | 1588 (82.07) | 311 (71.82) | 1207 (78.48) | 273 (71.65) | |||
| Yes | 370 (18.77) | 100 (24.45) | 347 (17.93) | 122 (28.18) | 331 (21.52) | 108 (28.35) | |||
Abbreviations: TUG, Timed Up and Go; BMI, body mass index; COPD, chronic obstructive pulmonary disease; CKD: chronic kidney disease; ASMI: Appendicular Skeletal Muscle Mass Index.
aPhysical activity categorized according to sex-specific tertiles of physical activity.
The combined association of low muscle mass and chronic disease with gait speed exceeded the association of each factor alone. Independent associations of low muscle mass and slow gait were observed when diabetes (OR = 2.03), heart disease (OR = 1.73), hypertension (OR = 2.20), arthritis (OR = 1.88), or osteoporosis (OR = 1.90) was considered. An independent effect of chronic disease on gait speed was observed, with higher odds of slow gait significantly associated with diabetes, hypertension, and arthritis (OR = 1.76, 1.39, and 1.47, respectively; P < 0.05 for all). The likelihood of slow gait was far higher in the presence of both low muscle mass and chronic disease (OR = 2.73 for diabetes, OR = 2.97 for heart disease, OR = 2.38 for hypertension, OR = 3.06 for arthritis, and OR = 2.78 for osteoporosis, (P < 0.05) than in the absence of both factors (Table 2).
Table 2.
Combined association of chronic disease and low muscle mass with physical performance
| Chronic disease | Low ASMI | Total n | Low grip strength | Low gait speed | Low TUG test performance | ||||||
|---|---|---|---|---|---|---|---|---|---|---|---|
| n (%) | OR crud (95%CI) | OR adj (95%CI) | n (%) | OR crud (95%CI) | OR adj (95%CI) | n (%) | OR crud (95%CI) | OR adj (95%CI) | |||
| Diabetes | |||||||||||
| No | No | 1497 | 211 (14.09) | 1.00 | 1.00 | 212 (14.16) | 1.00 | 1.00 | 179 (11.96) | 1.00 | 1.00 |
| No | Yes | 396 | 76 (19.19) | 1.46 (1.09, 1.95) | 1.52 (0.93, 2.48) | 98 (24.75) | 1.99 (1.52, 2.61) | 2.03 (1.31, 3.12) | 87 (21.97) | 1.63 (1.22, 2.18) | 1.65 (1.02, 2.68) |
| Yes | No | 426 | 98 (23) | 1.82 (1.39, 2.38) | 1.36 (0.95, 1.96) | 99 (23.24) | 1.85 (1.42, 2.42) | 1.76 (1.25, 2.47) | 94 (22.07) | 1.93 (1.45, 2.57) | 1.90 (1.29, 2.79) |
| Yes | Yes | 79 | 24 (30.38) | 2.64 (1.60, 4.35) | 2.43 (1.14, 5.17) | 24 (30.38) | 2.76 (1.67, 4.57) | 2.73 (1.33, 5.59) | 21 (26.58) | 2.32 (1.36,3.97) | 1.95 (0.87, 4.37) |
| Heart disease | |||||||||||
| No | No | 1581 | 246 (15.56) | 1.00 | 1.00 | 237 (14.99) | 1.00 | 1.00 | 202 (12.78) | 1.00 | 1.00 |
| No | Yes | 362 | 77 (21.27) | 1.47 (1.11, 1.96) | 1.56 (0.95, 2.56) | 81 (22.38) | 1.65 (1.24, 2.19) | 1.73 (1.09, 2.73) | 73 (20.17) | 1.38 (1.03, 1.87) | 1.38 (0.82, 2.35) |
| Yes | No | 342 | 63 (18.42) | 1.22 (0.90, 1.65) | 1.19 (0.78, 1.83) | 74 (21.64) | 1.57 (1.17, 2.10) | 1.23 (0.83, 1.80) | 71 (20.76) | 1.59 (1.17, 2.16) | 1.43 (0.93, 2.21) |
| Yes | Yes | 113 | 23 (20.35) | 1.39 (0.86, 2.24) | 1.94 (0.94, 3.99) | 41 (36.28) | 3.18 (2.12, 4.78) | 2.97 (1.65, 5.34) | 35 (30.97) | 2.35 (1.53, 3.61) | 2.48 (1.32, 4.65) |
| Hypertension | |||||||||||
| No | No | 797 | 83 (10.41) | 1.00 | 1.00 | 92 (11.54) | 1.00 | 1.00 | 62 (7.78) | 1.00 | 1.00 |
| No | Yes | 248 | 42 (16.94) | 1.77 (1.19, 2.65) | 1.93 (1.06, 3.52) | 55 (22.18) | 2.19 (1.51, 3.17) | 2.20 (1.30, 3.72) | 48 (19.35) | 2.24 (1.48, 3.39) | 2.31 (1.25, 4.25) |
| Yes | No | 1126 | 226 (20.07) | 2.16 (1.65, 2.83) | 1.27 (0.90, 1.79) | 219 (19.45) | 1.86 (1.43, 2.42) | 1.39 (1.00, 1.91) | 211 (18.74) | 2.53 (1.87, 3.44) | 2.02 (1.37, 2.98) |
| Yes | Yes | 227 | 58 (25.55) | 2.95 (2.02, 4.29) | 1.72 (0.97, 3.05) | 67 (29.52) | 3.23 (2.25, 4.62) | 2.38 (1.43, 3.99) | 60 (26.43) | 3.26 (2.19, 4.85) | 2.26 (1.27, 4.03) |
| Arthritis | |||||||||||
| No | No | 1426 | 189 (13.25) | 1.00 | 1.00 | 205 (14.38) | 1.00 | 1.00 | 177 (12.41) | 1.00 | 1.00 |
| No | Yes | 373 | 70 (18.77) | 1.52 (1.12, 2.05) | 1.72 (1.05, 2.81) | 90 (24.13) | 1.89 (1.43, 2.50) | 1.88 (1.22, 2.90) | 74 (19.84) | 1.38 (1.02, 1.87) | 1.28 (0.78, 2.10) |
| Yes | No | 497 | 120 (24.14) | 2.09 (1.62, 2.70) | 1.30 (0.91, 1.86) | 106 (21.33) | 1.62 (1.25, 2.11) | 1.47 (1.05, 2.06) | 96 (19.32) | 1.56 (1.18, 2.06) | 1.18 (0.80, 1.75) |
| Yes | Yes | 102 | 30 (29.41) | 2.79 (1.77, 4.39) | 1.60 (0.75, 3.40) | 32 (31.37) | 2.81 (1.80, 4.38) | 3.06 (1.52, 6.15) | 34 (33.33) | 2.87 (1.83, 4.50) | 2.93 (1.41, 6.10) |
| Osteoporosis | |||||||||||
| No | No | 1574 | 245 (15.57) | 1.00 | 1.00 | 227 (14.42) | 1.00 | 1.00 | 203 (12.9) | 1.00 | 1.00 |
| No | Yes | 382 | 80 (20.94) | 1.44 (1.09, 1.91) | 1.65 (1.02, 2.68) | 94 (24.61) | 1.94 (1.48, 2.55) | 1.90 (1.23, 2.93) | 80 (20.94) | 1.44 (1.07, 1.92) | 1.44 (0.88, 2.35) |
| Yes | No | 349 | 64 (18.34) | 1.22 (0.90, 1.66) | 1.03 (0.70, 1.51) | 84 (24.07) | 1.89 (1.42, 2.51) | 1.39 (0.97, 1.99) | 70 (20.06) | 1.59 (1.17, 2.17) | 1.31 (0.86, 1.98) |
| Yes | Yes | 93 | 20 (21.51) | 1.52 (0.91, 2.54) | 1.35 (0.62, 2.98) | 28 (30.11) | 2.56 (1.61, 4.08) | 2.78 (1.41, 5.48) | 28 (30.11) | 2.32 (1.44, 3.73) | 2.25 (1.07, 4.71) |
ASMI = Appendicular Skeletal Muscle Mass Index; BMI = body mass index; CI = confidence interval; OR = odds ratio; ORadj = OR adjusted for age, sex, education, BMI, site, tobacco, alcohol, marital status, physical activity, and other chronic diseases.
The combined association of chronic disease and low muscle mass with TUG score was stronger than the independent effect of either factor alone after adjustment for confounding factors. The ORs of a low TUG test score for low muscle mass alone were 1.65 when considering diabetes and 2.31 when considering hypertension (P < 0.05 for both), and the relative odds for diabetes and hypertension alone were 1.90 and 2.02, respectively (P < 0.05). The ORs of a low TUG score were significant in the presence of low muscle mass and heart disease (OR = 2.48), hypertension (OR = 2.26), arthritis (OR = 2.93), or osteoporosis (OR = 2.25) (P < 0.05 for all), but not in the presence of low muscle mass with diabetes (Table 2).
Finally, we explored the combined association of multiple chronic diseases and low muscle mass. Participants with more than two chronic diseases and low muscle mass were more likely to perform poorly than those with no risk factors (OR = 2.51 for low grip strength, OR = 3.89 for slow gait, and OR = 3.67 for low TUG score, P < 0.05) after adjustment for confounding factors. Compared with participants with no risk factors, the odds of poor physical performance among those having one chronic disease and low muscle mass were higher than among participants with two or more chronic diseases and normal muscle mass (OR = 2.42 vs. 1.90 for low grip strength, OR = 3.17 vs. 2.22 for slow gait, and OR = 3.08 vs. 2.80 for a low TUG score; P < 0.05) (Figure 2).
Figure 2.
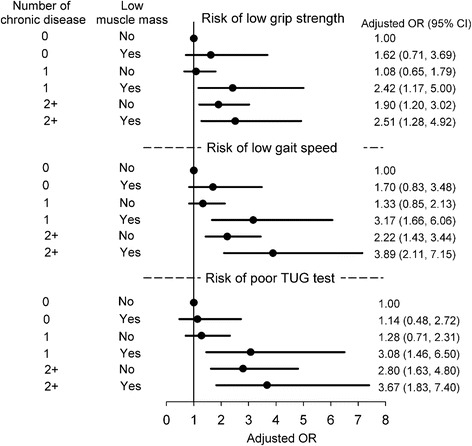
Risk of poor physical performance according to combined association of number of chronic diseases and low muscle mass, adjusted for age, sex, education, BMI, study site, tobacco, alcohol, marital status, and physical activity. BMI = body mass index.
Discussion
In the present study, we examined the combined association of low muscle mass and chronic disease with physical performance in older adults. Participants with low muscle mass and chronic comorbidities had lower grip strength, slower gait, and lower TUG score than those with low muscle mass alone or chronic disease alone, even after we controlled for potential confounding factors. Furthermore, low muscle mass alone is more strongly associated with greater impairment in physical performance than is chronic disease alone.
Low muscle mass has been reported to be significantly associated with impaired physical performance in older adults [5,6,11,19,32-34]. A community-based study of 4,000 older adults linked low muscle mass to weaker grip strength in both sexes after adjusting for age [34]. Some studies have reported that older women with lower muscle mass exhibit slower gait [5,6,34]. In the United States, the third National Health and Nutrition Examination Survey reported that even after adjustment for confounding variables, low muscle mass hindered tandem-standing ability in older men [32]. A cross-sectional study analyzing 183 community-dwelling older adults using baseline data from a randomized control trial [11] and a community-based study of 409 older women [35] indicated that higher muscle mass is associated with a better TUG test score. These results provided evidence that muscle mass is highly correlated with physical performance in older adults.
Unlike the aforementioned studies, which reported the contribution of low muscle mass to physical performance, our study also assessed the effect of chronic disease while considering the combined contribution of muscle mass and chronic disease to the risk of poor physical performance in older adults. After we considered these diseases, our results were consistent with those of previous studies of the effect of muscle mass on gait speed [5,6,34]. Our data regarding the effect of muscle mass on grip strength were consistent with those of a previous study [34] when only hypertension, arthritis, and osteoporosis were considered, but were not significant for diabetes and heart disease. The effect on TUG score was similar when we considered heart disease, hypertension, arthritis, and osteoporosis, and was nonsignificant when we considered diabetes. The effects might not have been observed when chronic conditions were considered because of the presence of comorbidities in older adults.
We observed that older adults with diabetes or hypertension exhibited poor lower-extremity physical performance. This is consistent with the findings of two studies reporting that older diabetic adults had a slower gait and less muscle strength than older adults without diabetes [9,19], and with the results of a study that followed older adults for 18 years and found that higher systolic blood pressure was associated with a higher rate of decline in gait speed [36]. Poor muscle function in diabetic patients could be the result of neuropathic processes due to diabetic polyneuropathy, which involves motor neurons [37], and the catabolic effect of inflammation on muscles [38]. Our study further explored the combined association of low muscle mass and diabetes and our results showed that elders with low muscle mass and muscle dysfunction due to diabetic polyneuropathy and muscle inflammation may further worsen old adults’ physical activity performance including poor hand grip strength and low gait speed. The magnitude of strength of association for both low muscle mass and diabetes was much greater than that either for low muscle mass alone or diabetes alone. The hypertension effect may be attributable to vascular-related damage in the musculoskeletal and peripheral nervous systems [39]. Our study finding demonstrated that an elder with low muscle mass further suffering from vascular-related damage to the musculoskeletal and peripheral nervous system by hypertension may impede elders’ function performance including low gait speed and poor TUG test performance. Again, the strength of association for both low muscle mass and hypertension was stronger than that either for low muscle mass alone or hypertension alone. Our study was the first one to estimate the strength of joint association between low lean muscle mass and chronic diseases. These findings are of relevant to clinical management of chronic diseases in elders.
We also observed that older adults with arthritis exhibited slower gait and required a longer time to complete the TUG test. A meta-analysis of 185 studies with 101,049 participants reported that individuals with rheumatoid arthritis exhibited substantially less grip strength than similar-aged individuals in the general population [12]. A possible reason for the discrepancy between these results and those of the present study is that we considered arthritis to affect mainly the hips and knees, rather than the hands, because of the low the prevalence of symptomatic hand osteoarthritis in older Chinese adults (3.0% in men, 5.8% in women) [40]. The meta-analysis addressed grip strength but did not focus on the lower extremities.
Our study examined the independent as well as the combined associations of low muscle mass and various chronic diseases with physical performance. The independent association of low muscle mass was stronger than that of each disease with grip strength and gait speed, indicating that maintenance of muscle mass is crucial to improving physical performance. Participants with two or more chronic diseases and low muscle mass performed more poorly than those with no risk factors after we adjusted for confounding factors, which illustrates the importance of physical training for older adults with multiple chronic conditions. These findings suggest that clinicians, public health workers, and investigators can create strategies to prevent or slow the decline of physical performance in these groups.
One limitation of this study was the differences in measurement of physical performance at different study sites. Inter-observer consistency of measurement could not be verified. To control for the effect of this confounding factor, we used site-specific cutoff points to define performance status as normal or abnormal. The study site was added to multivariate models to control for the effect of this confounder on the relationship between muscle mass and comorbidities and physical performance. Another limitation was assessment of chronic disease by participant self-report without clinical confirmation of a diagnosis. This may have led to underestimation of disease prevalence; however, a previous study observed that self-reported data on common chronic conditions exhibit a moderate to strong agreement with medical records [41]. We may have underestimated the independent effect of chronic disease, or the combined association of chronic disease and low muscle mass, with physical performance through nondifferential misclassification.
Conclusion
In older adults, the co-occurrence of low muscle mass and chronic disease contributed to a higher risk of impairment of physical performance than did either factor alone. The independent association between low muscle mass and physical-performance impairment was much stronger than that between each disease and physical-performance impairment.
Acknowledgments
We thank Dr. I-Chien Wu, Mr. Ming-Shiang Wu, and Ms. Yi-Fen Tsai for their assistance with data management and statistical analysis. Other members of the START project are as follows: Dr. Meng-Chih Lee, Center for Education and Research on Geriatrics and Gerontology and School of Medicine, Chung Shan Medical University, Taiwan; Dr. I-Chien Wu, Ms. Ching-I Chang, Mr. Ming-Shiang Wu, and Ms. Yi-Fen Tsai, National Health Research Institutes, Zhunan, Taiwan. This research was partially supported by the China Medical University (CMU103-S-10), the Taiwan National Health Research Institutes Grant (NHRI-EX99-9838PI), and the Taiwan Ministry of Health and Welfare Clinical Trial and Research Center of Excellence (MOHW103-TDU-B-212-113002).
Footnotes
Competing interests
The authors declare that they have no competing interests.
Authors’ contributions
CIL, TCL, WYL, CSL, CCH, CAH, CYC, KCH CHW, CYW, and CCL contributed equally to the design of the study and the direction of its implementation, including supervision of field activities and quality assurance and control. CIL, TCL, WYL, CSL, CAH, CYC, KCH, CHW, and CCL supervised field activities. CIL, TCL, WYL, CSL, CCH, and CCL helped to conduct the literature review and to prepare the Methods and the Discussion sections of the text. CIL, TCL, CCH, and CCL designed the study’s analytic strategy. All authors read and approved the final manuscript.
Contributor Information
Chia-Ing Li, Email: a6446@mail.cmuh.org.tw.
Tsai-Chung Li, Email: tcli@mail.cmu.edu.tw.
Wen-Yuan Lin, Email: wylin@mail.cmu.edu.tw.
Chiu-Shong Liu, Email: liucs@ms14.hinet.net.
Chih-Cheng Hsu, Email: cch@nhri.org.tw.
Chao A Hsiung, Email: hsiung@nhri.org.tw.
Ching-Yu Chen, Email: cycchen@ntu.edu.tw.
Kuo-Chin Huang, Email: bretthuang@ntu.edu.tw.
Chih-Hsing Wu, Email: paulo@mail.ncku.edu.tw.
Ching-Yi Wang, Email: cywang@csmu.edu.tw.
Cheng-Chieh Lin, Email: cclin@mail.cmuh.org.tw.
References
- 1.Lutz W, Sanderson W, Scherbov S. The coming acceleration of global population ageing. Nature. 2008;451(7179):716–9. doi: 10.1038/nature06516. [DOI] [PubMed] [Google Scholar]
- 2.Bongard V, McDermott AY, Dallal GE, Schaefer EJ. Effects of age and gender on physical performance. Age. 2007;29(2–3):77–85. doi: 10.1007/s11357-007-9034-z. [DOI] [PMC free article] [PubMed] [Google Scholar]
- 3.den Ouden MEM, Schuurmans MJ, Arts IEMA, van der Schouw YT. Association between physical performance characteristics and independence in activities of daily living in middle-aged and elderly men. Geriatr Gerontol Int. 2013;13(2):274–80. doi: 10.1111/j.1447-0594.2012.00890.x. [DOI] [PubMed] [Google Scholar]
- 4.Cesari M, Kritchevsky SB, Newman AB, Simonsick EM, Harris TB, Penninx BW, et al. Added value of physical performance measures in predicting adverse health-related events: results from the health, aging and body composition study. J Am Geriatr Soc. 2009;57(2):251–9. doi: 10.1111/j.1532-5415.2008.02126.x. [DOI] [PMC free article] [PubMed] [Google Scholar]
- 5.Estrada M, Kleppinger A, Judge JO, Walsh SJ, Kuchel GA. Functional impact of relative versus absolute sarcopenia in healthy older women. J Am Geriatr Soc. 2007;55(11):1712–9. doi: 10.1111/j.1532-5415.2007.01436.x. [DOI] [PubMed] [Google Scholar]
- 6.Barbat-Artigas S, Rolland Y, Cesari M, Abellan van Kan G, Vellas B, Aubertin-Leheudre M. Clinical relevance of different muscle strength indexes and functional impairment in women aged 75 years and older. J Gerontol A: Biol Med Sci. 2013;68(7):811–9. doi: 10.1093/gerona/gls254. [DOI] [PubMed] [Google Scholar]
- 7.Legrand D, Adriaensen W, Vaes B, Mathei C, Wallemacq P, Degryse J. The relationship between grip strength and muscle mass (MM), inflammatory biomarkers and physical performance in community-dwelling very old persons. Arch Gerontol Geriatr. 2013;57(3):345–51. doi: 10.1016/j.archger.2013.06.003. [DOI] [PubMed] [Google Scholar]
- 8.Stenholm S, Tiainen K, Rantanen T, Sainio P, Heliovaara M, Impivaara O, et al. Long-term determinants of muscle strength decline: prospective evidence from the 22-year mini-Finland follow-up survey. J Am Geriatr Soc. 2012;60(1):77–85. doi: 10.1111/j.1532-5415.2011.03779.x. [DOI] [PubMed] [Google Scholar]
- 9.Volpato S, Bianchi L, Lauretani F, Bandinelli S, Guralnik JM, Zuliani G, et al. Role of muscle mass and muscle quality in the association between diabetes and gait speed. Diabetes Care. 2012;35(8):1672–9. doi: 10.2337/dc11-2202. [DOI] [PMC free article] [PubMed] [Google Scholar]
- 10.Park SW, Goodpaster BH, Strotmeyer ES, de Rekeneire N, Harris TB, Schwartz AV, et al. Decreased muscle strength and quality in older adults with type 2 diabetes: the health, aging, and body composition study. Diabetes. 2006;55(6):1813–8. doi: 10.2337/db05-1183. [DOI] [PubMed] [Google Scholar]
- 11.Waters DL, Hale L, Grant AM, Herbison P, Goulding A. Osteoporosis and gait and balance disturbances in older sarcopenic obese New Zealanders. Osteoporos Int. 2010;21(2):351–7. doi: 10.1007/s00198-009-0947-5. [DOI] [PubMed] [Google Scholar]
- 12.Beenakker KG, Ling CH, Meskers CG, de Craen AJ, Stijnen T, Westendorp RG, et al. Patterns of muscle strength loss with age in the general population and patients with a chronic inflammatory state. Ageing Res Rev. 2010;9(4):431–6. doi: 10.1016/j.arr.2010.05.005. [DOI] [PMC free article] [PubMed] [Google Scholar]
- 13.Gillette-Guyonnet S, Nourhashemi F, Andrieu S, Cantet C, Albarede JL, Vellas B, et al. Body composition in French women 75+ years of age: the EPIDOS study. Mech Ageing Dev. 2003;124(3):311–6. doi: 10.1016/S0047-6374(02)00198-7. [DOI] [PubMed] [Google Scholar]
- 14.Hughes VA, Frontera WR, Roubenoff R, Evans WJ, Singh MA. Longitudinal changes in body composition in older men and women: role of body weight change and physical activity. Am J Clin Nutr. 2002;76(2):473–81. doi: 10.1093/ajcn/76.2.473. [DOI] [PubMed] [Google Scholar]
- 15.Goodpaster BH, Park SW, Harris TB, Kritchevsky SB, Nevitt M, Schwartz AV, et al. The loss of skeletal muscle strength, mass, and quality in older adults: the health, aging and body composition study. J Gerontol A: Biol Med Sci. 2006;61(10):1059–64. doi: 10.1093/gerona/61.10.1059. [DOI] [PubMed] [Google Scholar]
- 16.Woo J, Leung J, Sham A, Kwok T. Defining sarcopenia in terms of risk of physical limitations: a 5-year follow-up study of 3,153 chinese men and women. J Am Geriatr Soc. 2009;57(12):2224–31. doi: 10.1111/j.1532-5415.2009.02566.x. [DOI] [PubMed] [Google Scholar]
- 17.Cawthon PM, Fox KM, Gandra SR, Delmonico MJ, Chiou CF, Anthony MS, et al. Do muscle mass, muscle density, strength, and physical function similarly influence risk of hospitalization in older adults? J Am Geriatr Soc. 2009;57(8):1411–9. doi: 10.1111/j.1532-5415.2009.02366.x. [DOI] [PMC free article] [PubMed] [Google Scholar]
- 18.Merriwether EN, Host HH, Sinacore DR. Sarcopenic indices in community-dwelling older adults. J Geriatr Phys Ther. 2012;35(3):118–25. doi: 10.1519/JPT.0b013e31823c4bef. [DOI] [PMC free article] [PubMed] [Google Scholar]
- 19.Kalyani RR, Tra Y, Yeh HC, Egan JM, Ferrucci L, Brancati FL. Quadriceps strength, quadriceps power, and gait speed in older U.S. adults with diabetes mellitus: results from the National Health and Nutrition Examination Survey, 1999–2002. J Am Geriatr Soc. 2013;61(5):769–75. doi: 10.1111/jgs.12204. [DOI] [PMC free article] [PubMed] [Google Scholar]
- 20.Wu IC, Lin CC, Hsiung CA, Wang CY, Wu CH, Chan DC, et al. Epidemiology of sarcopenia among community-dwelling older adults in Taiwan: a pooled analysis for a broader adoption of sarcopenia assessments. Geriatr Gerontol Int. 2014;14(Suppl 1):52–60. doi: 10.1111/ggi.12193. [DOI] [PubMed] [Google Scholar]
- 21.Lin CC, Li CI, Chang CK, Liu CS, Lin CH, Meng NH, et al. Reduced health-related quality of life in elders with frailty: a cross-sectional study of community-dwelling elders in Taiwan. PLoS One. 2011;6(7):e21841. doi: 10.1371/journal.pone.0021841. [DOI] [PMC free article] [PubMed] [Google Scholar]
- 22.Wang CY, Chen LY. Grip strength in older adults: test-retest reliability and cutoff for subjective weakness of using the hands in heavy tasks. Arch Phys Med Rehab. 2010;91(11):1747–51. doi: 10.1016/j.apmr.2010.07.225. [DOI] [PubMed] [Google Scholar]
- 23.Chang CS, Chang YF, Wang MW, Chen CY, Chao YJ, Chang HJ, et al. Inverse relationship between central obesity and osteoporosis in osteoporotic drug naive elderly females: the Tianliao Old People (TOP) study. J Clin Densitom. 2013;16(2):204–11. doi: 10.1016/j.jocd.2012.03.008. [DOI] [PubMed] [Google Scholar]
- 24.Organ LW, Bradham GB, Gore DT, Lozier SL. Segmental bioelectrical impedance analysis: theory and application of a new technique. J Appl Physiol (1985) 1994;77(1):98–112. doi: 10.1152/jappl.1994.77.1.98. [DOI] [PubMed] [Google Scholar]
- 25.Pietrobelli A, Rubiano F, St-Onge MP, Heymsfield SB. New bioimpedance analysis system: improved phenotyping with whole-body analysis. Eur J Clin Nutr. 2004;58(11):1479–84. doi: 10.1038/sj.ejcn.1601993. [DOI] [PubMed] [Google Scholar]
- 26.Fried LP, Tangen CM, Walston J, Newman AB, Hirsch C, Gottdiener J, et al. Frailty in older adults: evidence for a phenotype. J Gerontol A: Biol Med Sci. 2001;56(3):M146–56. doi: 10.1093/gerona/56.3.M146. [DOI] [PubMed] [Google Scholar]
- 27.Abellan van Kan G, Rolland Y, Andrieu S, Bauer J, Beauchet O, Bonnefoy M, et al. Gait speed at usual pace as a predictor of adverse outcomes in community-dwelling older people an International Academy on Nutrition and Aging (IANA) Task Force. J Nutr Health Aging. 2009;13(10):881–9. doi: 10.1007/s12603-009-0246-z. [DOI] [PubMed] [Google Scholar]
- 28.Podsiadlo D, Richardson S. The timed “Up & Go”: a test of basic functional mobility for frail elderly persons. J Am Geriatr Soc. 1991;39(2):142–8. doi: 10.1111/j.1532-5415.1991.tb01616.x. [DOI] [PubMed] [Google Scholar]
- 29.Bohannon RW. Reference values for the timed up and go test: a descriptive meta-analysis. J Geriatr Phys Ther. 2006;29(2):64–8. doi: 10.1519/00139143-200608000-00004. [DOI] [PubMed] [Google Scholar]
- 30.Pan WH, Lee MS, Chuang SY, Lin YC, Fu ML. Obesity pandemic, correlated factors and guidelines to define, screen and manage obesity in Taiwan. Obes Rev. 2008;9(Suppl 1):22–31. doi: 10.1111/j.1467-789X.2007.00434.x. [DOI] [PubMed] [Google Scholar]
- 31.Taylor HL, Jacobs DR, Jr, Schucker B, Knudsen J, Leon AS, Debacker G. A questionnaire for the assessment of leisure time physical activities. J Chronic Dis. 1978;31(12):741–55. doi: 10.1016/0021-9681(78)90058-9. [DOI] [PubMed] [Google Scholar]
- 32.Janssen I, Heymsfield SB, Ross R. Low relative skeletal muscle mass (sarcopenia) in older persons is associated with functional impairment and physical disability. J Am Geriatr Soc. 2002;50(5):889–96. doi: 10.1046/j.1532-5415.2002.50216.x. [DOI] [PubMed] [Google Scholar]
- 33.Rekeneire ND, Resnick HE, Schwartz AV, Shorr RI, Kuller LH, Simonsick EM, et al. Diabetes is associated with subclinical functional limitation in nondisabled older individuals. Diabetes care. 2003;26(12):3257–63. doi: 10.2337/diacare.26.12.3257. [DOI] [PubMed] [Google Scholar]
- 34.Lee JS, Auyeung TW, Kwok T, Lau EM, Leung PC, Woo J. Associated factors and health impact of sarcopenia in older Chinese men and women: a cross-sectional study. Gerontology. 2007;53(6):404–10. doi: 10.1159/000107355. [DOI] [PubMed] [Google Scholar]
- 35.Patil R, Uusi-Rasi K, Pasanen M, Kannus P, Karinkanta S, Sievanen H. Sarcopenia and osteopenia among 70-80-year-old home-dwelling Finnish women: prevalence and association with functional performance. Osteoporos Int. 2013;24(3):787–96. doi: 10.1007/s00198-012-2046-2. [DOI] [PubMed] [Google Scholar]
- 36.Rosano C, Longstreth WT, Jr, Boudreau R, Taylor CA, Du Y, Kuller LH, et al. High blood pressure accelerates gait slowing in well-functioning older adults over 18-years of follow-up. J Am Geriatr Soc. 2011;59(3):390–7. doi: 10.1111/j.1532-5415.2010.03282.x. [DOI] [PMC free article] [PubMed] [Google Scholar]
- 37.Andersen H, Nielsen S, Mogensen CE, Jakobsen J. Muscle strength in type 2 diabetes. Diabetes. 2004;53(6):1543–8. doi: 10.2337/diabetes.53.6.1543. [DOI] [PubMed] [Google Scholar]
- 38.Navab M, Gharavi N, Watson AD. Inflammation and metabolic disorders. Curr Opin Clin Nutr Metab Care. 2008;11(4):459–64. doi: 10.1097/MCO.0b013e32830460c2. [DOI] [PubMed] [Google Scholar]
- 39.Alexander NB. Gait disorders in older adults. J Am Geriatr Soc. 1996;44(4):434–51. doi: 10.1111/j.1532-5415.1996.tb06417.x. [DOI] [PubMed] [Google Scholar]
- 40.Zhang Y, Xu L, Nevitt MC, Niu J, Goggins JP, Aliabadi P, et al. Lower prevalence of hand osteoarthritis among Chinese subjects in Beijing compared with white subjects in the United States: the Beijing Osteoarthritis Study. Arthritis Rheum. 2003;48(4):1034–40. doi: 10.1002/art.10928. [DOI] [PubMed] [Google Scholar]
- 41.Okura Y, Urban LH, Mahoney DW, Jacobsen SJ, Rodeheffer RJ. Agreement between self-report questionnaires and medical record data was substantial for diabetes, hypertension, myocardial infarction and stroke but not for heart failure. J Clin Epidemiol. 2004;57(10):1096–103. doi: 10.1016/j.jclinepi.2004.04.005. [DOI] [PubMed] [Google Scholar]