Sleep apnea is a multifactorial disease with a complex underlying physiology, which includes the chemoreflex feedback loop controlling ventilation. The instability of this feedback loop is one of the key factors contributing to a number of sleep disorders, including Cheyne–Stokes respiration and obstructive sleep apnea (OSA). A major limitation of the conventional characterization of this feedback loop is the need for labor-intensive and technically challenging experiments. In recent years, a number of techniques that bring together concepts from signal processing, control theory, and machine learning have proven effective for estimating the overall loop gain of the respiratory control system (see Figure 1) and its major components, chemoreflex gain and plant gain, from noninvasive time-series measurements of ventilation and blood gases. The purpose of this article is to review the existing model-based techniques for phenotyping of sleep apnea, and some of the emerging methodologies, under a unified modeling framework known as graphical models. The hope is that the graphical model perspective provides insight into the future development of techniques for model-based phenotyping. Ultimately, such approaches have major clinical relevance since strategies to manipulate physiological parameters may improve sleep apnea severity. For example, oxygen therapy or drugs such as acetazolamide may be used to reduce chemoreflex gain, which may improve sleep apnea in selected patients.
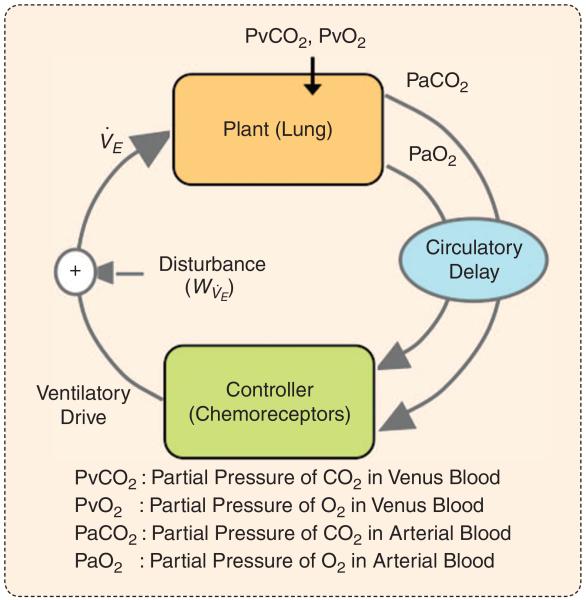
FIGURE 1.
A schematic diagram of the closed-loop respiratory control system. The plant represents the gas-exchange system. The input to the plant is level of ventilation (V̇E) and the partial pressure of blood gasses in venus blood (taken as constant), and the output is the arterial gas tension (PvCO2 and PvO2). The delay term represents the circulatory time delay between the lungs and chemoreceptors and the delay associated with the mixing of CO2 and O2 with the existing level in the heart and arteries. The controller represents the aggregate response of the respiratory pattern generator to its inputs (including chemoreceptor outputs, higher congnitive inputs, wakefulness/sleep-stage-related drives, etc.). The (frequency-dependent) product of the various components around the loop (plant, delay, and controller) is known as the loop gain of the system. A high loop gain describes a system that is intrinsically unstable, whereas a low loop gain describes a more stable system. system
The Chemoreflex Feedback Loop
A simplified model of the interaction among spontaneous fluctuations in breath-to-breath values of ventilation (V̇E) partial pressure of arterial CO2 (PCO2), and O2 (PO2) can be represented by the following matrix equation:
| (1) |
where yn−k = [V̇E (n−k), PCO2 (n−k), PO2 (n−k)]T, wn = [wV̇E (n), wPCO2 (n), wPO2 (n)]T is a vector of Gaussian distributed zero-mean noise terms with covariance Q, and Ak is an appropriately constrained coefficient matrix, representing the relationships among the modeled variables at the kth time lags. The above equation is a structured vector autoregressive (VAR) model and arises as a result of discretizing a continuous differential equation model of the gas exchange process, under small-signal theory approximations [1]. We showed in a previous work [2] that the parameters of this model can be used to describe the pairwise and plant gains), and to derive the frequency-domain stability characteristics (i.e., the loop gain) of the underlying system.
The graphical model formalism provides a flexible framework for development of time-series models of the chemoreflex feedback loop.
Graphical Models for Time Series
The directed graphical model formalism provides a unifying framework for modeling complex evolving interactions among random variables. Graphical model representations of three time-series models are shown in Figure 2. The random variables are typically represented as the nodes of a graph, and their conditional dependencies are captured by directed arrows. In general, the encoded relationships can be nonlinear and may include latent variables of both discrete and continuous type. In the following sections, we discuss how classical time-series models, such as the VAR, time-varying VAR, switching VAR, and many other time-series modeling techniques can be represented as graphical models, thus yielding themselves to standard inference and learning algorithms designed for learning on graphs [3].
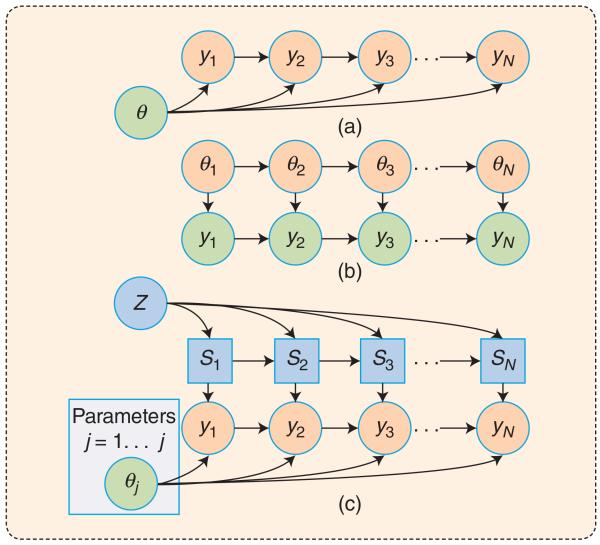
FIGURE 2.
A graphical model representation of the time-series models: (a) a first-order VAR model with static parameters θ, (b) a TVAR with dynamic patameters θ1…θN, and (c) an SVAR model, which includes a collection of J VAR models, with the Markov transition matrix Z. Each node represents a random variable, and the lack of an edge represents the conditional independence relationship among the variables. The time-series samples y1,…, yN are observed, and the remaining variables are latent.
Vector Autoregressive Modeling
The application of autoregressive modeling to the identification of the respiratory feedback loop goes back to the pioneering work of Khoo et al. [1] in the 1990s. More recently, we showed that the technique could be generalized to identify transfer path function and to assess the stability properties of a system involving multiple interacting variables in a feedback loop [2]. Figure 2(a) depicts the graphical model representation of a first-order VAR model of a sequence of N observations from a time series y1:N = {y1, …, yN}, with the set of VAR coefficients lumped into the parameter θ. Given a p-order VAR mode, one may exploit Bayes’ rule [Bayes’ rule states that the probability of A is conditioned on knowing B, p(A|B) = p(A, B) /p(B)] to write the joint probability of the observations as p(y1:n | θ) = p(yn | y1:n−1, θ) p(y1:n−1 | θ) = p(yn | yn−p:n−1, θ)p(y1:n−1 ; θ). Recursive application of Bayes’ rule yields the joint probability of the N time-series samples
| (2) |
A point-estimate of the model parameters can now be made by maximizing (2) with respect to θ. Although, in the case of the Gaussian likelihood model, this optimization problem simplifies to a set of least-square equations, the graphical model formalism allows for inference and learning of model parameters under more general distributions. Moreover, graphical models provide a natural and intuitive tool for formulating variations on the classic methods as well as constructing more complex time-series models.
Oxygen therapy or drugs such as acetazolamide may be used to reduce chemoreflex gain, which may improve sleep apnea in selected patients.
Time-Varying Vector Autoregressive
It is known that the ventilatory feedback loop parameters can vary over time due to factors such as sleep-state-related changes in the chemical control system, upper-airway mechanics, and other behavioral factors [1]. Assuming that the system parameters change at a sufficiently slower rate than the dynamics of the time series, we may use a time-varying VAR (TVAR) to model a nonstationary ventilatory time series, and the associated loop gains (and its components, controller and plant gains). Figure 2(b) depicts the graphical model representation of a TVAR model. The model also belongs to the class of linear dynamical systems (LDSs), and the celebrated Kalman filter and Rauch–Tung–Striebel (RTS) smoother can be used to learn the time-varying parameters of this model. The forward and backward recursions of the Kalman filter are a subset of a broader class of belief propagation (or message-passing) algorithms on the directed graphical models [4]. Moreover, one may use the expectation-maximization technique to learn the optimal learning rate of the TVAR [7].
Notably, the stability analysis of such time-varying systems has been a subject of extensive research within the control theory literature. Briefly, the traditional linear time-invariant Lyapunov asymptotic stability (LAS) analyses for linear time-invariant systems have been replaced by a more refined concept of finite-time stability (FTS). While LAS deals with the behavior of a system within a sufficiently long (in principle, infinite) time interval, FTS has been used to study the system behavior within a finite (possibly short) interval and, therefore, is more applicable to the study of systems with threshold mechanisms (for instance, the chemoreflex feedback loop, which includes an apneic threshold for arterial PCO2) [5].
Switching Vector Autoregressive
An alternative approach to modeling sleep-dependent changes in the chemoreflex system variables is to utilize a switching VAR (SVAR) model. Figure 2(c) is a graphical model representation of the SVAR, which includes N discrete latent switching variables Sn, modeling the probability of belonging to any one of the J models at the nth time step. Physiologically, these latent variables could be driven by changes in sleep stage, body position, sensor fallouts, etc. However, in the absence of this side information, inference in graphical models allows for the identification of the most likely setting of these latent causes across time.
An alternative approach to modeling sleep-dependent changes in the chemoreflex system variables is to utilize a switching VAR model.
The models discussed so far are only a subset of a rich class of time-series models. Other important information, such as the quality of measured signals, and the influence of latent and observed variables (such as arousals and the concept of wakefulness drive) can be conveniently incorporated into the graphical model of ventilatory time series. Other latent switching models include the hidden Markov models, the switching LDSs, and their nonparametric analogs, where the dimension of the hidden state or the number of modes are also defined as a part of inference and learning [6].
Maximum-Likelihood Learning Versus Outcome Discriminative Learning
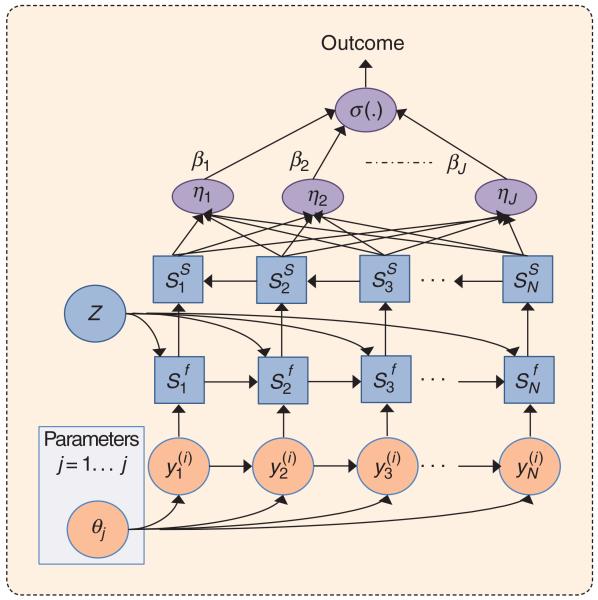
There are a number of exact and approximate algorithms for inference and learning in graphical models, with the objective of maximizing the data likelihood. These approaches may include methods of expectation propagation, sequential Markov chain Monte Carlo methods, and variational Bayesian inference, which provide full marginal distributions over the model parameters [3], [4]. More recently, Nemati et al. introduced a new class of outcome-discriminative (supervised) algorithms for learning “phenotypic” patterns in multivariate time series [8]. Figure 3 presents a schematic diagram of a dynamic neural-network representation of the SVAR model of Figure 2(c), augmented with a neural-network-based classification layer. Given the representation of Figure 3, one may learn the marginal distributions over the switching variables and the model parameters using the standard error backpropagation technique for neural networks. In contrast to the standard maximum-likelihood techniques, here the objective is to find time-series patterns that maximally separate two patient cohorts and, therefore, define cohort-specific phenotypic time-series dynamics.
FIGURE 3.
The dynamic neural network (DNN) analog representation of an SVAR model, with an added neural network classifier layer (in purple). The DNN is constructed by unrolling the graphical model representation of Figure 2(c), both in time and in inference step (superscripts f and s denote the inferred filtered and smoothed state variables, respectively). A two-pass efficient algorithm allows for learning time-series (phenotypic) dynamics that are most predictive of outcomes of interest (e.g., normal versus apneic). A total of J dynamical behaviors (or chemoreflex models) can be learned on a cohort of patients’ time series (indexed by i) from an overnight polysomnography study.
Conclusions and Perspective
The graphical model formalism provides a flexible framework for development of time-series models of the chemoreflex feedback loop. Additionally, complex interaction among ventilatory variables and the sleep-arousal dynamics as well as sensor noise and artifacts can be encoded into the structure of the graph. Stability analysis of the time-varying and switching models of the chemoreflex control system [5] provides unique opportunities for future research, with applications to noninvasive assessment of ventilatory instability in patients with congestive heart failure or OSA. More importantly, identification of the mechanisms responsible for system instability in such patients would enable clinicians to target particular therapies on a personalized basis. For example, interventions that specifically target the individual components of loop gain (e.g., supplemental oxygen or acetazolamide to adjust chemosensitivity) may provide selected patients with attractive treatment alternatives to currently available treatments. Phenotyping these patients in an efficient and reliable manner is requisite and can be facilitated by the use of graphical models in sleep apnea.
Contributor Information
Shamim Nemati, Harvard School of Engineering and Applied Sciences, Cambridge, Massachusetts. (shamim@seas.harvard.edu).
Jeremy Orr, University of California, San Diego (UCSD) School of Medicine.
Atul Malhotra, UCSD School of Medicine.
References
- [1].Khoo MCK. Physiological Control Systems: Analysis, Simulation, and Estimation. Wiley IEEE Press; Piscataway, NJ: 2000. [Google Scholar]
- [2].Nemati S, Edwards BA, Sands SA, Berger PJ, Wellman A, Verghese GC, Malhotra A, Butler JP. Model-based characterization of ventilatory stability using spontaneous breathing. J. Appl. Physiol. 2011;111(1):55–67. doi: 10.1152/japplphysiol.01358.2010. [DOI] [PMC free article] [PubMed] [Google Scholar]
- [3].Wainwright MJ, Jordan MI. Graphical models, exponential families, and variational inference. Found. Trends Mach. Learn. 2008;1(1-2):1–305. [Google Scholar]
- [4].Murphy KP. Machine Learning: A Probabilistic Perspective. MIT Press; Cambridge, MA: 2012. [Google Scholar]
- [5].Amato F, Ambrosino R, Ariola M, Cosentino C. Finite-time stability of linear time-varying systems with jumps. Automatica. 2009;45(5):1354–1358. [Google Scholar]
- [6].Fox E, Sudderth EB, Jordan MI, Willsky A. Bayesian nonparametric inference of switching dynamic linear models. IEEE Trans. Signal Processing. 2011;59(4):1569–1585. [Google Scholar]
- [7].Nemati S, Wellman A, Edwards BA, Sands SA, Malhotra A. Model-based characterization of ventilatory stability during spontaneous breathing: A human study; Proc. B70. Sleep Disordered Breathing: Pathophysiology; May 1, 2012.pp. A3609–A3609. [Google Scholar]
- [8].Nemati S, Lehman LH, Adams RP. Learning outcome-discriminative dynamics in multivariate physiological cohort time series; Proc. 35th Annu. Int. Conf. IEEE Engineering Medicine Biology Society; 2013; pp. 7104–7107. [DOI] [PubMed] [Google Scholar]


