

In the absence of the Arp2/3 complex, fibroblast cells adopt a leading edge with filopodia-like protrusions (FLPs) and maintain an ability to move. In this study, it is proposed that formins are required for the extension of FLPs and myosin II concentrated in arc-like regions in between FLPs is required for coordinated advancement of these regions.
Abstract
Cells employ protrusive leading edges to navigate and promote their migration in diverse physiological environments. Classical models of leading-edge protrusion rely on a treadmilling dendritic actin network that undergoes continuous assembly nucleated by the Arp2/3 complex, forming ruffling lamellipodia. Recent work demonstrated, however, that, in the absence of the Arp2/3 complex, fibroblast cells adopt a leading edge with filopodia-like protrusions (FLPs) and maintain an ability to move, albeit with altered responses to different environmental signals. We show that formin-family actin nucleators are required for the extension of FLPs but are insufficient to produce a continuous leading edge in fibroblasts lacking Arp2/3 complex. Myosin II is concentrated in arc-like regions of the leading edge in between FLPs, and its activity is required for coordinated advancement of these regions with formin-generated FLPs. We propose that actomyosin contraction acting against membrane tension advances the web of arcs between FLPs. Predictions of this model are verified experimentally. The dependence of myosin II in leading-edge advancement helps explain the previously reported defect in directional movement in the Arpc3-null fibroblasts. We provide further evidence that this defect is cell autonomous during chemotaxis.
INTRODUCTION
Actin polymerization drives protrusion of the leading edge in migrating cells through two types of structures, lamellipodia and filopodia, distinguished primarily by their morphological characteristics (Hall, 1998; Pollard and Borisy, 2003; Chhabra and Higgs, 2007; Bugyi and Carlier, 2010). Lamellipodia are dynamic veil-like edges made up of cross-linked orthogonal actin arrays and are typically observed in fibroblasts or keratocytes moving on two-dimensional (2D) surfaces. Enrichment of branched actin network and localization of the Arp2/3 complex, an evolutionarily conserved actin-nucleating complex, at the tip of lamellipodia led to the hypothesis that the Arp2/3 complex is the primary actin nucleator regulating the extension and organization of the lamellipodia actin network (Welch et al., 1997; Mullins et al., 1998; Svitkina and Borisy, 1999; Pollard, 2007). Filopodia, by contrast, are finger-like protrusions with tightly bundled parallel actin filaments (Small, 1988; Lewis and Bridgman, 1992; Mallavarapu and Mitchison, 1999; Chhabra and Higgs, 2007). Two different mechanisms have been proposed for filopodia formation (Yang and Svitkina, 2011). The first mechanism initiates with Arp2/3-dependent actin nucleation, but filaments are bundled after debranching of the dendritic actin structures (Svitkina and Borisy, 1999; Svitkina et al., 2003). A second mechanism for filopodia formation relies on diaphanous-related formin (DRF)-family actin-nucleating proteins (Peng et al., 2003; Higashida et al., 2004; Pellegrin and Mellor, 2005; Schirenbeck et al., 2005; Yang et al., 2007; Block et al., 2008; Harris et al., 2010). DRF proteins remain associated with the actin barbed ends after nucleation and facilitate the elongation of long and unbranched actin filaments (Paul and Pollard, 2009).
Despite an increasing understanding of the molecular pathways controlling the assembly of actin filaments, much remains unknown about functional impacts of morphologically and mechanistically different actin protrusions. To this end, perturbation studies using gene disruption, RNA interference, or chemical inhibitors have been done to shed light on the evolutionary design principles underlying different mechanisms of actin assembly in diverse forms of cell motility (Machesky and Insall, 1998; Bailly et al., 2001; Di Nardo et al., 2005; Steffen et al., 2006; Suraneni et al., 2012; Wu et al., 2012). In a previous work, we isolated embryonic stem cells (ESCs) from mouse embryos with homozygous disruption of the gene encoding ARPC3, a subunit of the Arp2/3 complex (Suraneni et al., 2012). The ESCs were differentiated into fibroblasts, which were compared for their 2D motility behaviors with fibroblasts derived in parallel from wild-type (wt) embryos. It was readily apparent that, whereas the leading edge of wt fibroblasts exhibited both lamellipodia and filopodia, mutant fibroblasts were devoid of lamellipodia and had leading edges populated with filopodia-like protrusions (FLPs) that contained the actin-bundling protein fascin and mDia1 and mDia2—mouse DRFs. More surprisingly, ARPC3−/− fibroblasts displayed considerable motility without the Arp2/3 complex at the leading edge, but mutant cells were defective in directional cell migration. ARPC3−/− fibroblasts lagged in wound healing compared with wt cells due to a lack of sustained directional movement toward the wound space. In chemotactic assays, the mutant cells failed to migrate following an epidermal growth factor (EGF) gradient, in contrast to wt fibroblasts. On the basis of these observations, we proposed that Arp2/3-based leading edges in wt fibroblasts are particularly important for persistent directional movement of fibroblast cells.
In this study, we further examined the cytoskeletal requirement for leading-edge advancement in Arpc3-null fibroblasts. The results lead to a model of cell-edge protrusion that relies on coordinated DRF-mediated FLP extension and myosin II–based contractility of the web of actin network between the FLPs. We further provide evidence that the chemotactic defect of mutant fibroblasts is cell autonomous rather than a consequence of abnormal paracrine signaling, as speculated by a recent study (Wu et al., 2013).
RESULTS
Leading-edge protrusion in ARPC3−/− fibroblasts depends on formin and myosin II activity
We performed superresolution imaging of actin filaments, stained with fluorescent phalloidin, by structured illumination microscopy (SIM; Figure 1A). Although SIM did not enable discernment of individual actin filaments, the difference in actin organization at the leading edge of wt versus ARPC3−/− fibroblasts was apparent. Whereas the wt leading edge showed smooth lamellipodia regions with a dense actin network and short filopodia, the mutant leading edge consisted of only tapered protrusions (FLPs) whose length and width at the bases were several fold larger than those of wt filopodia. FLPs appeared to have prominent actin bundles both extending into the cell body and outlining arc regions in between neighboring FLPs.
FIGURE 1:

Actin organization at the leading edge and paxilin localization in wt and ARPC3−/− fibroblasts. (A) Spreading wt and ARPC3−/− cells were stained with fluorescent phalloidin and imaged by SIM. The white boxes represent the zoomed regions in the corresponding images. (B) Spreading ARPC3+/+ (top panels) and ARPC3−/− cells (bottom panels) were stained with antibodies against paxilin (green), Alexa Fluor 546 phalloidin for F-actin (red) and DAPI to visualize the nucleus (blue). Representative images are shown. Scale bars: (A) wt 2 μm, 1.5 μm (zoom) and ARPC3−/− 2.5 μm, 1.5 μm (zoom); (B) 20 μm.
The morphological differences between wt and ARPC3−/− fibroblast leading edges suggest their mechanism of formation may be drastically different. We showed previously that mDia1 and mDia2, two DRFs, are concentrated at the tip of the FLPs, suggesting that FLP formation may be achieved by formin-family actin nucleators (Suraneni et al., 2012). However, due to the difficulty in efficiently transfecting these terminally differentiated fibroblasts, our attempts to knock down these two genes failed. Further adding to the difficulty of specific functional perturbation, genetic analysis indicated redundancy among the mouse DRFs (Peng et al., 2003; Wallar and Alberts, 2003; Eisenmann et al., 2005). We therefore tested the requirement of DRF proteins in FLP extension in a cell-spreading assay by using the small molecular inhibitor SMIFH2, which inhibits the actin nucleation activity of formin homology domain 2 (FH2; Rizvi et al., 2009). At a moderate concentration of 15 μM, SMIFH2 had no significant effect on the morphology and spreading speed of wt cells (Figure 2, A and C, and Supplemental Videos 1 and 2). By contrast, SMIFH2 strongly inhibited FLP extension and cell spreading in ARPC3−/− fibroblasts, compared with wt cells, and this effect was reversible upon drug washout (Figure 2, B–D, and Supplemental Videos 3–5). We noted that some of the mutant cells treated with SMIFH2 also formed blebs at the start of the spreading (e.g., Supplemental Video 4). Treatment of polarized migrating ARPC3−/− cells with SMIFH2 led to apparent cessation of FLP protrusion (a representative example is shown in Supplemental Video 6). However, due to the chemical instability of SMIFH2 in cell culture media, we were unable to perform tracking quantification of cell movement in the presence of the drug. Nevertheless, these observations supported a requirement for the actin nucleation activity of formin-family proteins in the formation of FLP in Arp2/3 complex–deficient cells.
FIGURE 2:

Effect of the formin inhibitor SMIFH2 on fibroblast cell spreading. (A and B) Montage of phase-contrast movies of representative spreading of ARPC3+/+ (A) and ARPC3−/− (B) fibroblast cells in the presence of DMSO or 15 μM of SMIFH2 on a fibronectin-coated surface. (C) Quantification of cell areas from experiments described in A and B. Plots show mean and SEM from 33 cells (five experiments, DMSO) and 48 cells (six experiments, SMIFH2) for APRC3+/+; and 28 cells (four experiments, DMSO) and 26 cells (four experiments, SMIFH2) for APRC3−/−. (D) Example of an ARPC3−/− fibroblast cell spreading in the presence of 15 μM of SMIFH2 (left panels) and its recovery after drug washout (right panels). Scale bars: 25 μm.
Time-lapse movies of spreading ARPC3−/− fibroblasts also indicated that leading-edge extension involves both FLP and advancement of the regions in between adjacent FLPs with the appearance of concaved arcs with actin filaments tangential with respect to the direction of leading-edge movement (Figure 2 and Supplemental Videos 1–6). Immunofluorescence staining of paxilin, a focal adhesion component (Glenney and Zokas, 1989), in cells that underwent spreading on a fibronectin-coated surface (Suraneni et al., 2012) revealed that substrate adhesion is abundant along the FLPs in mutant cells but mostly absent in the arc regions (Figure 1B). Immunofluorescence staining of spreading or polarized migrating ARPC3−/− cells showed that myosin II localizes along actin bundles in the arc regions, and this enrichment extends into FLPs (Figure 3, B and D). By contrast, in spreading or migrating wt cells, myosin II forms contractile structures not at the cell periphery but behind the lamellipodia (Figure 3, A and C), as shown in previous studies (Wakatsuki et al., 2003; Cai et al., 2006, 2010; Vicente-Manzanares et al., 2009; Burnette et al., 2011; Shutova et al., 2012).
FIGURE 3:

Localization of myosin II in ARPC3+/+ and ARPC3−/− fibroblast cells. Spreading (A and B) or polarized (C and D) ARPC3+/+ (A and C) and ARPC3−/− (B and D) cells were stained with antibodies against myosin IIA (green), Alexa Fluor 546 phalloidin for F-actin (red), and DAPI to visualize the nucleus (blue). Representative images are shown. Scale bars: 25 μm.
The apparent distinction in myosin II distribution between wt and mutant cells raises the possibility that myosin II plays different roles in leading-edge dynamics with or without the Arp2/3 complex. To test this, we treated spreading fibroblasts with blebbistatin, an inhibitor of nonmuscle myosin II ATPase (Straight et al., 2003). Consistent with a previous report (Cai et al., 2010), myosin II inhibition in wt fibroblasts did not prevent cell spreading but disrupted lamellipodial symmetry and integrity, resulting in fragmented, fan-shaped lamellipodia on one side of the cell (Figure 4A and Supplemental Videos 7 and 8). In spreading ARPC3−/− fibroblasts, blebbistatin but not control dimethyl sulfoxide (DMSO)-treated mutant fibroblast, extended spiny and often branched protrusions with no advancing membrane in between (Figure 4B and Supplemental Video 9). This morphological change was observed in all cells imaged by time-lapse microscopy (n = 12). In mutant cells that had already spread, blebbistatin treatment resulted in collapse of the arcs, leaving behind long, thin FLPs that often had branches (Figure 4D), in contrast to wt cells (Figure 4C). Soon after blebbistatin washout, the membrane arcs between FLPs advanced promptly and recovered the same leading-edge morphology as untreated mutant cells (Figure 4, B and D, and Supplemental Video 10). These results suggest that leading-edge advancement in ARPC3−/− cells is a product of both formin-mediated FLP extension and myosin II–dependent contractility of the regions between FLPs.
FIGURE 4:

Effects of the nonmuscle myosin II inhibitor blebbistatin on APRC3+/+ and ARPC3−/− fibroblast cells. (A and B) Montage of phase-contrast movies showing the morphology of representative ARPC3+/+ (A) and ARPC3−/− (B) fibroblast cells spreading in the presence of blebbistatin (top row) and recovery after drug washout (bottom row). (C and D) Montage of phase-contrast movies showing already spread ARPC3+/+ (C) and ARPC3−/− (D) fibroblast cells treated with blebbistatin (top row) and recovery after drug washout (bottom row). Scale bars: 25 μm.
Force-balance model of leading-edge protrusion in the absence of Arp2/3 complex
On the basis of protein localization and functional data, we propose a model for how fibroblast cells produce protrusive edges in the absence of the Arp2/3 complex. We assume that myosin II captures overlapping filaments at the base of adjacent FLPs and produces the contractile force driving concerted advancement of the arc regions in between the FLPs (Figure 5A, model 1 or 2). We hypothesize that this contractile force shortens the actomyosin assemblies in the arc regions between the bases of the FLPs, in concert with filaments “peeling” from the FLP bases and being “reeled” into the contractile network. Together these processes lead to the advancement of the leading edge between FLPs.
FIGURE 5:

Force-balance model of leading-edge protrusion based on coordinated action of formin and myosin II. (A) Simple cartoon diagram depicting the key elements of the leading edge formed in the absence of the Arp2/3 complex. Small green circles: formin at actin barbed ends; red filaments: actin filaments; blue lines with green ovals: myosin II. Parameters of the model, R, F, and T are shown in the diagram. L (not shown) is arc length between the two outside red dots at the base of adjacent filopodia. Models 1 and 2 vary in the organization of actin-myosin assemblies at the arc region. (B) Plots show average density distribution of active myosin (blue) and the SD of the density (orange) as a function of the spatial coordinate along the arcs. The measurements were performed on 11 arcs in three different cells. A representative ARPC3−/− mutant cell stained for active myosin II (anti-p-MYL9) and actin (fluorescent phalloidin) are shown in the side panels. The white box shows an example arc area in which phosphomyosin distribution was measured. The maximal density and the half-arc length were normalized to 1. (C) The distribution of active myosin density in the arc predicted from solving the force balance equation for the actomyosin flow and the diffusion-drift equation for the myosin density (see the text). We used nondimensional parameter values a = 5 and b = 1 for the plot. (D) Correlation of arc radius R with arc length L, from measurements made in a total of 12 spreading ARPC3−/− cells from six movie frames for each cell. (E) Correlations of the arcs' radii and lengths with actin and myosin densities at the arc centers. All pairs of these four variables correlate. The r and p values for each pair are shown. Scale bars: (B) 25 μm; 5 μm (zoom).
To evaluate whether this is mechanically plausible, we considered the force balance between the effective pressure generated by actomyosin contraction and membrane tension T (Figure 5A), which is described by Laplace's law: T = F/R, or R = F/T (Bar-Ziv et al., 1999), where F is the contractile force in the bundle and R is the radius of the arc. At least two simple theories predict that the contractile force F is a growing function of the actomyosin assembly length, L. First (Figure 5A, right side), assuming that 1) the assembly consists of many filaments much shorter than the arc (micron-range filament length or shorter); 2) myosin is distributed with density M(x), and each myosin molecule produces force k; and 3) actin filaments exert viscous-like friction against one another when they move with different rates; then the constant one-dimensional (1D) stress along the actomyosin fiber is 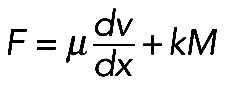 (in 1D stress, F is force) (Rubinstein et al., 2009). Here µ is viscosity, v(x) is actin and myosin velocity, and x is a coordinate along the fiber. We assume that, at the ends of the actomyosin assembly, where it is attached to the FLP base, filaments are pulled into the arc with effective viscous friction against adhesions at the FLP base, so the stress there is F(0) = ζv(0); F(L) = –ζv(L). Here ζ is the effective friction, and 0 and L are coordinates of the ends. The model excludes adhesion forces along the arc, only taking into account adhesions at the end of the arc, because the paxilin staining of mutant cells (Figure 1B) demonstrated the absence of adhesions along the arc. Integrating equation
 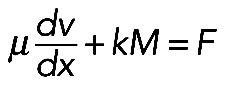 with unknown F with boundary conditions F = ζv(0) = –ζv(L) across the arc, we get:
 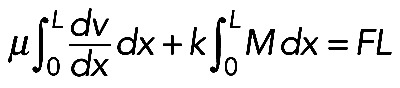 . Note that
 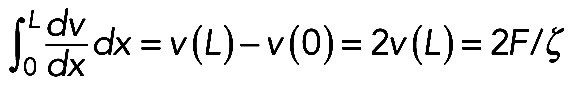 (if myosin distribution is symmetric; Figure 5B) and that
 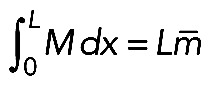 , where
  is the average myosin density. Then
 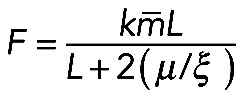 , or
, or  , where
 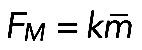 and
and 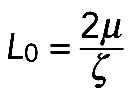 . Here
  is the average myosin-generated stress in the cross-section of the actomyosin assembly, and
  is a parameter that depends on resistance of actin filaments to shear and to being pulled from the FLP bases into the actomyosin assembly. Simply speaking, for the contractile assembly of a very small length, viscosity of actin dampens myosin contraction, because the gradient of actin flow is too high; but when the assembly is long enough, velocity at the edges is limited, the gradient of velocity becomes small, viscosity does not limit the force, and force reaches the maximum myosin stress,
  . Note that elastic bending is not a factor: F-actin persistence length is
  μm; a bundle of a few tens of filaments in the cross-section will have a persistence length of no more than
  μm (Mogilner and Rubinstein, 2005). Characteristic elastic force (Mogilner and Rubinstein, 2005) is
  pN, which is negligible (here
  pN × nm is thermal energy).
An alternative model (Figure 5A, left side) is based on the assumption that antiparallel filaments from opposite FLP bases overlap all along the bundle (or that smaller parallel filaments, but not antiparallel ones, are tightly cross-linked). So, if the bundle length is L, the overlap length between the antiparallel filaments is L, and if there are M motors per unit length of the overlap, the contractile force is equal to kML. When the bundle is too long, then the average overlap stops growing (Ferenz et al., 2009). Thus the force grows linearly at a small bundle length and then reaches a smooth plateau, and the length-dependent force can be approximated with the expression  .
.
Modeling provides theoretical arguments in favor of one of these two models. In the latter case (Figure 5A, left side), myosin clusters are predicted to slowly drift toward the edges of the arcs, because the number of filaments coming off the FLPs into the arcs decreases with the distance away from the FLP bases, in which case, myosin clusters near the arc edges would move predominantly to the highest barbed-ends concentration at the arc edges. As mathematical arguments showed (Oelz, 2014), this would lead to myosin density in the arc increasing toward the edges. We measured the myosin density along the arc and observed that, in fact, the myosin density increases linearly from the edges of the arcs to their center and peaks at the arc centers (Figure 5B).
By contrast, the model in which myosin acts locally and in series contracting small viscous actin contractile units (Figure 5A, right side) is in better agreement with the myosin density with the peak at the arc center. Equation  (introduced earlier) allows us to calculate the actomyosin flow inside the arc: the equation
 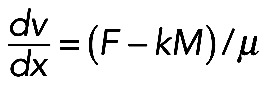 , where
 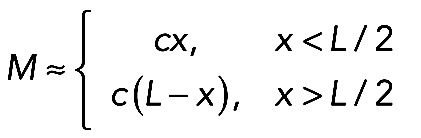 (such function M(x) approximates the data in Figure 5B well), has a solution predicting distribution of the centripetal inward actomyosin flow in the arc:
 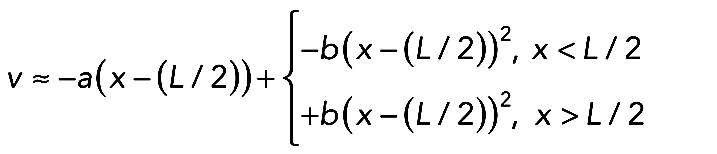 . Here a, b, and c are positive constant parameters. Myosin is driven by this flow to the center of the arc, while its detachment, diffusion in the cytoplasm, and reattachment redistributes it according to the equation (Rubinstein et al., 2009)
 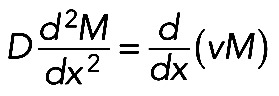 , where D is effective myosin diffusion. Symmetric solution of this equation,
 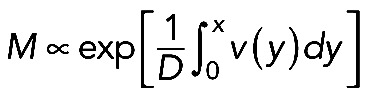 (Figure 5C; compare with the observed myosin density in Figure 5B). The fact that, when we computed the flow velocity from the observed myosin density and then predicted the myosin density generated by this flow, it compared well with the observed myosin density distribution, does not necessarily prove the model's correctness but lends support to its plausibility.
Formula  , together with Laplace's law,
  , predicts that
  . One of the predictions of this model is that the radius of the arc increases with its length, so the radius and length of the arcs positively correlate. Measurements indeed show a strong correlation between R and L (r = 0.74, p < 10−5; Figure 5D). Second, formula
  predicts that the radius of the arcs should be an increasing function of the contractile strength, which should correlate with either the concentration of myosin (if the number of myosin motors is limiting for the force) or of actin (if filament number and overlap is the limiting factor), or both (in a more general case). The data show that both radius R and arc length L correlate significantly with both actin and myosin densities at the center of the arc (Figure 5E shows respective r and p values). The characteristic force
  in the actomyosin assembly is likely to be similar to forces applied to individual adhesions, ∼103 pN (Stricker et al., 2011). Considering that the characteristic membrane tension T is ∼100 pN/μm (Gauthier et al., 2011), we predict the radius of the arcs R to be on the order of 10 μm, which is also consistent with our experimental measurements: R = 7.03 ± 0.57 μm (mean ± SEM, n = 12).
The mechanical stability of the contractile actomyosin assembly poses a question: If the length and radius fluctuate, does the assembly tend to keep a certain equilibrium radius? In general, this question requires solution of a complex mathematical problem. Here we used simple semiquantitative arguments to illustrate that, if myosin strength is significant, the structure is stable, but weak myosin will lead to mechanical instability. We investigated this question assuming a perfectly circular shape for the arc stretched between two neighboring FLP bases at constant distance  (see Supplemental Figure S1A). The bundle has length L and radius R, and we examined what effective pressure such a contractile bundle exerts on the membrane. We demonstrated earlier that in either model the contractile stress along the bundle is equal to
  . According to Laplace's law, the pressure P on the membrane from the curved bundle is
  . Both radius and length can be parameterized by the radial angle ϕ (Supplemental Figure S1A) as follows: L = ϕR, l = 2R sin (ϕ/2). We can consider l and ϕ as constant parameters and find radius and length as
 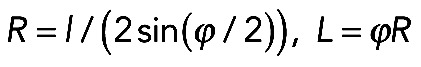 . We varied the radial angle ϕ from 0 to 2π, calculated radius and length as functions of ϕ at a given l, and for each value of ϕ, found the pressure using formula
 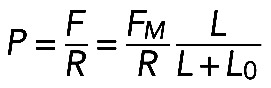 . The plots of the effective contractile pressure, P, as a function of the radial angle ϕ at two values of parameter FM, are shown in Supplemental Figure S1B.
The pressure has to be equal to the membrane tension T in equilibrium. From Supplemental Figure S1B, it is clear that there is a stable mechanical equilibrium for myosin strength greater than a threshold (blue curve is P(ϕ) for a greater value of FM). Indeed, for a smaller radial angle, the pressure is less than T , and the arc will bend, while for greater values of the angle, the pressure is higher than T, and so the bundle will stabilize at a certain radius and length. (Note that there is also a mechanically unstable steady state.) However, for myosin strength less than threshold (Supplemental Figure S1B, green curve is P(ϕ) for a smaller value of FM), there is no equilibrium, and the arc will retract centripetally. Thus the model predicts that, if cells already spread are treated with blebbistatin, the arcs would collapse to the cell body, which was indeed observed (Figure 4D). Finally, the model predicts that, if blebbistatin is washed out, the arcs would restore and advance with curvature that is almost constant for arcs whose length does not vary much, because the membrane tension is unlikely to change during these perturbations. We measured curvatures of a number of such arcs from a few cells in the process of rapid arc recovery and expansion after blebbistatin washout. In agreement with the model prediction, arcs expanded with a steady curvature (Supplemental Figure S1C).
ARPC3−/− fibroblasts exhibit a cell-autonomous defect in chemotaxis
Our previous study found that the above mode of leading-edge protrusion in ARPC3−/− mutant cells correlates with an inability to undergo chemotaxis under an EGF gradient (Suraneni et al., 2012). A separate study, however, reported that immortalized mouse embryonic fibroblasts with knockdown of the Arp2/3 complex subunits showed no chemotactic defect under a platelet-derived growth factor (PDGF) gradient (Wu et al., 2012). To determine whether this discrepancy was due to the difference in the growth factor used, we repeated the chemotactic assay with PDGF and again found ARPC3−/− but not wt fibroblasts to be deficient in chemotaxis (Figure 6, A and B). As it was possible that the mutant cells simply lacked PDGF signaling capacity, we stained wt and ARPC3−/− cells with or without PDGF stimulation with an anti-phosphotyrosine (p-Tyr) antibody. Cells of both genotypes exhibited significantly and similarly increased p-Tyr staining after PDGF stimulation for 30 min compared with unstimulated cells (Supplemental Figure S2A). In wt cells, p-Tyr in the stimulated cells was enriched at both lamellipodia and focal contacts at the ends of actin stress fibers, whereas in mutant cells, p-Tyr staining was enriched along cell edges and tips of actin bundles (Supplemental Figure S2A). This result confirms that receptor tyrosine kinase activation is not deficient in the mutant compared with wt fibroblasts, although this does not rule out a possible downstream signaling defect.
FIGURE 6:

ARPC3−/− fibroblasts have a cell-autonomous defect in chemotaxis. (A) Plots show trajectories of individual ARPC3+/+ (left panel) or ARPC3−/− (middle panel) cells migrating in a PDGF gradient. Right panel shows ARPC3+/+ cells migrating in PDGF gradient in the presence of ARPC3−/− cell-conditioned media (C.M.). (B) Histograms of the percentage of cells migrating toward (up) or away (down) the PDGF gradient in the experiments in A. Shown are mean and SEM from three experiments. (C) The ARPC3+/+ and ARPC3−/− cells were labeled with green or red live-cell tracker dye separately and were then mixed and subjected to a chemotactic assay in the presence of a PDGF gradient (500 ng/ml at the source). Shown is a representative field of a mixed population of ARPC3+/+ (green) and ARPC3 −/− (red) cells in the chemotactic chamber. (D) Plots show trajectories of individual ARPC3+/+ and ARPC3−/− cells (in the mixed-cell population in which the wt to mutant cell ratio was ∼1:3) migrating in a PDGF gradient. (E) Histograms of the percentage of cells migrating toward (up) or away (down) the PDGF gradient. Shown are mean and SEM from three experiments.
A second possible explanation of the observed mutant defect in chemotaxis, as suggested by a recent study (Wu et al., 2013), is abnormal paracrine signaling by Arp2/3-deficient but not wt fibroblasts. It was shown that immortalized embryonic fibroblasts with Arp2/3 complex subunit knockdown displayed elevated NF-κB signaling and cytokine secretion, and media conditioned by the knockdown cells inhibited chemotaxis of wt cells. Wu et al. (2013) thus attributed a chemotactic defect in growth factor gradient to interference from paracrine factors secreted by Arp2/3-deficient cells. To examine whether this explanation applies to fibroblasts used in our studies, we first examined it by using the same marker (phospho-p65) used in the previous work and found that the mutant cells did not exhibit elevated NF-κB activation (Supplemental Figure S2B). We also tested media conditioned by the mutant cells for 12 h (the duration of our chemotactic assay) and found no effect on wt cells undergoing chemotaxis under either PDGF (Figure 6, A and B) or EGF gradient (Supplemental Figure S2C). For a more definitive test, we performed a mixed-cell experiment: wt and mutant fibroblasts were first labeled with green and red live-cell tracker dyes, respectively, and then mixed and placed in the same chemotactic chamber under a PDGF gradient (Figure 6C). In three different experiments, the resultant wt and mutant cell ratios were roughly 1:3, 1:1, and 2:1. Cell tracking analysis showed that, at all ratios examined, the majority of wt cells migrated toward the gradient source, whereas mutant cells in the same chamber were defective in chemotaxis (Figure 6, D and E). This result demonstrates that the chemotactic defect of ARPC3−/− mutant fibroblasts is cell autonomous rather than resulting from paracrine interference.
DISCUSSION
Taken together, the results described above uncover a mechanism of leading-edge protrusion independent of the Arp2/3 complex, supporting the notion that cell motility can be driven by different cytoskeleton assemblies. Whereas it was known that filopodia can be nucleated and extended by DRF proteins, our findings indicate that formation of filopodia-like protrusions alone are insufficient for cell spreading; rather, this activity is coupled to myosin II–based contractility of the actin network between FLPs to generate an advancing cell edge. We propose a simple mechanical model according to which myosin II peels actin filaments off the FLP bases and reels them in to organize them into the contractile assembly. The membrane tension resists and bends the actomyosin arcs, but myosin II–driven contraction overcomes the resistance and flattens the arcs to effectively advance the leading edge. The model based on this concept is able to explain many of the observations in regard to arc radius, stability, and correlation of the geometric parameters and molecular densities on a semiquantitative level. The three events—1) peeling off of the actin filaments from the FLP bases, 2) protrusion of the FLP tips, and 3) advancement of the arcs—take place simultaneously, leading to the overall spreading and protrusion of the cell edge. How these three processes are integrated is an important question worthy of more in-depth investigation. Future work is also required to better understand the regulatory mechanism underlying the coupling of formin-mediated filopodia-like growth and myosin II activation and contractility in order to establish a quantitative model more precisely describing this mode of leading-edge formation and protrusion alternative to Arp2/3-mediated actin nucleation and treadmilling.
Our observation that fibroblasts lacking Arp2/3 complex produce formin-dependent FLPs that are much more prominent than filopodia in wt cells is also in line with the recent report in fission yeast showing that inhibition of Arp2/3 disrupted the balance of competing actin networks, leading to drastically enhanced formation of formin-nucleated actin assemblies (Burke et al., 2014). It is, however, surprising that the formin-nucleated actin network could also support leading-edge protrusion, albeit with a dramatically different morphology. The reliance on formin and myosin II to form a leading edge may explain the observed deficiency in directional motility of ARPC3−/− fibroblasts. It was shown in neutrophils that stable cell polarity, a prerequisite for sustained directional migration, is dependent on a mutual inhibitory relationship between the Rac and Arp2/3 complex–based leading edge and the Rho and myosin II–based tail (Xu et al., 2003; Wang, 2009). The mutual exclusiveness of these two types of actin assemblies may reside in both the signaling mechanisms and incompatibility of actin-interacting proteins. In mutant fibroblasts with disrupted Arp2/3 complex, the mutually inhibitory interaction between the front and back no longer exist, with myosin II localizing around the cell edges and actively driving both leading-edge protrusion and tail retraction.
It is intriguing that the mouse fibroblast cells characterized in our studies and those from recent studies exhibit common characteristics and differences (Wu et al., 2012, 2013). Both fibroblasts, which are of embryonic origin, rely on the Arp2/3 complex to form lamellipodia but differ in their ability to carry out chemotaxis without the Arp2/3 complex. The immortalized embryonic fibroblasts were only deficient in chemotaxis when paracrine factors, secreted by cells with knockdown of Arp2/3 complex subunits, obscure the growth factor gradient (Wu et al., 2013). In contrast, our differentiated fibroblasts with genetic disruption of an Arp2/3 complex subunit do not elicit paracrine effect but exhibit a cell-autonomous deficiency in chemotaxis. A simple explanation could be that the residual Arp2/3 complex in the knockdown cells is sufficient to support directional movement, as the Arp2/3 complex nucleates actin at nanomolar concentrations in the absence of paracrine effect. Alternatively, it may be true that the so-called fibroblasts in these studies are distinct, given that one cell line is immortalized, whereas the other is terminally differentiated, despite their shared morphological classification. This would underscore the notion that different cell types rely on different mechanisms for directional migration. This complexity presents a challenge not only in the study of cell motility but also in controlling cell migration for intervention of disease processes such as tumor cell metastasis.
MATERIALS AND METHODS
ARPC3+/+ and ARPC3−/− ESC culture and differentiation into fibroblasts
ARPC3+/+ and ARPC3−/− ESCs were cultured and differentiated into fibroblasts as previously described (Suraneni et al., 2012). Briefly, ARPC3+/+ and ARPC3−/− ESCs were separated from the iMEFs by transfer into new dishes every 45 min for 3 h. The ESCs were recovered by centrifugation at 1000–1200 rpm for 5 min and used for differentiation. The ESCs were resuspended in ESC medium containing leukemia inhibitory factor and plated into flasks or dishes previously coated with gelatin. The cells were allowed to settle down for 5–6 h, and ESC medium was replaced with fibroblast medium containing 0.33 μM retinoic acid (RA; Smith, 1991) and cultured for 72 h with two changes of medium change during the first 24 h. Cells were cultured for 4 more days with daily media changes without RA.
Experiments involving different drug treatments
SMIFH2 treatment.
For cell-spreading assays, ARPC3+/+ and ARPC3−/− fibroblast cells were trypsinized with 0.05% trypsin/EDTA, centrifuged, and pretreated with DMSO or 15 μM SMIFH2 (S4826; Sigma-Aldrich, St. Louis, MO) in fibroblast medium for 30 min. The cells were placed in the 37°C incubator for 10–20 min to attach to glass-bottom dishes (MatTek, Ashland, MA) coated with 5 μg/ml of bovine fibronectin (Sigma-Aldrich) before being imaged for 2 h with frames taken every 2 min. Phase-contrast imaging was performed on a Nikon Eclipse TE2000-E (Nikon, Melville, NY) equipped with a Plan Fluar 10× Ph1 DLL objective and a Photometrics (Tucson, AZ) CoolSNAP CCD camera and a 37°C incubator with 5% CO2. The SMIFH2 concentration chosen was the lowest that was able to elicit an observable effect and is within IC50 of this drug on mouse fibroblasts (Rizvi et al., 2009). In time-lapse imaging after drug washout, the SMIFH2-containing medium was removed, cells were washed with drug-free medium, the medium was replaced with fresh medium, and cells were imaged for an additional 2 h with frames taken every 2 min. The spreading area of cells was measured by outlining the cell boundary every 20 frames using ImageJ software.
Blebbistatin treatment.
For cell-spreading assays, fibroblast cells were trypsinized as described earlier and resuspended in fibroblast medium with 100 μM of blebbistatin (B0560; Sigma-Aldrich). This concentration was also in line with that used in other studies involving mammalian cells (Straight et al., 2003; Duxbury et al., 2004). The cells were allowed to attach to glass-bottom dishes (MatTek) coated with 5 μg/ml of bovine fibronectin (Sigma-Aldrich) by placing them in the 37°C incubator for 10–20 min before imaging, as described earlier. Imaging after drug washout was also performed as described for SMIFH2 treatment experiments. For treating cells already spread and undergoing random migration, cell were cultured in the fibroblast medium overnight on glass-bottom dishes and imaged for 2 h with frames taken every 2 min. After addition of 100 μM of blebbistatin, cells were imaged for 2 h. The drug was then removed, and cells were washed with fibroblast medium, fresh medium was added, and cells were imaged for an additional 2 h.
Fluorescence staining
ARPC3+/+ and ARPC3−/− fibroblast cells were allowed to spread on glass-bottom dishes for 2 h and were fixed with 4% paraformaldehyde in phosphate-buffered saline (PBS) at 37°C for 30 min. The cells were blocked by incubation in PBS with 3% bovine serum albumin (BSA) and 0.2% Tween-20 for 1 h and were incubated with primary rabbit antibodies against: myosin IIA (M8064; Sigma-Aldrich) at a dilution of 1:50, p-MYL9 (sc-12896, Santa Cruz Biotechnology, Dallas, TX) at a dilution of 1:30, or paxilin (612405; BD Biosciences, San Jose, CA) at a dilution of 1:100 overnight at 4°C. Cells were washed three times in PBS with 0.02% Tween-20 and were incubated in secondary antibody Alexa Fluor 488–conjugated mouse anti-rabbit or Alexa Fluor 488–conjugated goat anti-mouse at a dilution of 1:250 for 1 h at room temperature. Cells were washed with PBS + 0.02% Tween-20, counterstained with 4′,6-diamidino-2-phenylindole (DAPI) for DNA and fluorescent phalloidin (A22283; Molecular Probes, Eugene, OR) for actin filaments for 20 min, and mounted in IBIDI (50001; Ibidi, Verona, WI) mounting medium. The cells were imaged under a Zeiss LSM-510-LIVE confocal microscope (Carl Zeiss, Germany). For SIM imaging, spreading cells were fixed and processed as described earlier and were labeled with fluorescent phalloidin (A22283; Molecular Probes) for 20 min and mounted in IBIDI mounting medium. The images were captured and processed using a Deltavision OMX Super-Resolution microscope system (Applied Precision, Pittsburgh, PA).
ARPC3+/+ and ARPC3−/− fibroblast cells were cultured on glass-bottom dishes overnight and then switched to DMEM with 0.5% serum for 12 h and stimulated with 25 ng/ml of PDGF for 30 min. The cells were fixed with 4% paraformaldehyde in PBS at 37°C for 30 min, blocked in PBS with 3% BSA and 0.2% Tween-20, and incubated with primary rabbit antibodies against p-Tyr (P-Tyr-100; 9411S; Cell Signaling, Danvers, MA) at a dilution of 1:50 overnight at 4ºC; this was followed by washing and staining with Alexa Fluor 488–conjugated rabbit anti-mouse secondary antibody and counterstaining with DAPI and phalloidin as described earlier. The cells were imaged under a Zeiss LSM-510-LIVE confocal microscope. Whole-cell fluorescence signal was measured with background subtraction by using an ImageJ plug-in.
Chemotactic assays
Chemotactic assays were performed as described previously (Suraneni et al., 2012), with several modifications. Briefly, ARPC3+/+ or ARPC3−/− fibroblast cells were trypsinized, diluted to ∼2 × 10⁶ cells/ml, and plated in a μ-Slide Chemotaxis slides (Ibidi, Martinsried, Germany) precoated with 5 μg/ml of fibronectin and allowed to recover for 5–6 h. The medium was replaced with low-serum medium (DMEM with 0.5% FBS) overnight, followed by replacement with fibroblast medium. Then one of the ports was filled with chemoattractant (500 ng/ml PDGF or EGF) solution. Cell migration in response to chemotactic signal was recorded by placing the μ-Slide on an inverted Nikon Eclipse TE2000-E microscope with a 37°C incubator and 5% CO2 for a period of 12 h with frames taken every 20 min. Cell-trajectory analysis was performed as described previously (Suraneni et al., 2012).
For the mixed-cells experiment, wt and mutant fibroblasts were labeled with live-cell tracker green CMFDA (C7025; Life Technologies, Grand Island, NY) and red CMTPX (C34552; Life Technologies), respectively, before trypsinization and mixing. The ARPC3+/+ cells with ARPC3−/− cells conditional medium experiments were performed by collecting the medium from ARPC3−/− cell dishes after 12 h of culturing. The remaining procedure was performed as described in the preceding section.
Leading-edge arc analysis
The cells were allowed to spread for 2 h on MatTek dishes precoated with 5 μg/ml fibronectin, during which phase-contrast movies were acquired every 2 min. For analysis of arc parameters, six frames, 10 min apart, were selected from a 2-h movie. Arc measurements for each spreading cell were performed by selecting three points for each arc—two points at the adjacent FLP bases (the arc length L was measured between these points) and the third one in the midpoint of the arc (see Figure 5A). Fitting of a circular arc that passes all three selected points produced the arc curvature radius R. To make sure no artifacts were introduced, we excluded all arcs for which L > πR, because such measurement often stemmed from assigning a wrong endpoint to an arc. For estimation of the concentration of actin and myosin in an arc, a line normal to the leading edge at the midpoint of the arc was drawn, the corresponding fluorescent signal intensity profile was measured along this line, and then the maximal value was selected. Not all arcs were selected at each micrograph; rather, a random selection of around 20 arcs easily identifiable visually (but without regard to the size of the arc) was made. For correlation of arc lengths and radii, a total of 1728 arcs from 12 cells were examined. For correlation of arc radii and lengths with actin and myosin densities, a total of 108 arcs from eight cells were examined.
For measuring the active myosin density along the arcs, the cells were fixed and stained with p-MYL9 antibody. The arc regions from the p-MYL9 images were then selected by drawing a 2-pixel-wide curve along the arc. The average myosin density distribution was measured using an ImageJ plug-in. These distributions were scaled in such a way that arc length was scaled to unity, and the maximal myosin density along the arc was also set equal to unity. The plots in Figure 5B represents the mean (blue curve) and the SD (brown curve) of 11 phosphomyosin scaled distributions.
Modeling
The modeling is based on analytical solutions of ordinary differential equations and of algebraic equations by standard methods of applied mathematics.
Supplementary Material
Acknowledgments
We thank K. Eggan and D. Egli (Harvard University) for advice on ESC derivation; B. Slaughter and J. Unruh (Stowers Institute) for assisting with imaging; J. Reynolds (Stowers Institute) for mouse maintenance; and M. Miller for assisting with illustrative drawing. This work was supported by National Institutes of Health grants P01 GM 066311 (R.L.) and RO1 GM 068952 (A.M.).
Abbreviations used:
- 1D
one dimensional
- 2D
two dimensional
- BSA
bovine serum albumin
- DAPI
4′,6-diamidino-2-phenylindole
- DMSO
dimethyl sulfoxide
- DRF
diaphanous-related formins
- EGF
epidermal growth factor
- ESC
embryonic stem cell
- FH2
formin homology domain 2
- FLP
filopodia-like protrusion
- iMEF
irradiated mouse embryonic fibroblast
- PBS
phosphate-buffered saline
- PDGF
platelet-derived growth factor
- p-Tyr
phosphotyrosine
- RA
retinoic acid
- SIM
structured illumination microscopy
- wt
wild type.
Footnotes
This article was published online ahead of print in MBoC in Press (http://www.molbiolcell.org/cgi/doi/10.1091/mbc.E14-07-1250) on January 7, 2015.
*Present address: Robert Lurie Comprehensive Cancer Center, Department of Medicine, Northwestern University, Chicago, IL 60611.
REFERENCES
- Bailly M, Ichetovkin I, Grant W, Zebda N, Machesky LM, Segall JE, Condeelis J. The F-actin side binding activity of the Arp2/3 complex is essential for actin nucleation and lamellipod extension. Curr Biol. 2001;11:620–625. doi: 10.1016/s0960-9822(01)00152-x. [DOI] [PubMed] [Google Scholar]
- Bar-Ziv R, Tlusty T, Moses E, Safran SA, Bershadsky A. Pearling in cells: a clue to understanding cell shape. Proc Natl Acad Sci USA. 1999;96:10140–10145. doi: 10.1073/pnas.96.18.10140. [DOI] [PMC free article] [PubMed] [Google Scholar]
- Block J, Stradal TEB, Hänisch J, Geffers R, Köstler SA, Urban E, Small JV, Rottner K, Faix J. Filopodia formation induced by active mDia2/Drf3. J Microsc. 2008;231:506–517. doi: 10.1111/j.1365-2818.2008.02063.x. [DOI] [PubMed] [Google Scholar]
- Bugyi B, Carlier MF. Control of actin filament treadmilling in cell motility. Annu Rev Biophys. 2010;39:449–470. doi: 10.1146/annurev-biophys-051309-103849. [DOI] [PubMed] [Google Scholar]
- Burke TA, Christensen JR, Barone E, Suarez C, Sirotkin V, Kovar DR. Homeostatic actin cytoskeleton networks are regulated by assembly factor competition for monomers. Curr Biol. 2014;24:579–585. doi: 10.1016/j.cub.2014.01.072. [DOI] [PMC free article] [PubMed] [Google Scholar]
- Burnette DT, Manley S, Sengupta P, Sougrat R, Davidson MW, Kachar B, Lippincott-Schwartz J. A role for actin arcs in the leading-edge advance of migrating cells. Nat Cell Biol. 2011;13:371–381. doi: 10.1038/ncb2205. [DOI] [PMC free article] [PubMed] [Google Scholar]
- Cai Y, Biais N, Giannone G, Tanase M, Jiang G, Hofman JM, Wiggins CH, Silberzan P, Buguin A, Ladoux B, Sheetz MP. Nonmuscle myosin IIA-dependent force inhibits cell spreading and drives F-actin flow. Biophys J. 2006;91:3907–3920. doi: 10.1529/biophysj.106.084806. [DOI] [PMC free article] [PubMed] [Google Scholar]
- Cai Y, Rossier O, Gauthier NC, Biais N, Fardin MA, Zhang X, Miller LW, Ladoux B, Cornish VW, Sheetz MP. Cytoskeletal coherence requires myosin-IIA contractility. J Cell Sci. 2010;123:413–423. doi: 10.1242/jcs.058297. [DOI] [PMC free article] [PubMed] [Google Scholar]
- Chhabra ES, Higgs HN. The many faces of actin: matching assembly factors with cellular structures. Nat Cell Biol. 2007;9:1110–1121. doi: 10.1038/ncb1007-1110. [DOI] [PubMed] [Google Scholar]
- Di Nardo A, Cicchetti G, Falet H, Hartwig JH, Stossel TP, Kwiatkowski DJ. Arp2/3 complex-deficient mouse fibroblasts are viable and have normal leading-edge actin structure and function. Proc Natl Acad Sci USA. 2005;102:16263–16268. doi: 10.1073/pnas.0508228102. [DOI] [PMC free article] [PubMed] [Google Scholar]
- Duxbury MS, Ashley SW, Whang EE. Inhibition of pancreatic adenocarcinoma cellular invasiveness by blebbistatin: a novel myosin II inhibitor. Biochem Biophys Res Commun. 2004;313:992–997. doi: 10.1016/j.bbrc.2003.12.031. [DOI] [PubMed] [Google Scholar]
- Eisenmann KM, Peng J, Wallar BJ, Alberts AS. Rho GTPase-formin pairs in cytoskeletal remodelling. Novartis Found Symp. 2005;269:206–218. doi: 10.1002/047001766x.ch16. discussion 219–230. [DOI] [PubMed] [Google Scholar]
- Ferenz NP, Paul R, Fagerstrom C, Mogilner A, Wadsworth P. Dynein antagonizes eg5 by crosslinking and sliding antiparallel microtubules. Curr Biol. 2009;19:1833–1838. doi: 10.1016/j.cub.2009.09.025. [DOI] [PMC free article] [PubMed] [Google Scholar]
- Gauthier NC, Fardin MA, Roca-Cusachs P, Sheetz MP. Temporary increase in plasma membrane tension coordinates the activation of exocytosis and contraction during cell spreading. Proc Natl Acad Sci USA. 2011;108:14467–14472. doi: 10.1073/pnas.1105845108. [DOI] [PMC free article] [PubMed] [Google Scholar]
- Glenney JR, Jr, Zokas L. Novel tyrosine kinase substrates from Rous sarcoma virus-transformed cells are present in the membrane skeleton. J Cell Biol. 1989;108:2401–2408. doi: 10.1083/jcb.108.6.2401. [DOI] [PMC free article] [PubMed] [Google Scholar]
- Hall A. Rho GTPases and the actin cytoskeleton. Science. 1998;279:509–514. doi: 10.1126/science.279.5350.509. [DOI] [PubMed] [Google Scholar]
- Harris ES, Gauvin TJ, Heimsath EG, Higgs HN. Assembly of filopodia by the formin FRL2 (FMNL3) Cytoskeleton (Hoboken) 2010;67:755–772. doi: 10.1002/cm.20485. [DOI] [PMC free article] [PubMed] [Google Scholar]
- Higashida C, Miyoshi T, Fujita A, Oceguera-Yanez F, Monypenny J, Andou Y, Narumiya S, Watanabe N. Actin polymerization-driven molecular movement of mDia1 in living cells. Science. 2004;303:2007–2010. doi: 10.1126/science.1093923. [DOI] [PubMed] [Google Scholar]
- Lewis AK, Bridgman PC. Nerve growth cone lamellipodia contain two populations of actin filaments that differ in organization and polarity. J Cell Biol. 1992;119:1219–1243. doi: 10.1083/jcb.119.5.1219. [DOI] [PMC free article] [PubMed] [Google Scholar]
- Machesky LM, Insall RH. Scar1 and the related Wiskott–Aldrich syndrome protein, WASP, regulate the actin cytoskeleton through the Arp2/3 complex. Curr Biol. 1998;8:1347–1356. doi: 10.1016/s0960-9822(98)00015-3. [DOI] [PubMed] [Google Scholar]
- Mallavarapu A, Mitchison T. Regulated actin cytoskeleton assembly at filopodium tips controls their extension and retraction. J Cell Biol. 1999;146:1097–1106. doi: 10.1083/jcb.146.5.1097. [DOI] [PMC free article] [PubMed] [Google Scholar]
- Mogilner A, Rubinstein B. The physics of filopodial protrusion. Biophys J. 2005;89:782–795. doi: 10.1529/biophysj.104.056515. [DOI] [PMC free article] [PubMed] [Google Scholar]
- Mullins RD, Heuser JA, Pollard TD. The interaction of Arp2/3 complex with actin: nucleation, high affinity pointed end capping, and formation of branching networks of filaments. Proc Natl Acad Sci USA. 1998;95:6181–6186. doi: 10.1073/pnas.95.11.6181. [DOI] [PMC free article] [PubMed] [Google Scholar]
- Oelz D. A viscous two-phase model for contractile actomyosin bundles. J Math Biol. 2014;68:1653–1676. doi: 10.1007/s00285-013-0682-6. [DOI] [PubMed] [Google Scholar]
- Paul AS, Pollard TD. Review of the mechanism of processive actin filament elongation by formins. Cell Motil Cytoskeleton. 2009;66:606–617. doi: 10.1002/cm.20379. [DOI] [PMC free article] [PubMed] [Google Scholar]
- Pellegrin S, Mellor H. The Rho family GTPase Rif induces filopodia through mDia2. Curr Biol. 2005;15:129–133. doi: 10.1016/j.cub.2005.01.011. [DOI] [PubMed] [Google Scholar]
- Peng J, Wallar BJ, Flanders A, Swiatek PJ, Alberts AS. Disruption of the Diaphanous-related formin Drf1 gene encoding mDia1 reveals a role for Drf3 as an effector for Cdc42. Curr Biol. 2003;13:534–545. doi: 10.1016/s0960-9822(03)00170-2. [DOI] [PubMed] [Google Scholar]
- Pollard TD. Regulation of actin filament assembly by Arp2/3 complex and formins. Annu Rev Biophys Biomol Struct. 2007;36:451–477. doi: 10.1146/annurev.biophys.35.040405.101936. [DOI] [PubMed] [Google Scholar]
- Pollard TD, Borisy GG. Cellular motility driven by assembly and disassembly of actin filaments. Cell. 2003;112:453–465. doi: 10.1016/s0092-8674(03)00120-x. [DOI] [PubMed] [Google Scholar]
- Rizvi SA, Neidt EM, Cui J, Feiger Z, Skau CT, Gardel ML, Kozmin SA, Kovar DR. Identification and characterization of a small molecule inhibitor of formin-mediated actin assembly. Chem Biol. 2009;16:1158–1168. doi: 10.1016/j.chembiol.2009.10.006. [DOI] [PMC free article] [PubMed] [Google Scholar]
- Rubinstein B, Fournier MF, Jacobson K, Verkhovsky AB, Mogilner A. Actin-myosin viscoelastic flow in the keratocyte lamellipod. Biophys J. 2009;97:1853–1863. doi: 10.1016/j.bpj.2009.07.020. [DOI] [PMC free article] [PubMed] [Google Scholar]
- Schirenbeck A, Bretschneider T, Arasada R, Schleicher M, Faix J. The Diaphanous-related formin dDia2 is required for the formation and maintenance of filopodia. Nat Cell Biol. 2005;7:619–625. doi: 10.1038/ncb1266. [DOI] [PubMed] [Google Scholar]
- Shutova M, Yang C, Vasiliev JM, Svitkina T. Functions of nonmuscle myosin II in assembly of the cellular contractile system. PLoS One. 2012;7:e40814. doi: 10.1371/journal.pone.0040814. [DOI] [PMC free article] [PubMed] [Google Scholar]
- Small JV. The actin cytoskeleton. Electron Microsc Rev. 1988;1:155–174. doi: 10.1016/s0892-0354(98)90010-7. [DOI] [PubMed] [Google Scholar]
- Smith AG. Culture and differentiation of embryonic stem cells. Methods Cell Sci. 1991;13:89–94. [Google Scholar]
- Steffen A, Faix J, Resch GP, Linkner J, Wehland J, Small JV, Rottner K, Stradal TE. Filopodia formation in the absence of functional WAVE- and Arp2/3-complexes. Mol Biol Cell. 2006;17:2581–2591. doi: 10.1091/mbc.E05-11-1088. [DOI] [PMC free article] [PubMed] [Google Scholar]
- Straight AF, Cheung A, Limouze J, Chen I, Westwood NJ, Sellers JR, Mitchison TJ. Dissecting temporal and spatial control of cytokinesis with a myosin II inhibitor. Science. 2003;299:1743–1747. doi: 10.1126/science.1081412. [DOI] [PubMed] [Google Scholar]
- Stricker J, Aratyn-Schaus Y, Oakes PW, Gardel ML. Spatiotemporal constraints on the force-dependent growth of focal adhesions. Biophys J. 2011;100:2883–2893. doi: 10.1016/j.bpj.2011.05.023. [DOI] [PMC free article] [PubMed] [Google Scholar]
- Suraneni P, Rubinstein B, Unruh JR, Durnin M, Hanein D, Li R. The Arp2/3 complex is required for lamellipodia extension and directional fibroblast cell migration. J Cell Biol. 2012;197:239–251. doi: 10.1083/jcb.201112113. [DOI] [PMC free article] [PubMed] [Google Scholar]
- Svitkina TM, Borisy GG. Arp2/3 complex and actin depolymerizing factor/cofilin in dendritic organization and treadmilling of actin filament array in lamellipodia. J Cell Biol. 1999;145:1009–1026. doi: 10.1083/jcb.145.5.1009. [DOI] [PMC free article] [PubMed] [Google Scholar]
- Svitkina TM, Bulanova EA, Chaga OY, Vignjevic DM, Kojima S, Vasiliev JM, Borisy GG. Mechanism of filopodia initiation by reorganization of a dendritic network. J Cell Biol. 2003;160:409–421. doi: 10.1083/jcb.200210174. [DOI] [PMC free article] [PubMed] [Google Scholar]
- Vicente-Manzanares M, Ma X, Adelstein RS, Horwitz AR. Non-muscle myosin II takes centre stage in cell adhesion and migration. Nat Rev Mol Cell Biol. 2009;10:778–790. doi: 10.1038/nrm2786. [DOI] [PMC free article] [PubMed] [Google Scholar]
- Wakatsuki T, Wysolmerski RB, Elson EL. Mechanics of cell spreading: role of myosin II. J Cell Sci. 2003;116:1617–1625. doi: 10.1242/jcs.00340. [DOI] [PubMed] [Google Scholar]
- Wallar BJ, Alberts AS. The formins: active scaffolds that remodel the cytoskeleton. Trends Cell Biol. 2003;13:435–446. doi: 10.1016/s0962-8924(03)00153-3. [DOI] [PubMed] [Google Scholar]
- Wang F. The signaling mechanisms underlying cell polarity and chemotaxis. Cold Spring Harbor Persp Biol. 2009;1:a002980. doi: 10.1101/cshperspect.a002980. [DOI] [PMC free article] [PubMed] [Google Scholar]
- Welch MD, DePace AH, Verma S, Iwamatsu A, Mitchison TJ. The human Arp2/3 complex is composed of evolutionarily conserved subunits and is localized to cellular regions of dynamic actin filament assembly. J Cell Biol. 1997;138:375–384. doi: 10.1083/jcb.138.2.375. [DOI] [PMC free article] [PubMed] [Google Scholar]
- Wu C, Asokan SB, Berginski ME, Haynes EM, Sharpless NE, Griffith JD, Gomez SM, Bear JE. Arp2/3 is critical for lamellipodia and response to extracellular matrix cues but is dispensable for chemotaxis. Cell. 2012;148:973–987. doi: 10.1016/j.cell.2011.12.034. [DOI] [PMC free article] [PubMed] [Google Scholar]
- Wu C, Haynes EM, Asokan SB, Simon JM, Sharpless NE, Baldwin AS, Davis IJ, Johnson GL, Bear JE. Loss of Arp2/3 induces an NF-κB-dependent, nonautonomous effect on chemotactic signaling. J Cell Biol. 2013;203:907–916. doi: 10.1083/jcb.201306032. [DOI] [PMC free article] [PubMed] [Google Scholar]
- Xu J, Wang F, Van Keymeulen A, Herzmark P, Straight A, Kelly K, Takuwa Y, Sugimoto N, Mitchison T, Bourne HR. Divergent signals and cytoskeletal assemblies regulate self-organizing polarity in neutrophils. Cell. 2003;114:201–214. doi: 10.1016/s0092-8674(03)00555-5. [DOI] [PubMed] [Google Scholar]
- Yang C, Czech L, Gerboth S, Kojima S, Scita G, Svitkina T. Novel roles of formin mDia2 in lamellipodia and filopodia formation in motile cells. PLoS Biol. 2007;5:e317. doi: 10.1371/journal.pbio.0050317. [DOI] [PMC free article] [PubMed] [Google Scholar]
- Yang C, Svitkina T. Filopodia initiation: focus on the Arp2/3 complex and formins. Cell Adh Migr. 2011;5:402–408. doi: 10.4161/cam.5.5.16971. [DOI] [PMC free article] [PubMed] [Google Scholar]
Associated Data
This section collects any data citations, data availability statements, or supplementary materials included in this article.