

Abstract
Quantitative ultrasound (QUS) imaging is hypothesized to map temperature elevations induced in tissue with high spatial and temporal resolution. To test this hypothesis, QUS techniques were examined to monitor high-intensity focused ultrasound (HIFU) exposure of tissue. In situ experiments were conducted on mammary adenocarcinoma tumors grown in rats and lesions were formed using a HIFU system. A thermocouple was inserted into the tumor to provide estimates of temperature at one location. Backscattered time-domain waveforms from the tissue during exposure were recorded using a clinical ultrasonic imaging system. Backscatter coefficients were estimated using a reference phantom technique. Two parameters were estimated from the backscatter coefficient (effective scatterer diameter (ESD) and effective acoustic concentration (EAC). The changes in the average parameters in the regions corresponding to the HIFU focus over time were correlated to the temperature readings from the thermocouple. The changes in the EAC parameter were consistently correlated to temperature during both heating and cooling of the tumors. The changes in the ESD did not have a consistent trend with temperature. The mean ESD and EAC before exposure were 120 ± 16 μm and 32 ± 3 db/cm3, respectively, and changed to 144 ± 9 μm and 51 ± 7 db/cm3, respectively, just before the last HIFU pulse was delivered to the tissue. After the tissue cooled down to 37°C, the mean ESD and EAC were 126 ± 8 μm and 35 ± 4 db/cm3, respectively. Peak temperature in the range of 50–60°C was recorded by a thermocouple placed just behind the tumor. These results suggest that QUS techniques have the potential to be used for non-invasive monitoring of HIFU exposure.
Keywords: quantitative ultrasound imaging, HIFU, effective scatterer diameter, effective scatterer concentration, parametric imaging
Introduction
High-intensity focused ultrasound (HIFU) is a promising technique for clinical therapies involving non-invasive thermal ablation or hyperthermia.1 HIFU allows the targeting of small regions for thermal ablation or hyperthermia treatment and has been successfully demonstrated in animal models of cancer and in limited clinical studies and treatments. A review of clinical studies involving HIFU to treat disease was provided by Kennedy.1 For example, currently, HIFU therapy has been approved in the United States for the treatment of uterine fibroids.2,3 To promote further clinical use of HIFU therapy, a robust imaging and monitoring system is essential.4 Ultrasound, X-ray, computed tomography (CT), and magnetic resonance imaging (MRI) have been examined as tools to monitor the temperature rise in tissues treated with HIFU and to guide exposures. Currently, MRI is considered the most accurate and robust method to monitor and quantify temperature elevations in tissues treated with HIFU non-invasively and in the presence of tissue motion. An accuracy of 1°C and 1 s with a spatial resolution of approximately 2 mm has been reported for MRI thermometry for non-moving tissues.5 When motion is present, proton-resonance frequency techniques for MRI thermometry have been explored but have achieved only near-real time (i.e., 10 Hz) and require predictable motion patterns to implement the registration algorithms.6–8 Quesson and co-workers measured local temperature maps with an accuracy of 1°C to 2°C and a temporal resolution of 400 ms using the proton-resonance frequency techniques in pig liver and kidney in vivo.7 However, MRI is an expensive imaging modality, non-portable, and requires specialized HIFU equipment in order not to interfere with the MRI system.
Ultrasound is an attractive imaging modality to guide and monitor HIFU treatment because it is non-ionizing, inexpensive, portable, and real time. Because of its attractiveness, several ultrasonic techniques have been investigated for monitoring, quantifying, and mapping the temperature rises induced in tissues by HIFU treatment. The most widely explored approach to ultrasonic thermometry is to quantify the changes in speed of sound and/or attenuation.9–15 Bamber and Hill showed that the speed of sound in excised bovine and human liver increases with increasing temperature with the maximum increase at approximately 50°C.16 Researchers observed that in canine liver samples, sound speed increased by 20 m/s over the 22°C to 60°C range and decreased by 15 m/s with the increasing temperature range of 60°C to 90°C.17 Miller et al.18 observed that tissue composition from the same anatomical site varies from patient to patient resulting in different temperature dependences of the speed of sound. Generally, as temperature increases, in most soft tissues, the speed of sound also increases, which causes a slight time shift in backscattered echoes.19 This time shift can be detected by cross-correlating signals from a region at one temperature with signals from the same region at a different temperature.
Using cross-correlation techniques to detect time shifts, investigators have claimed the ability to detect changes in temperature as small as 1°C with a good spatial and temporal resolution.9 In one study, a mean difference was observed between the ultrasound and thermocouple data of 0.06°C and maximum difference of 0.24°C. The authors reported the spatial resolutions of 1.2, 1, and 1.1 mm along the axial, lateral, and elevation directions, respectively.9 Recent advances have tracked changes in three-dimensional (3D) volumes as opposed to two-dimensional (2D) image planes.9 Finally, these techniques offer the possibility of real-time tracking of temperature changes in vivo. Varghese et al. used a cross-correlation technique to monitor temperature in the range of 45°C to 100°C during radiofrequency (RF) ablation of in vivo muscle tissues in pigs with a time resolution of 0.5 s.12 However, time-domain cross-correlation methods are limited due to several factors. For example, the time-domain cross-correlation methods are limited by motion in subsequent acquisition scans.13 Motion between the acquisition of imaging frames causes scan lines to become de-correlated, and errors in the estimation of time shifts become large. Lai et al. used a 2D speckle tracking algorithm combined with motion artifact compensation for thermometry in rat tumors in vivo for small changes in the tissue temperature (4°C–5°C increase) with an error ranging from −1.1°C to 1.0°C.20 Researchers have used 2D M-mode to capture and compensate tissue motion by using a high frame rate signal acquisition system and achieved an ultrasound thermometry sensitivity of 1°C.21,22 Daniels and Varghese accounted for motion artifacts using a dynamic frame selection method for temperature monitoring of RF ablation.23 The dynamic frame selection algorithm dynamically selects the next suitable ultrasonic image frame by optimizing the noise and error in the estimates and uses the frame-to-frame displacement calculation scheme.23 Also, sound speed and thermal expansion coefficients do not always follow the same linear increases relative to temperature increases for every type of tissue. Techavipoo and co-workers observed increases in sound speed in the temperature range of 25°C to 40°C, with moderate increases in the range of 40°C to 70°C and decreases with increasing temperature from 70°C to 95°C in canine liver, muscle, kidney, and prostate in vitro.24 Researchers have used thermal strain imaging to monitor in vitro and in vivo RF ablations in the porcine model.25–27 Varghese and Daniels developed a calibration curve combined with a speckle tracking algorithm to track local displacement for ultrasound strain imaging for temperature monitoring.27 It was proposed that after 50°C, there is minimal change in sound speed, and thermal expansion mainly contributes to displacement in tissues during RF ablation of in vitro and in vivo porcine myocardium.26
Other investigators have examined spectral techniques for monitoring the temperature increases in tissues treated with HIFU.19,28,29 In one technique, investigators hypothesized that the sound speed and density of sub-wavelength scatterers would change when subjected to hyperthermia treatment leading to a change in the scattering cross-section of the scatterers.29 Based on this theory, the investigators examined the changes in the backscattered energy (CBEs) versus temperature over the range of 37°C to 50°C. They found that the backscattered energy changed monotonically with temperature with either a positive or negative slope depending on the location in the scanned region. However, like earlier techniques involving echo shifts, the technique to estimate CBEs depended on correlating the same tissue regions during temperature increases and was therefore sensitive to tissue motion. In other studies, the change in ultrasound backscatter energy between pre- and post-HIFU-treated sites in the prostate was used to detect tissue changes and visualize treatment sites.30,31 The authors developed a color mapping based on the change in ultrasound backscatter energy for differentiating between treated and untreated tissue.30,31
Researchers have investigated the change in attenuation with increasing temperature.16,24,32 Bamber and Hill found that changes in attenuation coefficients with elevations in temperature were more significant at higher frequencies in different tissue samples such as bovine and human liver.16 Researchers observed tissue-dependent characteristics of change in attenuation with increasing temperature in the range of 25°C to 95°C in excised canine soft tissues.24 Specifically, they observed no change in attenuation in canine livers versus temperature and linearly increasing attenuation in excised canine prostate tissue versus temperature.24 In our previous work, we observed decreased attenuation with increasing temperature in excised rabbit and beef liver sample in the temperature range of 37°C to 50°C.32 Therefore, attenuation is dependent on tissue temperature, and is also dependent on the state of the tissue, that is, treated versus untreated.33
All of the above ultrasound-based approaches have had limited success in monitoring temperature rise in tissues or assessing treatment after HIFU.9–15,19–21,23,27–29 Techniques are still needed that can be calibrated to tissue-specific parameters, robust against tissue motion, and provide parameters that are sensitive to small temperature increases. In this study, quantitative ultrasound (QUS) model–based imaging approaches were explored for their sensitivity to changes in tissue scattering properties during HIFU therapy. The QUS method has the potential to be more robust to tissue motion compared with techniques relying on estimating temperature from one frame to the next, that is, estimating sound speed from frame-to-frame cross-correlation. QUS parameters are estimated from the current frame and do not need any information from previous frames.
QUS techniques have been successfully used to characterize tissue microstructure.34 Compared with CBE techniques,29 spectral-based QUS techniques rely on examining the characteristic of the frequency-dependent backscatter coefficient (BSC), which is a fundamental property of the tissue. Furthermore, the BSC is derived from the backscattered power spectrum, which is phase insensitive. In the QUS technique, absolute parametric values that are related to the scattering properties in terms of shape and scattering strength are derived from BSC. The BSC is a fundamental property of the tissue and tissue state and its calculation from measurements does not rely upon a frame acquired at a previous time, as opposed to temperature estimation based on sound speed techniques that rely upon correlating signals separated by acquisition time. For this reason, the calculation of the BSC for a tissue for a particular frame is insensitive to tissue motion. Previous experiments with biological phantoms and fresh liver samples in a saline bath indicated that changes in QUS parameters could be correlated to temperature elevations in tissues.32,35 Therefore, these studies suggest that QUS has the potential to be used to monitor temperature elevations induced in tissues during HIFU treatment.
To test the ability of QUS to monitor transient changes in tissues during HIFU exposure, HIFU was used to expose solid tumors in rats in situ. The rats were euthanized prior to the experiment. The in situ experiments were specifically conducted to minimize the effects of blood flow on QUS estimates for this preliminary study and to provide better control over the experimental apparatus with the goal of future experiments being conducted in vivo. In the following sections, the experimental methods used to test the ability of QUS to monitor transient changes in tissues due to HIFU exposure are described followed by results and discussion regarding the study. If these QUS techniques are found capable of mapping temperature during HIFU, then these techniques could provide real-time feedback for HIFU therapy (e.g., targeted hyperthermia or possibly ablation).
Method
Tumor Samples
The experimental protocol was approved by the Institutional Animal Care and Use Committee (IACUC), University of Illinois, Urbana–Champaign, and satisfied all University and National Institutes of Health (NIH) rules for the humane use of laboratory animals. A rat mammary adeno-carcinoma cell line, 13762 MAT B III (MAT) cells (American Type Culture Collection [ATCC], Manassas, VA, USA), was cultured in ATCC-formulated McCoy’s 5a medium (modified) along with 10% fetal bovine serum (Hyclone Laboratories, Logan, UT, USA) and 1% penicillin-streptomycin (Hyclone Laboratories) under conditions of 5% CO2 and 95% humidity at 37°C. A Reichert Bright-Line® hemocytometer (Hausser Scientific, Buffalo, New York, NY, USA) was used to count viable cells and estimate the concentration of cells. A volume of 100 μL containing 500 cells was injected subcutaneously into both the right and left abdominal mammary fat pads of female 10- to 21-week-old Fischer 344 rats (Harlan Laboratories, Inc., Indianapolis, IN, USA). Prior to injecting the MAT cells, the rats were weighed and then anesthetized with isoflurane. Ultrasonic experiments were conducted on animals that had tumors of 8 to 9 mm in diameter. For each experiment, the animal was euthanized and hair over the tumor was shaved and depilated before the ultrasound exposure.
Histopathologic sections of tumors were generated for each tumor sample after exposure and tissue sections were stained with hematoxylin and eosin (H&E). In addition, histopathological samples were prepared of tumor samples before treatment. In this two-step staining process, first the cell nuclei were colored blue with hematoxylin, and then other structures such as the cellular cytoplasm were stained in shades of red or pink with eosin. The resulting microscope slides were examined by a pathologist.
Ultrasonic Method
The MAT tumors in the rats were exposed in situ to HIFU using a single-element 1-MHz ( f / 1.1 ) transducer with an aperture diameter of 4.7 cm that was powered by an A150–55 dB power amplifier (ENI, Rochester, NY, USA) and excited by an arbitrary waveform generator (HP 33120a; Agilent Technologies, Santa Clara, CA, USA). The (−6 dB) beamwidth and focal length of the HIFU transducer were 1.8 mm and 5.2 cm, respectively, as measured in degassed water at 37°C using a needle hydrophone (Precision Acoustics, Dorchester, UK). The exposure was monitored using a SonixRP clinical ultrasound system (Ultrasonix, Richmond, British Columbia, Canada) and an L14-5/38 probe with signals recorded at a sampling frequency of 40 MHz. The probe had a center frequency of 6 MHz as estimated in the pulse-echo mode. A custom holder was designed to hold both the HIFU transducer and imaging probe such that the focal region of the HIFU transducer was aligned automatically with the imaging plane of the SonixRP probe and no further adjustment was required. The experimental setup is shown in Figure 1(a) and the custom holder is shown in Figure 1(b). A needle thermocouple (HYP1-30-1/2-T-G-60-SMPW-M; Omega Engineering, Inc., Stamford, CT, USA) was inserted into the tumor to monitor the temperature profile during the experiment. The diameter and the length of the needle thermocouple were 0.3 and 15 mm, respectively. The thermocouple was connected to a temperature reader (NI USB-TC01; National Instruments Corporation, Austin, TX, USA), which was connected to a computer to record temperature every 1 s. The degassed water bath was maintained at 37°C using an automatic temperature controller throughout the ultrasonic experiment. In these experiments, the sample was moved using a computer-controlled micro-positioning system (Daedal, Inc., Harrisburg, PA, USA).
Figure 1.
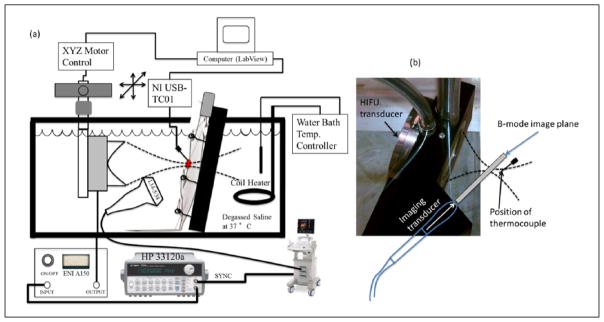
(a) Experimental setup and (b) HIFU and imaging probe holder. HIFU = high-intensity focused ultrasound.
The HIFU experiment was conducted soon (15 min) after euthanizing the animal. The tumors were exposed to spatial peak temporal average intensities (ISPTA) of either 270 W/cm2 or 335 W/ cm2 with a 50% duty cycle, as estimated in degassed water using a needle hydrophone (Precision Acoustics). Data were collected using the clinical system during the exposure by synchronizing the capture of the RF data with periods between HIFU exposure tone-bursts. The synchronization of the imaging trigger and the HIFU pulsing is shown in Figure 2. The HIFU pulse consisted of 16,000 cycles at 1 MHz with a total pulse duration of 0.016 s at a 50% duty cycle. At the end of each HIFU pulse, the imaging system was triggered to record one frame of RF signals as shown in Figure 2. Two different exposure durations of 60 and 120 s were used in the experiments.
Figure 2.

Synchronization of imaging and HIFU triggering pulses. HIFU = high-intensity focused ultrasound.
B-mode images of the scanned areas were constructed using the SonixRP system. Regions of interest (ROIs) in the B-mode images corresponding to the tumor area were examined for the spectral content of the backscattered RF echoes. Square-shaped data blocks of size 10λ by 10λ (λ is the wavelength associated with the center frequency of the imaging probe, that is, 6 MHz) were constructed with an 80% overlap between adjacent data blocks both in the vertical and horizontal directions within larger ROIs. Figure 3 shows an image depicting the construction of QUS image maps and the selection of data blocks. First, the tumor boundary was outlined as shown by the red line in Figure 3. Next, data blocks of the designated size were created inside the boundary outlined using an automated data block selection code. The BSC was estimated for each data block from the backscattered RF signals using the reference phantom technique.36,37 The reference scan was obtained from a well-characterized reference phantom. The insertion loss method was used to estimate attenuation from untreated excised tumors (n = 4).38 The average attenuation slopes were used to compensate for attenuation effects in the power spectra from in situ tumors using the method developed by Yao et al.36 The tumor was excised and cleared of skin and any surrounding tissue prior to scanning for the insertion loss measurement. The attenuation slope estimated from the excised tumor was used for all time points of the HIFU exposure for all the experiments. The BSC estimate did not account for changes in attenuation due to temperature elevation or from irreversible changes to the tissues. Therefore, at each time point, an apparent BSC was calculated.
Figure 3.
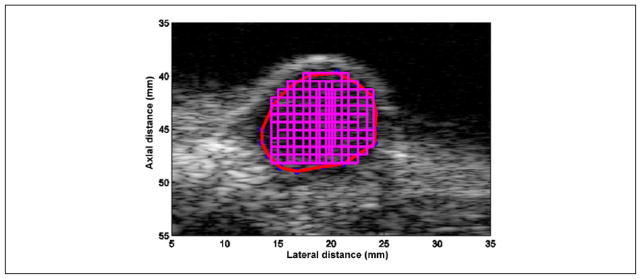
Selection of tumor boundary (denoted by a red line) and data block (size 10λ axially by 10λ laterally) positions with an 80% overlap.
Estimates of the effective scatterer diameter (ESD) and effective acoustic concentration (EAC) were obtained from the apparent BSC estimate using a spherical Gaussian scattering model.22,37 The percentage change in ESD and EAC for each data block was estimated with respect to its initial value before the HIFU exposure. For example, the percentage change in EAC after 10 s is given by
| (1) |
where EAC(0s) where EAC(0s) and EAC(10s) refer to EAC at the beginning of the exposure just before HIFU exposure and 10 s after the start of the HIFU exposure, respectively. Similarly, the ΔESD for each data block was estimated using the same method.
The apparent BSCs were estimated for each data block at different time points during the exposure. A constant attenuation coefficient was used to compensate power spectra at different time points. It is expected that the attenuation coefficient will change with application of HIFU. However, the depth of percutaneous tumors was less than 1 cm; therefore, it is expected that the changes in attenuation will not result in large errors in QUS estimates at the frequency ranges used. For example, the error propagation in ESD estimates due to a change in attenuation (Δα) using a spherical Gaussian scattering model is given by37,39
| (2) |
where N is the total number of frequency points and 2Δaeff is the change in ESD. Similarly, the error in EAC will be proportional to the sixth power of the error in ESD estimates. Overall four in situ tumors were used for the experiments to observe the changes in various QUS parameters (scatterer size and concentration) during HIFU exposure. The exposure settings used for each experiment are shown in Table 1.
Table 1.
Exposure Settings Used for Each Experiment.
| Rat No. | Exposure Time (s) | ISPTA (W/cm2) |
|---|---|---|
| R1 | 120 | 335 |
| R2 | 60 | 335 |
| R3 | 60 | 270 |
| R4 | 60 | 270 |
ISPTA = spatial peak temporal average intensity.
The significance of changes in ESD and EAC was assessed through a Kruskal–Wallis one-way analysis of variance by ranks by comparing the estimates at three different time points. Case I corresponded to a time point just before exposure, Case II corresponded to a time point just before the last HIFU pulse was delivered to the tissue (i.e., peak temperature), and Case III corresponded to a time point after the tissue was cooled to 37°C post exposure, that is, typically 5 to 10 min after the HIFU was turned off based on thermocouple readings in treated tumors. Statistically significant differences were confirmed by the p-values (<0.05). The Kruskal–Wallis test was conducted because it is a non-parametric method and suitable for the current study having low sample numbers. In addition, linear curve fitting was performed between the ΔEAC and temperature recorded by the thermocouple to characterize their relationship. Specifically, the relationship between the ΔEAC parameter and temperature during the exposure was investigated (i.e., during HIFU on only).
B-mode brightening for the ROI at time p was also quantified by estimating the normalized intensity using
| (3) |
where and refer to the amplitude of the ith pixel before HIFU exposure and at time p, respectively for a chosen ROI.
Results
B-mode images of an in situ tumor at different time points of HIFU exposure are shown in Figure 4(a), (d), and (g), and the corresponding parametric images enhanced by ΔEAC are shown in Figure 4(b), (e), and (h) for one rat (R3). The temperature profiles recorded by the thermocouple are shown as the blue curves in Figure 4(c), (f), and (i). The red circles indicate the time points corresponding to the displayed B-mode and parametric images. The three rows in the figure represent the results at three different time points of 23, 79, and 116 s, respectively, during the exposure, whereas the HIFU was turned on at 25 s after the thermocouple was inserted into the tumor. The in situ tumor was exposed for 60 s at ISPTA of 270 W/cm2. The percentage changes in mean ΔEAC are shown as lines in Figure 4(c), (f), and (i) denoted in green color. An attenuation correction of 0.7 dB/cm/MHz, as estimated from insertion loss measurements of untreated excised tumors, was used to obtain the BSCs at different time points of HIFU exposure.
Figure 4.

Parametric images at different times during the HIFU treatment of R3. The first, second, and third columns of the sub-figures represent B-mode images, parametric B-mode images enhanced by ΔEAC, and curves of the temperature and average ΔEAC versus time of exposure, respectively. The red circles indicate the time points corresponding to the displayed B-mode and parametric images. The three rows in the figure represent the results at three different time points of 23, 79, and 116 s, respectively, during the exposure. HIFU = high-intensity focused ultrasound; EAC = effective acoustic concentration.
B-mode brightening was observed during the exposure as indicated in the Figure 4(d) and (g). The B-mode brightening was quantified for the same ROI which was used for QUS analysis (see Figure 4) is shown in Figure 5. The magnified view of the ROI clearly shows an increase in B-mode image intensity during the HIFU exposure. The normalized intensities for ROIs in Figure 5(a), (c), and (e) were 1.0, 2.1, and 1.2, respectively. Therefore, an increase in the normalized intensity level in the B-mode images was observed during HIFU exposure in R3 of about 3 dB. However, most of this brightening was confined to the bottom of the tumor near the interface of the tumor and surrounding tissues.
Figure 5.

B-mode images at different times (corresponds to three different time points shown in Figure 4) during the HIFU treatment of R3. The red square in (a), (b), and (c) denotes the location of the ROI, and in (b), (d), and (f) refers to the magnified view of the corresponding ROI. HIFU = high-intensity focused ultrasound; ROI = region of interest.
Whereas the B-mode image brightening was confined to the bottom of the tumor, the EAC parameter was observed to increase throughout the tumor. The maximum ΔEAC (%) was approximately 18% in Figure 4(f), with a mean increase of 19 dB between the onset of HIFU exposure and the peak temperature. The red region in the QUS image in Figure 4(e), which corresponds to a large EAC increase, had a maximum of 25% to 28% increase. The discrepancy exists because the curve from Figure 4(f) averages EAC values throughout the whole tumor, which results in ΔEAC values both higher and lower than 18%. Therefore, the ΔEAC may result in higher changes if the analysis region is further localized to be closer to the HIFU focus. The ROIs used to estimate QUS parameters and normalized intensity were exactly the same. Furthermore, the region of maximum ΔEAC did not correspond to the region of B-mode brightening.
Examples of the changes observed in ESD and EAC during HIFU exposure for the other rats are shown in Figure 6(a) to (h). The results shown in Figure 6(a)–(b), (c)–(d), (e)–(f), and (g)–(h) were obtained from scans of animals R1, R2, R3, and R4, respectively. Exposure conditions are listed in Table 1. For all animals, the EAC parameter was consistently correlated to temperature. A linear fit between the ΔEAC and temperature recorded by the thermocouple for the heating period (HIFU on) for each experiment was performed. The comparison between the linear fit and the experimental data is shown in Figure 7(a) to (d) during the HIFU exposure. Similar comparison during post-HIFU exposure cooling period is shown in Figure 8(a) to (d). The slope, intercept, and the root mean square error (RMSE) of the fit during HIFU exposure and post-HIFU cooling period are tabulated in Table 2. Low RMSE values for all the experiments indicate a linear dependence between the ΔEAC and the temperature recorded by the thermocouples. Similar slopes were observed both during the HIFU exposure and post-HIFU exposure cooling period except for R2. Low slope of 0.13 was observed during the post-exposure cooling period of R2 compared with 1.30 during the HIFU exposure for R2. Similar slopes during the heating and cooling periods show that QUS can be used for monitoring both the treatment cycles.
Figure 6.

Tumor (a) ΔESD for R1, (b) ΔEAC for R1, (c) ΔESD for R2, (d) ΔEAC for R2, (e) ΔESD for R3, (f) ΔEAC for R3, (g) ΔESD for R4, and (h) ΔEAC for R4. ESD = effective scatterer diameter; ΔEAC = effective acoustic concentration.
Figure 7.
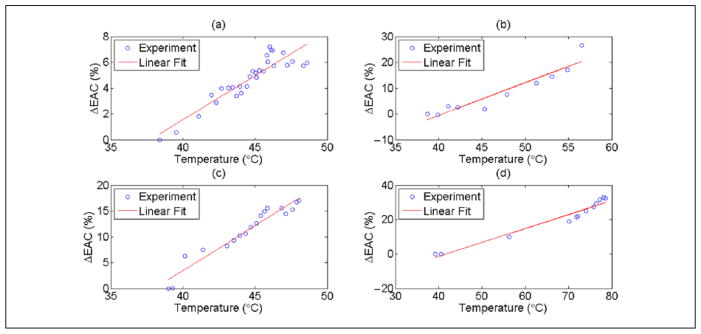
Linear curve fitting between ΔEAC and temperature recorded by the thermocouple for (a) R1 (b) R2, (c) R3, and (d) R4 during the heating period. EAC = effective acoustic concentration.
Figure 8.
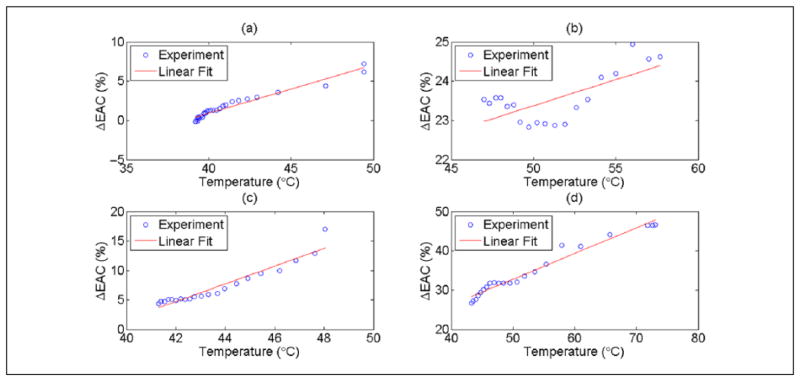
Linear curve fitting between mean ΔEAC and temperature recorded by the thermocouple for (a) R1 (b) R2, (c) R3, and (d) R4 during the cooling period post-HIFU exposure. EAC = effective acoustic concentration.
Table 2.
Linear Fit between ΔEAC (%) and Temperature Recorded by the Thermocouple.
| Rat No. | HIFU On
|
HIFU Off (Cooling)
|
||||
|---|---|---|---|---|---|---|
| Slope | Intercept | RMSE | Slope | Intercept | RMSE | |
| R1 | 0.73 | −25.69 | 0.75 | 0.61 | −23.64 | 0.39 |
| R2 | 1.30 | −52.62 | 3.56 | 0.13 | 16.74 | 0.48 |
| R3 | 1.75 | −66.34 | 1.36 | 1.50 | −58.44 | 0.99 |
| R4 | 0.82 | −33.28 | 2.86 | 0.66 | −0.06 | 1.23 |
EAC = effective acoustic concentration; HIFU = high-intensity focused ultrasound; RMSE = root mean square error.
Unlike the change in ΔEAC, the ΔESD parameter showed no consistent trend from one animal to the next. For example, in the cases of R1 and R4, the ESD changed by less than 5% throughout the exposures. For the case of R2, the ESD increased versus increasing temperature, and for the case of R3, the ESD decreased for increasing temperature.
To evaluate difference in the QUS parameters statistically, the mean and standard deviation of the QUS parameters at three different time points during the HIFU exposure experiment were estimated. ESD and EAC at the end of treatment while the temperature remained elevated were each compared with estimates at the baseline temperature, both before and after treatment. The mean ESD and EAC before exposure (Case I) were 120 ±16μm and 32 ±3dB / cm3, respectively, and changed to 144 ±9μm and 51±7dB / cm3, respectively, just before the last HIFU pulse was delivered to the tissue (Case II). At 5 to 10 min after exposure, the thermocouple recorded a temperature of 37°C and the mean effective scatterer diameter and effective acoustic concentration were 126 ±8μm and 35 ±4dB / cm3, respectively (Case III). The changes in ESD (p-value = 0.0433) and EAC (p-value = 0.0209) had statistically significant differences between Cases I and II as the tissue temperature increased with application of HIFU. No statistically significance differences were observed between Cases I and III (p-values = 0.3865 and 0.1489, for ESD and EAC, respectively). However, if sample R1 was omitted from the statistical test, statistical significance was observed. Statistically significant differences in ESD (p-value = 0.0209) and EAC (p-value = 0.0433) for Cases II and III were observed. Different temperature values between the time point just before the HIFU was turned off and after the tissue temperature returned to 37°C post exposure were also observed.
Representative histologic slides of the non-treated and treated tumors are shown in Figure 9. However, no changes in the shape and sizes of the cells were observed. The apparent absence of dramatic morphological changes, that is, “histological fixing,” immediately after HIFU treatment has also been observed by others.40
Figure 9.
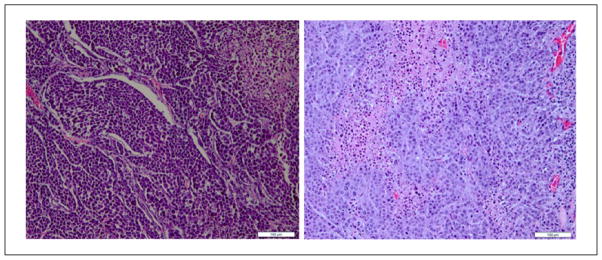
Histology images of tumors from rats (a) untreated and (b) treated (scale bar = 100 μm).
Discussion
In situ rat tumors were exposed to HIFU, and QUS imaging was used to monitor changes in signal properties due to HIFU exposure. A thermocouple was placed away from the focal region manually to measure temperature rise in the tumor. Typically the thermocouple was placed approximately a few millimeters from the focal zone that was also verified from the B-mode images acquired by a SonixRP.
From the results, it was observed that the EAC parameter provided consistent correlation to temperature elevations caused by HIFU exposure, that is, EAC increased when temperature increased in all cases and EAC decreased when temperature decreased except for one case (see Figure 6(d)) where the EAC decreased only slightly after the HIFU was turned off. However, the changes in the ESD were inconsistent from one animal exposure to the next. The QUS images overlaid on conventional B-mode images clearly showed changes in the EAC of the tissue due to the exposure. The results suggest that EAC may be a good candidate to monitor temperature changes in the tissue because the ΔEAC curves followed the same characteristics of the temperature profile measured by the thermocouple.
Changes in QUS parameters were also observed between the pre-treated and post-treated tumor after it reached an equilibrium temperature of 37°C. For R2, the EAC was observed to increase with the increasing temperature but did not return to its pre-exposure levels during cooling out to 120 s post exposure. Thus, it remains unclear whether the EAC is sensitive to temperature, to permanent changes as a result of thermal insult, or to both. In addition, mechanical effects such as boiling or cavitation could not be excluded as contributing to the increase in EAC observed.
In the ex vivo tumors, the EAC changed on average by 3 dB between the pre- and post-exposure time points at 37°C. However, the EAC increased by 19 and 16 dB at the peak temperature when compared with the pre- and post-exposure time points, respectively. Therefore, unlike attenuation that changes both due to temperature elevation and irreversible tissue changes, we hypothesize based on these preliminary results that the EAC is sensitive to temperature but less sensitive to irreversible thermal damage. If this is indeed the case, it would be consistent with the observed sensitivity of changes in BSC to temperature in liver27 and the apparent insensitivity of the BSC to irreversible damage in liver.33 However, unlike the case of the tumors examined in the current study, the EAC decreased with increasing temperature in the liver. Therefore, the sensitivity of EAC to temperature and to irreversible changes in tissue appears to be tissue dependent. Sensitivity to temperature but not to irreversible effects would simplify the monitoring problem and avoid introducing temperature path dependency.
While changes in temperature correlated to changes in EAC, predicting actual temperature elevations from changes in EAC in tumors requires further study. The difference in regression coefficients for each tumor may be due to different orientations of the thermocouple with respect to the region of HIFU therapy.
Furthermore, temperature trends indicated sudden changes in properties of the exposed tissue. For example, the sudden change in slope of the temperature profile in Figure 6(a) and (b) suggests changes in tissue properties as the tissue was being heated. These changes may be due to coagulation resulting in increased bulk absorption, as well as absorption and re-radiation of acoustic energy by bubbles. The lack of tissue perfusion and B-mode brightening observed (see Figure 4(d) and (g)) supports the latter case, though it was not observed throughout the entire tumor, but seemed to be confined to the bottom of the tumor with respect to the B-mode image. Thus, the question of the source of contrast in the tissue responsible for EAC increases remains. Future work will aim to evaluate the degree to which QUS changes are due to these effects, although in vivo studies will be pursued first as these mechanical effects may be mitigated by perfusion in live tissues. EAC increases would be expected in the presence of cavitation and boiling.
Another potential source of error that must be considered is the change in sound speed that occurs when the tissue is heated during HIFU exposure. A 1% change in sound speed will not produce significant errors in QUS estimates because the QUS parameters are based on the BSC which is not a phase-sensitive estimate, that is, the BSC is calculated from the magnitude squared of the Fourier transform of the RF data. Changes could occur in the spectral normalization procedure using the reference phantom if the focus location was shifted by a large amount with heating. However, with a maximum 1% change in sound speed during the HIFU exposure and most of that confined to the focal location, the focal distance is not going to change to produce significantly observable effects. Hence, sound speed changes were considered negligible in the estimation process.
It is expected that any lesion created by the HIFU exposure will have spatially varying attenuation and also that the attenuation will change with application of heat (i.e., temporal change in attenuation due only to temperature) and with reversible change of tissues due to thermal insult. However, the current results do not account for attenuation changes in the exposed area. This can result in increased bias in the estimate of ESD and EAC because the change in attenuation during monitoring is not compensated. However, this work seeks to apply QUS techniques to monitor temperature, and not to estimate tissue properties per say. To examine the potential error associated with not accounting for the attenuation, using Equation (3), an increase of 0.1 dB/cm/MHz (~15% increase) and 0.35 dB/cm/MHz (50% increase) in attenuation will result in a maximum of 3% and 10% change in ESD, respectively, considering a frequency band of 3 to 8.6 MHz and initial ESD of 130 μm at a depth of 7 mm. Because all the tumors were less than 7 mm thick, the maximum difference in ESD estimates due to incorrectly accounting for the attenuation was anticipated to be less than 10%. For a 50% increase in attenuation (0.35 dB/cm/MHz), the change in EAC is predicted to be less than 3 dB. With the change in EAC from pre-treatment to the peak temperature being on average 19 dB, the error from not accounting for attenuation is much smaller than the change in EAC attributed to temperature change.
An affordable non-invasive imaging system is necessary to monitor thermal therapies. The results of this study suggest that QUS has the potential to be used for non-invasive monitoring of temperature elevations due to HIFU exposure. The fact that different exposure conditions resulted in different behaviors of the ESD parameter versus temperature might be indicative that ESD is sensitive to different kinds of effects, both mechanical (cavitation or boiling) and/or temperature effects. The hypothesis that certain QUS parameters may be sensitive to mechanical effects produced during HIFU while other parameters may be more sensitive to temperature elevations will be the subject of additional studies in the future.
In future, we plan to conduct in vivo studies to monitor HIFU treatment using QUS imaging. The potential exists for blood flow to affect QUS estimates, especially at higher ultrasonic frequencies (>20 MHz) where blood scattering is not negligible. It is hypothesized that QUS techniques could be still very effective in monitoring HIFU treatment for in vivo tissue ablation or hyperthermia.
The study presents the current state of the art in QUS for therapy monitoring and assessment applied to a rodent tumor model. While the source of contrast during HIFU application remains unclear, the correlation between EAC and temperature suggests that QUS techniques have the potential to monitor HIFU therapy for targeted hyperthermia and potentially ablation. Understanding the source of contrast will be necessary to determine the types of exposure for which QUS monitoring is appropriate. If these techniques could be further developed and optimized, the major clinical significance would be an addition of a real-time, non-ionizing, and cost-effective non-invasive imaging system to monitor thermal therapy.
Acknowledgments
Funding
The author(s) disclosed receipt of the following financial support for the research, authorship, and/or publication of this article: The work was supported by an NIH Grant R01EB008992.
Footnotes
Declaration of Conflicting Interests
The author(s) declared no potential conflicts of interest with respect to the research, authorship, and/or publication of this article.
References
- 1.Kennedy JE. High-intensity focused ultrasound in the treatment of solid tumours. Nat Rev Cancer. 2005;5:321–7. doi: 10.1038/nrc1591. [DOI] [PubMed] [Google Scholar]
- 2.Stewart EA, Gedroyc WM, Tempany CM, Quade BJ, Inbar Y, Ehrenstein T, et al. Focused ultrasound treatment of uterine fibroid tumors: safety and feasibility of a noninvasive thermoablative technique. Am J Obstet Gynecol. 2003;189:48–54. doi: 10.1067/mob.2003.345. [DOI] [PubMed] [Google Scholar]
- 3.Tempany CM, Stewart EA, McDannold N, Quade BJ, Jolesz FA, Hynynen K. MR imaging-guided focused ultrasound surgery of uterine leiomyomas: a feasibility study. Radiology. 2003;226:897–905. doi: 10.1148/radiol.2271020395. [DOI] [PubMed] [Google Scholar]
- 4.Clement GT. Perspectives in clinical uses of high-frequency focused ultrasound. Ultrasonics. 2004;42:1087–93. doi: 10.1016/j.ultras.2004.04.003. [DOI] [PubMed] [Google Scholar]
- 5.Denis de Senneville B, Quesson B, Moonen CT. Magnetic resonance temperature imaging. Int J Hyperthermia. 2005;21:515–31. doi: 10.1080/02656730500133785. [DOI] [PubMed] [Google Scholar]
- 6.Ries M, De Senneville BD, Roujol S, Hey S, Maclair G, Kohler MO, et al. Three dimensional motion compensation for real-time MRI guided focused ultrasound treatment of abdominal organs. AIP Conference Proceedings. 2010;1215:239–42. [Google Scholar]
- 7.Quesson B, Laurent C, Maclair G, Denis de Senneville B, Mougenot C, Ries M, et al. Real-time volumetric MRI thermometry of focused ultrasound ablation in vivo: a feasibility study in pig liver and kidney. NMR Biomed. 2011;24:145–53. doi: 10.1002/nbm.1563. [DOI] [PubMed] [Google Scholar]
- 8.Ries M, de Senneville BD, Regard Y, Moonen C. Combined magnetic resonance imaging and ultrasound echography guidance for motion compensated HIFU interventions. AIP Conference Proceedings. 2012;1503:202–6. [Google Scholar]
- 9.Anand A, Savery D, Hall C. Three-dimensional spatial and temporal temperature imaging in gel phantom using backscattered ultrasound. IEEE Trans Ultrason Ferroelectr Freq Control. 2007;54:23–31. doi: 10.1109/tuffc.2007.208. [DOI] [PubMed] [Google Scholar]
- 10.Abolhassani MD, Norouzy A, Takavar A, Ghanaati H. Noninvasive temperature estimation using sonographic digital images. J Ultrasound Med. 2007;26:215–22. doi: 10.7863/jum.2007.26.2.215. [DOI] [PubMed] [Google Scholar]
- 11.Daniels MJ, Varghese T, Madsen EL, Zagzebski JA. Non-invasive ultrasound-based temperature imaging for monitoring radiofrequency heating-phantom results. Phys Med Biol. 2007;52:4827–43. doi: 10.1088/0031-9155/52/16/008. [DOI] [PubMed] [Google Scholar]
- 12.Varghese T, Zagzebski JA, Chen Q, Techavipoo U, Frank G, Johnson C, et al. Ultrasound monitoring of temperature change during radiofrequency ablation: preliminary in-vivo results. Ultrasound Med Biol. 2002;28:321–9. doi: 10.1016/s0301-5629(01)00519-1. [DOI] [PubMed] [Google Scholar]
- 13.Simon C, Vanbaren P, Ebbini ES. Two-dimensional temperature estimation using diagnostic ultrasound. IEEE Trans Ultrason Ferroelectr Freq Control. 1998;45:1088–99. doi: 10.1109/58.710592. [DOI] [PubMed] [Google Scholar]
- 14.Pernot M, Tanter M, Bercoff J, Waters KR, Fink M. Temperature estimation using ultrasonic spatial compound imaging. IEEE Trans Ultrason Ferroelectr Freq Control. 2004;51:606–15. [PubMed] [Google Scholar]
- 15.Maass-Moreno R, Damianou CA. Noninvasive temperature estimation in tissue via ultrasound echo-shifts: Part I. Analytical model. J Acoust Soc Am. 1996;100:2514–21. doi: 10.1121/1.417359. [DOI] [PubMed] [Google Scholar]
- 16.Bamber JC, Hill CR. Ultrasonic attenuation and propagation speed in mammalian tissues as a function of temperature. Ultrasound Med Biol. 1979;5:149–57. doi: 10.1016/0301-5629(79)90083-8. [DOI] [PubMed] [Google Scholar]
- 17.Techavipoo U, Varghese T, Chen Q, Stiles TA, Zagzebski JA, Frank GR. Temperature dependence of ultrasonic propagation speed and attenuation in excised canine liver tissue measured using transmitted and reflected pulses. J Acoust Soc Am. 2004;115:2859–65. doi: 10.1121/1.1738453. [DOI] [PubMed] [Google Scholar]
- 18.Miller NR, Bamber JC, Meaney PM. Fundamental limitations of noninvasive temperature imaging by means of ultrasound echo strain estimation. Ultrasound Med Biol. 2002;28:1319–33. doi: 10.1016/s0301-5629(02)00608-7. [DOI] [PubMed] [Google Scholar]
- 19.Seip R, Ebbini ES. Noninvasive estimation of tissue temperature response to heating fields using diagnostic ultrasound. IEEE Trans Biomed Eng. 1995;42:828–39. doi: 10.1109/10.398644. [DOI] [PubMed] [Google Scholar]
- 20.Lai CY, Kruse DE, Caskey CF, Stephens DN, Sutcliffe PL, Ferrara KW. Noninvasive thermometry assisted by a dual-function ultrasound transducer for mild hyperthermia. IEEE Trans Ultrason Ferroelectr Freq Control. 2010;57:2671–84. doi: 10.1109/TUFFC.2010.1741. [DOI] [PMC free article] [PubMed] [Google Scholar]
- 21.Liu D, Ebbini ES. Real-time 2-D temperature imaging using ultrasound. IEEE Trans Biomed Eng. 2010;57:12–6. doi: 10.1109/TBME.2009.2035103. [DOI] [PMC free article] [PubMed] [Google Scholar]
- 22.Lizzi FL, Astor M, Liu T, Deng C, Coleman DJ, Silverman RH. Ultrasonic spectrum analysis for tissue assays and therapy evaluation. Int J Imaging Syst Technol. 1997;8:3–10. [Google Scholar]
- 23.Daniels MJ, Varghese T. Dynamic frame selection for in vivo ultrasound temperature estimation during radiofrequency ablation. Phys Med Biol. 2010;55:4735–53. doi: 10.1088/0031-9155/55/16/008. [DOI] [PMC free article] [PubMed] [Google Scholar]
- 24.Techavipoo U, Varghese T, Zagzebski JA, Stiles T, Frank G. Temperature dependence of ultrasonic propagation speed and attenuation in canine tissue. Ultrasonic Imaging. 2002;24:246–60. doi: 10.1177/016173460202400404. [DOI] [PubMed] [Google Scholar]
- 25.Seo CH, Stephens D, Cannata J, Dentinger A, Feng L, Suhyun P, et al. Monitoring radiofrequency catheter ablation using thermal strain imaging. IEEE Ultrasonics Symposium; San Diego. 11–14 October 2010; pp. 1364–7. [Google Scholar]
- 26.Seo CH, Stephens DN, Cannata J, Dentinger A, Lin F, Park S, et al. The feasibility of using thermal strain imaging to regulate energy delivery during intracardiac radio-frequency ablation. IEEE Trans Ultrason Ferroelectr Freq Control. 2011;58:1406–17. doi: 10.1109/TUFFC.2011.1960. [DOI] [PMC free article] [PubMed] [Google Scholar]
- 27.Varghese T, Daniels MJ. Real-time calibration of temperature estimates during radiofrequency ablation. Ultrasonic Imaging. 2004;26:185–200. doi: 10.1177/016173460402600305. [DOI] [PubMed] [Google Scholar]
- 28.Amini AN, Ebbini ES, Georgiou TT. Noninvasive estimation of tissue temperature via high-resolution spectral analysis techniques. IEEE Trans Biomed Eng. 2005;52:221–8. doi: 10.1109/TBME.2004.840189. [DOI] [PubMed] [Google Scholar]
- 29.Arthur RM, Trobaugh JW, Straube WL, Moros EG. Temperature dependence of ultrasonic backscattered energy in motion-compensated images. IEEE Trans Ultrason Ferroelectr Freq Control. 2005;52:1644–52. doi: 10.1109/tuffc.2005.1561620. [DOI] [PubMed] [Google Scholar]
- 30.Chen WH, Sanghvi NT, Carlson R, Uchida T. Real-time tissue change monitoring on the Sonablate® 500 during high intensity focused ultrasound (HIFU) treatment of prostate cancer. AIP Conference Proceedings. 2011;1359:391–6. [Google Scholar]
- 31.Chen WH, Sanghvi NT, Carlson R, Schatzl G, Marberger M. Validation of tissue change monitoring (TCM) on the Sonablate 500 during high intensity focused ultrasound (HIFU) treatment of prostate cancer with real-time thermometry. 11th International Symposium on Therapeutic Ultrasound; New York. 11–13 April 2011; pp. 53–8. [Google Scholar]
- 32.Ghoshal G, Luchies AC, Blue JP, Oelze ML. Temperature dependent ultrasonic characterization of biological media. J Acoust Soc Am. 2011;130:2203–11. doi: 10.1121/1.3626162. [DOI] [PMC free article] [PubMed] [Google Scholar]
- 33.Kemmerer JP, Oelze ML. Ultrasonic assessment of thermal therapy in rat liver. Ultrasound Med Biol. 2012;38:2130–7. doi: 10.1016/j.ultrasmedbio.2012.07.024. [DOI] [PMC free article] [PubMed] [Google Scholar]
- 34.Oelze ML, Zachary JF, O’Brien WD., Jr Parametric imaging of rat mammary tumors in vivo for the purposes of tissue characterization. J Ultrasound Med. 2002;21:1201–10. doi: 10.7863/jum.2002.21.11.1201. [DOI] [PubMed] [Google Scholar]
- 35.Ghoshal G, Oelze ML. Use of quantitative ultrasound to detect temperature variations in biological phantoms due to heating. IEEE Ultrasonics Symposium; Rome, Italy. 20–23 September 2009; pp. 1780–3. [Google Scholar]
- 36.Yao LX, Zagzebski JA, Madsen EL. Backscatter coefficient measurements using a reference phantom to extract depth-dependent instrumentation factors. Ultrasonic Imaging. 1990;12:58–70. doi: 10.1177/016173469001200105. [DOI] [PubMed] [Google Scholar]
- 37.Oelze ML, Zachary JF, O’Brien WD., Jr Characterization of tissue microstructure using ultrasonic backscatter: theory and technique for optimization using a Gaussian form factor. J Acoust Soc Am. 2002;112:1202–11. doi: 10.1121/1.1501278. [DOI] [PubMed] [Google Scholar]
- 38.Madsen EL, Dong F, Frank GR, Garra BS, Wear KA, Wilson T, et al. Interlaboratory comparison of ultrasonic backscatter, attenuation, and speed measurements. J Ultrasound Med. 1999;18:615–31. doi: 10.7863/jum.1999.18.9.615. [DOI] [PubMed] [Google Scholar]
- 39.Ghoshal G, Lavarello RJ, Kemmerer JP, Miller RJ, Oelze ML. Ex vivo study of quantitative ultrasound parameters in fatty rabbit livers. Ultrasound Med Biol. 2012;38:2238–48. doi: 10.1016/j.ultrasmedbio.2012.08.010. [DOI] [PMC free article] [PubMed] [Google Scholar]
- 40.Kennedy JE, ter Haar GR, Wu F, Gleeson FV, Roberts ISD, Middleton MR, Cranston D. Contrast-enhanced ultrasound assessment of tissue response to high-intensity focused ultrasound. Ultrasound Med Biol. 2004;30:851–854. doi: 10.1016/j.ultrasmedbio.2004.03.011. [DOI] [PubMed] [Google Scholar]