

Background: Renal nitric oxide (NO) production is important for long-term blood pressure regulation.
Results: Insulin stimulates NO production via the insulin receptor (IR)/PI3K/endothelial NO synthase-dependent pathway in inner medullary collecting duct (IMCD) cells, the largest source of NO in the kidney.
Conclusion: IR is crucial for insulin-induced NO generation in IMCD.
Significance: This study clarifies the implication of reduced IR in insulin-resistance associated hypertension.
Keywords: Epithelial Cell, Gene Silencing, Insulin Receptor, Insulin Resistance, Kidney, Nitric Oxide Synthase, Phosphatidylinositide 3-Kinase, Hypertension, Kidney Tubule Cells
Abstract
The kidney is an important organ for arterial blood pressure (BP) maintenance. Reduced NO generation in the kidney is associated with hypertension in insulin resistance. NO is a critical regulator of vascular tone; however, whether insulin regulates NO production in the renal inner medullary collecting duct (IMCD), the segment with the greatest enzymatic activity for NO production in kidney, is not clear. Using an NO-sensitive 4-amino-5-methylamino-2′,7′-difluorofluorescein (DAF-FM) fluorescent dye, we found that insulin increased NO production in mouse IMCD cells (mIMCD) in a time- and dose-dependent manner. A concomitant dose-dependent increase in the NO metabolite (NOx) was also observed in the medium from insulin-stimulated cells. NO production peaked in mIMCD cells at a dose of 100 nm insulin with simultaneously increased NOx levels in the medium. At this dose, insulin significantly increased p-eNOSSer1177 levels in mIMCD cells. Pretreatment of cells with a PI 3-kinase inhibitor or insulin receptor silencing with RNA interference abolished these effects of insulin, whereas insulin-like growth factor-1 receptor (IGF-1R) silencing had no effect. We also showed that chronic insulin infusion to normal C57BL/6J mice resulted in increased endothelial NOS (eNOS) protein levels and NO production in the inner medulla. However, insulin-infused IRKO mice, with targeted deletion of insulin receptor from tubule epithelial cells of the kidney, had ∼50% reduced eNOS protein levels in their inner medulla along with a significant rise in BP relative to WT littermates. We have previously reported increased baseline BP and reduced urine NOx in IRKO mice. Thus, reduced insulin receptor signaling in IMCD could contribute to hypertension in the insulin-resistant state.
Introduction
Insulin resistance is defined as inefficient sensitivity of major metabolic tissues, including liver, muscle, and adipose tissue, toward insulin (1–5). Insulin receptor modulation could be an important mechanism that may directly affect target cell sensitivity to insulin (2, 6, 7).
In kidney, the insulin receptor (IR)5 is expressed in nearly all absorptive epithelial cells along the renal tubule. Using mice with targeted deletion of IR gene from different segments of the kidney tubule, we have demonstrated a physiologic role for renal IR in proximal and distal tubules (8, 9). In addition, we have demonstrated reduced IR protein levels in renal epithelial cells in rat models of insulin resistance (10). Moreover, the observations that IRS-1 knock-out mice are hypertensive suggest that insulin signaling contributes importantly to regulation of cardiovascular physiology (31). Our equivalent observation of hypertension along with reduced urinary NOx levels, a measure of renal NO production, in mice with targeted deletion of IR from distal tubule cells of the kidney (IRKO) not only supports the existing idea of IR signaling as a regulator of cardiovascular physiology, but also adds a novel function for the IR in kidney in blood pressure (BP) and NO regulation (8, 11).
NO has been suggested to play an important role in long-term BP regulation by its autocrine and paracrine actions (12). Moreover, a role of local NO production in the kidney has been implicated in impaired renal blood flow found in patients with chronic congestive heart failure (13). Such a paracrine NO system has been postulated to reside within the renal medulla (14). In addition, the inner medullary collecting duct (IMCD) has been shown to exhibit the greatest enzymatic activity for NO production, about 3–6-fold higher than other segments (15). NO has also been suggested to modulate sodium transport (12, 16) and attenuate superoxide-stimulated urea permeability in this segment of the kidney (17).
Insulin is a known regulator of NO production in vasculature (18). In kidney, hyperinsulinemia has been shown to induce NO-dependent vasodilation and affect renal blood flow (19). This effect was found to be impaired in the insulin-resistant state (20–22). Thus, hemodynamic effects of insulin in the kidney are at least partially dependent on local NO synthesis (19). Moreover, reduced renal NO production has also been reported in rat models of diabetes (23–25) and in patients with chronic kidney disease and end-stage renal disease (26, 27). It is important to note that insulin resistance is a common finding in the above models/populations.
Overall, it appears that reduced insulin signaling impairs NO generation in kidney. Furthermore, as the IMCD is the largest source of NO generation in the kidney, it is of vital importance to determine whether insulin induces NO generation in these cells, and if so, then how reduced insulin action impairs NO production. This may improve our understanding of the pathophysiological association between insulin resistance and hypertension by clarifying the implication of reduced IR expression in renal epithelial cells reported in the insulin-resistant state (10).
EXPERIMENTAL PROCEDURES
Cells and Culture Conditions
The mouse inner medullary collecting duct cell line (mIMCD-3 cells) was received as a gift from Dr. Peter Igarashi (UT Southwestern Medical Center). Cells were maintained in DMEM/F12 supplemented with 10% FBS (Invitrogen) as described (28, 29). Cells were grown at 37 °C in 5% CO2. For experiments, cell cultures were switched to serum-free medium for 6 h and then stimulated with insulin or vehicle for 15–20 min. In some cases, cells were pretreated with 500 nm wortmannin (Tocris Biosciences) before stimulation. Unless otherwise mentioned, all the chemicals were from Sigma-Aldrich.
siRNA Transfection
Cells were transfected in 6-well plates at 50% confluence with 100 nm siRNA (Ambion) using Lipofectamine RNAiMAX (Invitrogen), according to the manufacturer's instructions with the following modification; full growth medium was removed and the transfection complexes were added directly onto the cells in serum-free medium for 4–6 h before the addition of complete growth medium for 48 h. Cells were harvested for further analysis. Dual knockdown of insulin-like growth factor-1 receptor (IGF-1R) and IR was achieved by sequential transfection of 100 nm IR siRNA followed by 100 nm IGF-1R siRNA (30) from Dharmacon. The following primers were used: IR siRNA, sense, 5′-CGGUUAAGACUGUCAAUGAtt-3′, and antisense, 5′-UCAUUGACAGUCUUAACCGca-3′; IGF-1R siRNA, sense, 5′-UACACGCGGUGAUGAUCUCAAAtt-3′, and antisense, 5′-UUUGAGAUCACCGCGUGUCat-3′; and non-targeted siRNA, sense, 5′-UGGUUUACAUGUCGACUAA-3′, and antisense, 5′-UGGUUUACAUGUUGUGUGA-3′.
Measurement of NO Production in Cultured Cells with DAF-FM Diacetate
Insulin-stimulated intracellular NO production was measured using NO-sensitive 4-amino-5-methylamino-2′,7′-difluorofluorescein (DAF-FM) fluorescent dye (31). Briefly, serum-starved cells were first loaded with 10 μm DAF-FM diacetate dye (Molecular probe) in 96-well black plates for 60 min at 37 °C. After 1 h, cells were rinsed and supplemented with 100 μm l-arginine. Baseline fluorescence (excitation 492 nm, emission 515 nm) was measured by a fluorimeter (Biotech Synergy) for 2 min followed by fluorescence recording for 20 min in response to insulin or vehicle stimulation.
Measurement of NO Metabolites
At the end of incubations, the culture supernatants were collected for nitrate/nitrite estimation by a modification of the Griess reaction (32) using nitrate/nitrite colorimetric assay kit (Cayman).
Nitric Oxide Production in Mouse Kidney
To determine the effect of insulin on NO production in inner medulla, direct NO production was measured in inner medullary cell suspension by the method established by Kojima et al. (33). Briefly, the inner medullary collecting duct suspension obtained from wild type mouse kidney was incubated with DAF-2DA (10 μmol/liter; Calbiochem-Novabiochem Co) for 1 h at room temperature, washed, and incubated for 30 min in the experimental buffer with either 1) insulin (10 nm) or 2) vehicle. The changes in DAF-2T fluorescence were recorded.
Immunocytochemistry
mIMCD-3 cells, grown in slide chambers, were treated with vehicle or 100 nm insulin for 15 min. Immunostaining was performed by a standard method using anti-peNOSSer1177 antibody raised in rabbit (Abcam) followed by anti-rabbit Alexa Fluor 488-conjugated secondary antibody (Invitrogen). Cells were viewed and photographed in six random fields using a UV fluorescence microscope (Nikon Eclipse 80i).
Immunohistochemical Examination of Kidney Tissues from Mice with Targeted Deletion of IR from Distal Renal Tubule (IRKO Mice)
Paraffin blocks of kidney tissues from untreated IRKO mice and their WT littermates (n = 3/genotype) were obtained. Male mice were given an intraperitoneal injection of insulin (0.5 units/kg of body weight) in 300 μl of saline plus 300 μl of 25% dextrose in saline after 4 h of fasting to amplify the difference between KO and WT mice. After 20 min, mice were anesthetized, and perfusion-fixed kidneys were removed for paraffin block preparation. IRKO mice were generated as described previously (8). Three-μm-thin sections of the blocks were used for immunohistochemical analysis for p-eNOSSer1177 using a standard method as described previously (10).
Chronic Insulin Infusion in Mice
C57BL/6J male mice at ∼5 months of age were anesthetized with isoflurane and subcutaneously implanted with osmotic minipumps (ALZET model 1007D; DURECT Corp.) preloaded with insulin (Humulin-R, Eli Lilly). Insulin was delivered at 50 units/kg of body weight per day for 28 days. A similar dose of insulin was used previously by us (34) Moreover, chronic doses of insulin between 1 and 50 units/kg of body weight per day have been reported by us and others (10, 35–37). Insulin-infused mice had ad libitum access to 20% glucose drinking water and 0.5% NaCl pelleted chow during the infusion. Control mice had free access to 0.5% NaCl chow and plain drinking water, but received no infusion. In a separate study, male IRKO mice and their wild type littermates (n = 7/genotype) were both chronically infused with insulin for 2 weeks as described above. At the end of 2 weeks, mice were placed in metabolic cages for a 24-h urine collection. All mice were maintained under protocols approved by the Institutional Animal Care and Use Committee (IACUC).
Electrolyte and Metabolite Measurements
Urinary sodium and potassium were determined by ion-selective electrodes (ELISE electrolyte system; Beckman Instruments).
Blood Pressure Measurement
Blood pressure measurement was done using radiotelemetry. Transmitters were implanted in mice and blood pressure measurement was done at Georgetown University using the protocol approved by the Georgetown University Animal Care and Use Committee (GUACUC). Mice were anesthetized with ketamine plus xylazine and equipped with radiotelemetry transmitters (Data Sciences Inc., St. Paul, MN) as described previously (8, 34, 38). After a 1-week recovery, BP was recorded first at the baseline and then during the course of insulin infusion.
Western Blot Analysis
Protein from cell lysate and mice inner medulla homogenates was measured, and immunoblotting was performed as described previously (8–10, 39). Before immunoblotting, Coomassie Blue-stained loading gels were prepared for all sample sets, and densitometry was scanned to assess the quality of the proteins by the sharpness of the bands. The gel was also used to confirm precision of protein concentration measurements, as described previously (9, 40–42). The following antibodies raised in rabbit were used: anti-phospho-AktThr308, anti-AKT, anti-phospho-eNOSSer1177, and anti-eNOS (Abcam); anti-IR-β and anti-IGF-1R (Santa Cruz Biotechnology); and anti-β-actin (Cell Signaling). Signals were detected using a chemiluminescence-based detection system (Amersham Biosciences).
Statistics
Results are expressed as mean ± S.E. for the number of experiments indicated in the figure legends. Comparisons within groups were made using paired Student's t tests, and comparisons between groups were made using unpaired Student's t tests as appropriate. p < 0.05 was considered statistically significant. The n values represent the number of independent experiments.
RESULTS
Infusion of Insulin Increased eNOS Protein Levels and NO Production in Inner Medulla
To determine the effect of insulin on renal NO metabolism and BP, WT mice were chronically infused with insulin for a period of 28 days. We found a substantial increase in eNOS protein levels in inner medullary homogenate, as compared with control mice (Fig. 1, A and B). BP was not significantly different between treatments (Fig. 1C). We also measured direct NO production in IMCD-enriched suspensions from mouse kidney in response to insulin (10 nm) or vehicle. The changes in DAF-2T fluorescence were significantly increased by insulin in the inner medulla collecting duct suspension (Fig. 1D). To determine the mechanism and how reduced insulin action impairs NO production, the next set of experiments was carried out in IMCD cells.
FIGURE 1.

Increased eNOS expression in inner medulla from mice infused with insulin or maintained in the control state. A, representative Western blot of eNOS (top) in control mice and mice infused with insulin for 28 days (50 units/kg of body weight). Below is the Coomassie Blue-stained loading gel. B, densitometry summary. * indicates a significant (p < 0.05) difference from control by unpaired t test (n = 6/group). C, mean arterial blood pressure of mice infused with vehicle or insulin for a period of 4 weeks (n = 5/group). D, insulin-induced nitric oxide production in the IMCD-enriched suspension from mouse kidney tissue (n = 4/group); *, p < 0.05 as compared with vehicle. Error bars in B–D indicate S.E.
NO Production by IMCD Cells in Response to Insulin
We examined the time course of NO production in IMCD cells stimulated with increasing doses of insulin. With 10–200 nm concentration of insulin, we observed an increase in DAF-2 fluorescence by 2 min, with a peak at ∼10 min followed by a rapid return to basal levels by 18 min (Fig. 2A). The -fold change was greater with 100 nm. The area under the curve of increase in fluorescence over the period of 18 min was significant in insulin-treated cells at doses 10, 100, and 200 nm relative to vehicle. There was no detectable production of NO in response to vehicle or 1 nm insulin.
FIGURE 2.
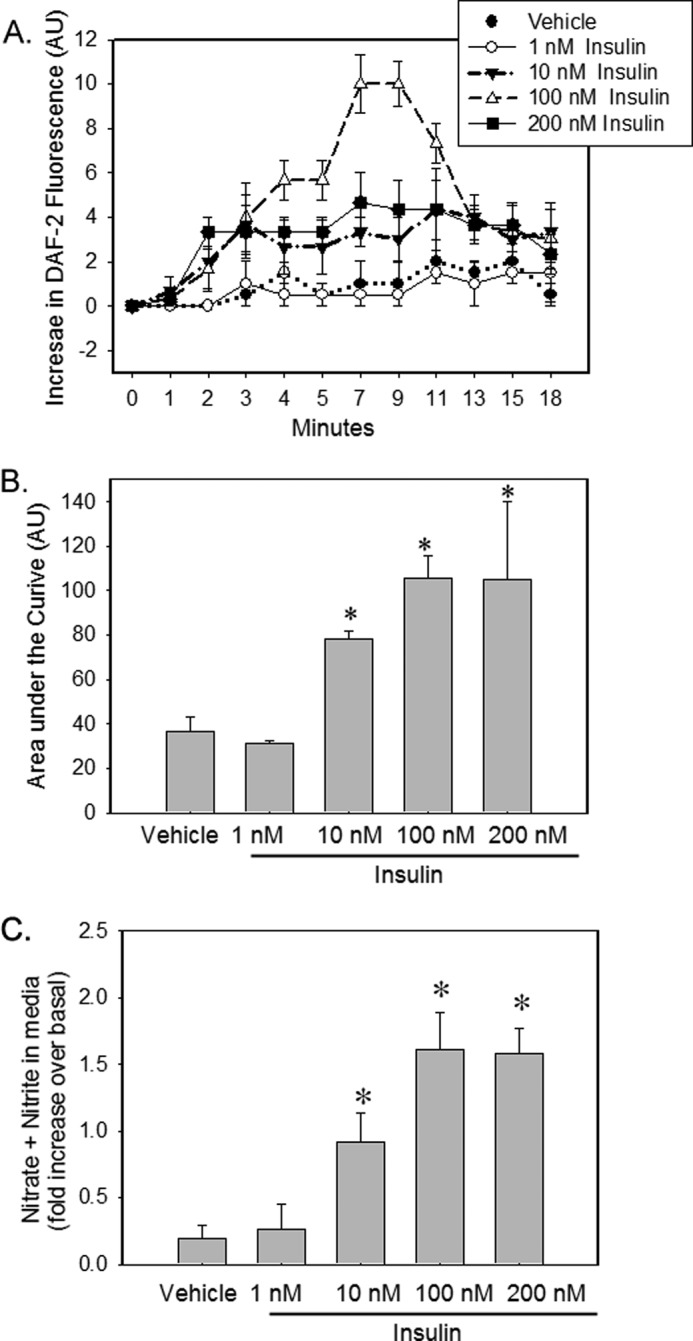
Insulin stimulates NO production in mouse IMCD cells. A, IMCD cells were loaded with DAF-FM for 60 min followed by vehicle or increasing concentration of insulin (1–200 nm) stimulation. Increase in fluorescence from baseline (mean ± S.E.) was plotted for each data point (n = 3). *, p < 0.05 versus vehicle for same time of incubation. AU, arbitrary units. B, area under the curve over the period of 18 min for above graph. C, after 15 min of vehicle or insulin stimulation, medium from these cells were analyzed for increase in NO metabolite (nitrate + nitrite, NOx) levels over the medium from the same cells before stimulation. Treatment was plotted as the mean ± S.E. of three independent experiments; *, p < 0.05 as compared with vehicle.
We next examined the accumulation of NO metabolites (nitrates plus nitrites; NOx) in the medium from these cells after 15 min of vehicle or insulin stimulation and compared these results with the medium from the same cells before stimulation. Insulin stimulation increased NOx levels in the medium in a dose-dependent manner as compared with vehicle (Fig. 2B). The rise in NOx levels by 1 nm insulin was not significantly different from vehicle. The rise in NOx was similar for 100 nm and 200 nm over the period of 15 min.
Insulin Stimulates eNOS Activation in IMCD Cells
We then examined the effect of insulin on key phospho-signaling proteins in IMCD cells. In response to insulin (100 nm), a significant increase in phosphorylation of both Akt (at Thr-308) and eNOS (at Ser-1177) was observed as indicated by a higher mean band density normalized to β-actin: ∼1.5- and 2.5-fold, respectively, versus vehicle (Fig. 3, A and B). In addition, immunofluorescence also revealed increased p-eNOSSer1177 expression in insulin-stimulated cells relative to vehicle (Fig. 3C).
FIGURE 3.

Insulin stimulates eNOS phosphorylation in IMCD cells. IMCD cells were treated with vehicle or insulin (100 nm) for 15 min. A, representative lanes are shown from immunoblots of cell lysate probed with the antibody against p-AktTh308, Akt, p-eNOSSer1177, eNOS, and IR-β; β-actin was used as a loading control. B, summary of band densities, normalized to β-actin (n = 5/treatment). *, p < 0.05 versus vehicle for same time of incubation. Error bars indicate mean ± S.E. C, representative microscopic images evaluating insulin-stimulated phosphorylation of eNOS at Ser-1177 by immunofluorescence using antibody against p-eNOSSer1177 (red color). Hoechst stain (blue color) was used for nuclear staining (100× and 600×).
PI 3-Kinase Is Required for Insulin-stimulated eNOS Activation and NO Production in IMCD Cells
To determine the role of PI 3-kinase in insulin-stimulated eNOS regulation, IMCD cells were pretreated with wortmannin (500 nm). Immunoblotting revealed that insulin-stimulated eNOS phosphorylation at Ser-1177 was attenuated in wortmannin-pretreated cells (Fig. 4A). In addition, the rise in NOx levels in response to 15 min of insulin stimulation was also blocked by wortmannin pretreatment (Fig. 4B).
FIGURE 4.
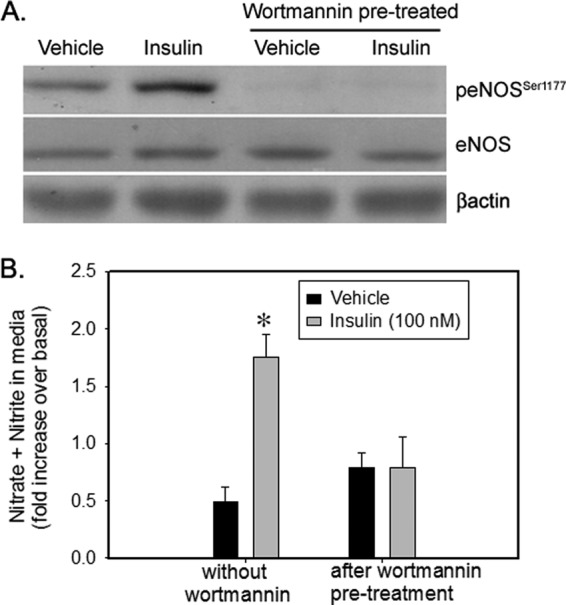
PI 3-kinase inhibitor Wortmannin inhibited NO production and eNOS phosphorylation in IMCD. IMCD cells were preincubated with vehicle (dimethyl sulfoxide (DMSO)) or wortmannin (500 nm) for 30 min followed by stimulation with vehicle or insulin (100 nm) for 15 min. A, representative lanes are shown from immunoblots of cell lysate probed with the antibody against p-eNOSSer1177 and re-probed with eNOS and β-actin. B, NO metabolite (nitrate + nitrite, NOx) levels in the medium from the above cells. Data are presented as mean ± S.E. from three independent experiments; *, p < 0.05 as compared with vehicle.
IR Is Required for Insulin-induced NO Production
To further confirm the role of insulin receptor in NO production, we silenced IR in IMCD cells. We found that insulin-induced eNOS phosphorylation at Ser-1177 was blocked in IR-silenced cells. In addition, intracellular nitric oxide production in response to insulin was also significantly attenuated in IR-silenced IMCD cells relative to control cells (Fig. 5B). The rise in NOx levels in response to insulin in the medium from these cells was also absent in IR-silenced cells (Fig. 5C).
FIGURE 5.
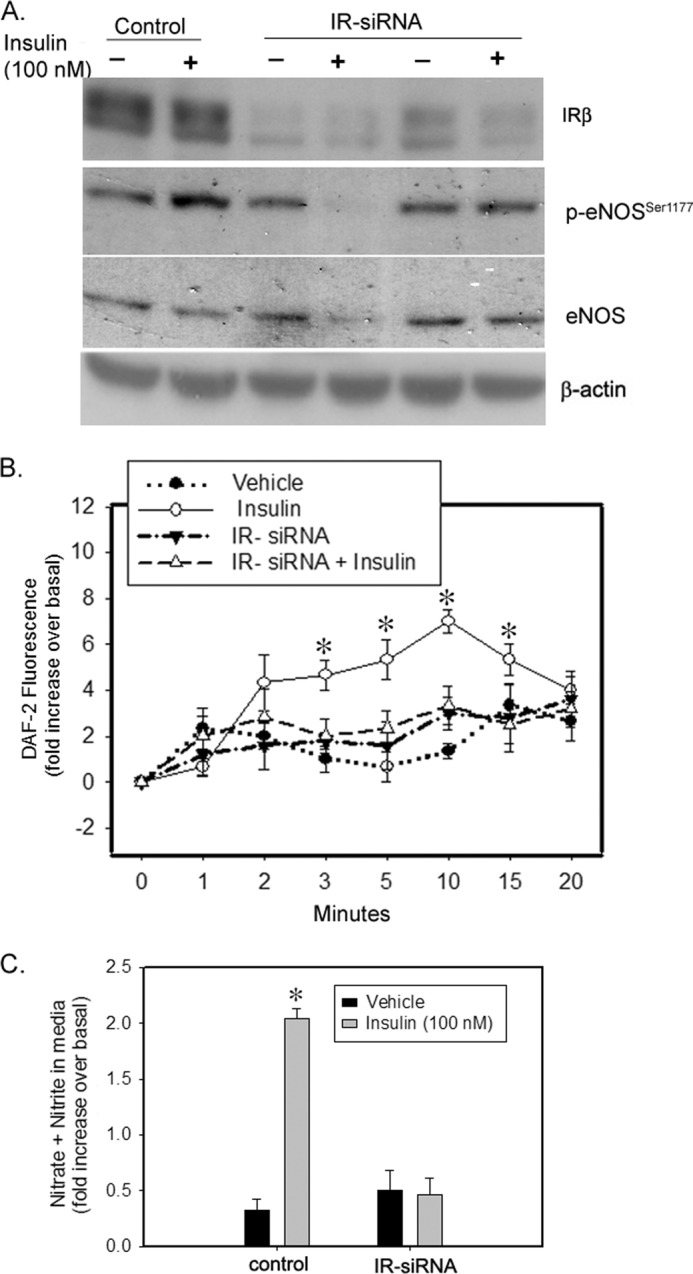
siRNA-mediated knockdown of IR attenuated insulin-induced NO production in IMCD cells. Cells were treated with scrambled siRNA or IR siRNA for 48 h and then loaded with DAF-FM dye for 30 min followed by vehicle or insulin (100 nm) stimulation. A, representative lanes are shown from immunoblots of cell lysate probed with the antibody against IR-β, p-eNOSSer1177, and re-probed with eNOS and β-actin. B, increase in fluorescence from baseline was plotted for each data point as mean ± S.E.; n = 3; *, p < 0.05 versus vehicle for same time of incubation. C, after 15 min of vehicle or insulin stimulation, medium from these cells were analyzed for increase in NO metabolite (nitrate + nitrite) levels over the medium from the same cells before stimulation. Treatment was plotted as the mean ± S.E. of three independent experiments; *, p < 0.05 as compared with vehicle.
IGF-1R Is Not Crucial in Insulin-induced eNOS Activation
Insulin and IGF-1 are capable of binding to each other's receptors. Moreover, insulin, at a dose of 100 nm, may cross-activate with IGF-1R and insulin/IGF-1R hybrid receptors (43). To address this, we compared the relative transcript levels of IGF-1R and IR receptors in IMCD cells. Using real time PCR, we found 4.3-fold higher IGF-1R transcript levels as compared with IR in IMCD cells (p = 0.0001). We next silenced IGF-1R alone and also IGF-1R in combination with IR. The insulin-induced increase in p-eNOS to eNOS ratio was not significantly different between IGF-1R-silenced and control IMCD cells (Fig. 6, A and B). Moreover, the rise in NOx levels in response to insulin was also similar in the media from IGF-1R-silenced and control IMCD cells (Fig. 6C). Silencing both receptors, however, significantly attenuated insulin-stimulated eNOS phosphorylation (Fig. 7), supporting a role of IR (but not IGF-1R) in insulin-stimulated NO production in IMCD cells.
FIGURE 6.
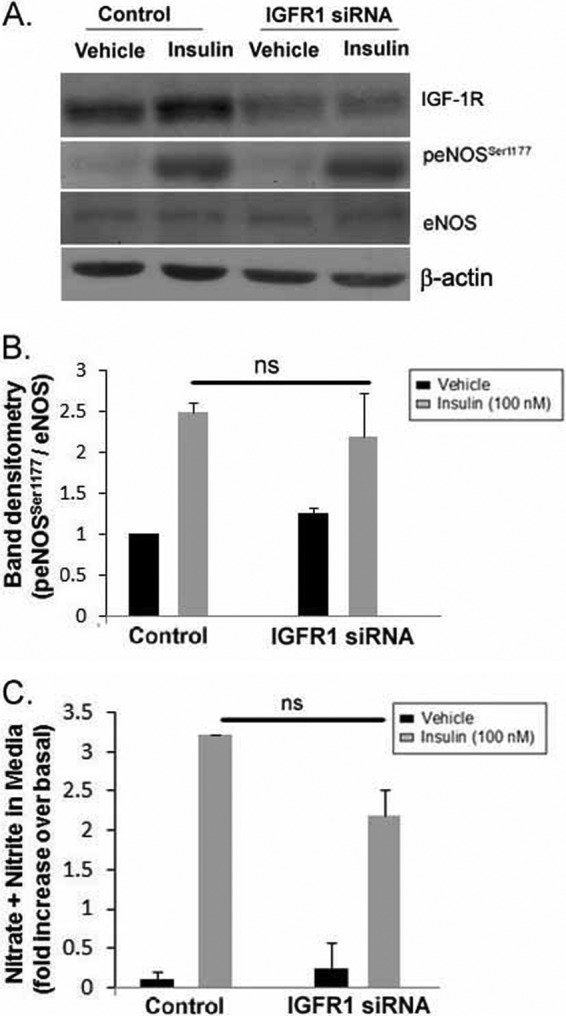
siRNA-mediated knockdown of IGF-1R in IMCD did not affect insulin-induced eNOS activation in IMCD cells. Cells were transfected with scrambled control siRNA or IGF-1R siRNA for 48 h followed by vehicle or insulin (100 nm) stimulation for 15 min. A, representative lanes are shown from immunoblots of cell lysate probed with the antibody against IGF-1R, p-eNOSSer1177, eNOS, and β-actin. B, summary of band densities for p-eNOSSer1177 normalized to eNOS. (n = 3/treatment). C, after 15 min of vehicle or insulin stimulation, medium from these cells were analyzed for increase in NO metabolite (nitrate + nitrite) levels over the medium from the same cells before stimulation. Treatment was plotted as the mean ± S.E. of three independent experiments; *, p < 0.05 as compared with vehicle. ns, not significant.
FIGURE 7.
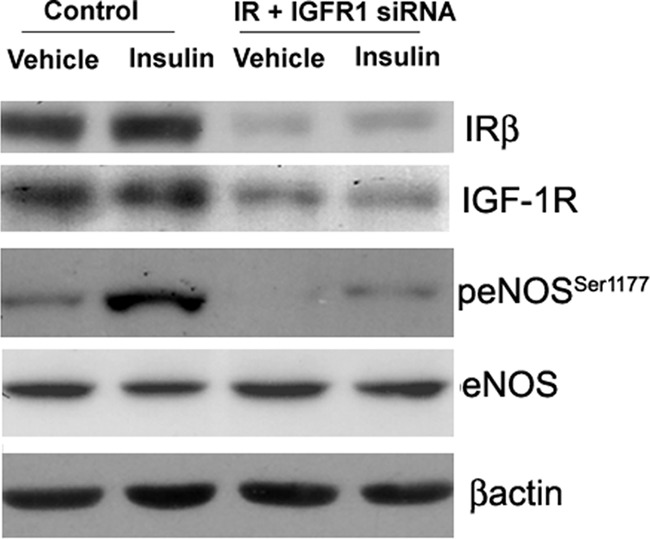
siRNA-mediated dual knockdown of IR and IGF-1R in IMCD reduced insulin-induced eNOS activation in IMCD cells. Cells were transfected with scrambled control siRNA or IR plus IGF-1R siRNA for 48 h followed by vehicle or insulin (100 nm) stimulation for 15 min. Representative lanes are shown from immunoblots of cell lysate probed with the antibody against IR-β, p-eNOSSer1177, followed by re-probing with IGF-1R, eNOS, and β-actin.
Impaired eNOS Regulation in Inner Medulla from IRKO Mice
An indication that the renal IR may have a role in insulin-induced NO production in IMCD cells originated from our earlier study done in IRKO mice (8). These IRKO mice had significantly (∼2-fold) lower urinary NOx levels as compared with WT littermates, both in response to acute insulin and in the basal state (24-h collection) (8). Based on data in IMCD cells in the present study, impaired eNOS regulation was a strong candidate to explain the reduced urinary NOx production in the IRKO mice (8). To address this, we performed immunohistochemistry for eNOS and p-eNOSSer1177 on kidney sections from untreated IRKO mice (n = 3/genotype). We found substantially lower immunoperoxidase-based staining for p-eNOSSer1177 in IMCD of IRKO mice as compared with WT littermates (Fig. 8A). In addition, when these mice were infused with insulin chronically (2 weeks), we found a significant rise in mean arterial blood pressure in IRKO mice (p = 0.03) along with lower overall protein levels of eNOS in the IRKO, p = 0.04; Fig. 8, B–D). Both groups had similar 24-h sodium and potassium excretion at the end of 2 weeks of insulin infusion (Table 1).
FIGURE 8.

Impaired eNOS regulation in inner medulla from IRKO mice. A, reduced p-eNOSSer1177 expression in renal inner medulla of IRKO mice versus wild type littermates (WT) by immunohistochemistry; n = 3/genotype; total magnification, 600×. B, mean arterial blood pressure (MAP) of WT and IRKO, chronically infused with insulin over a period of 2 weeks. * indicates a significant (p < 0.05) difference from baseline MAP. By the second week, insulin-infused IRKO mice showed significant rise in MAP relative to their baseline MAP (n = 3/genotype, p = 0.03). C, eNOS protein levels in inner medulla from the kidneys of insulin-infused IRKO and WT littermates. Representative lanes are shown from immunoblots of inner medullary homogenates probed with the antibody against eNOS and β-actin. D, summary of band densities, normalized to β-actin (n = 7/genotype; p = 0.04). Error bars in B and D indicate S.E.
TABLE 1.
Metabolic data from WT and IRKO mice at the end of 2 weeks of insulin infusion
Shown are 24 h of metabolic data on water intake and urine analysis of IRKO mice (mice with targeted deletion of insulin receptor from distal tubule cells) and their WT littermates, chronically infused with insulin for 2 weeks (50 units/kg of body weight). Data are presented as mean ± S.E. (n = 7/genotype).
| Metabolic indices | Wild type | IRKO |
|---|---|---|
| Water intake (ml) | 20.2 ± 2.4 | 18.4 ± 2.7 |
| Urine volume (ml) | 14.4 ± 2.2 | 14.5 ± 1.4 |
| Urine osmolality mosm/kg × H2O) | 106 ± 11 | 113 ± 19 |
| Urinary salt (mmol) | 174 ± 23 | 162 ± 18 |
| Urinary potassium (mmol) | 177 ± 21 | 185 ± 35 |
DISCUSSION
We have demonstrated for the first time that insulin induces eNOS activation and NO generation in IMCD cells. We have also shown that insulin stimulation of IMCD cells resulted in a dose-dependent rise in nitrate-nitrite levels in the medium, which furthermore illustrates the paracrine potential of NO produced in IMCD cells. Wortmannin and IR silencing abolished these effects of insulin, suggesting a role of the IR/PI3K pathway in insulin-stimulated NO generation in IMCD cells. Previously, we have reported increased BP and reduced urine NOx in IRKO mice, including collecting duct cells (8). We also showed that this attenuation in urine NOx and BP was salt-sensitive (11). In this study, we demonstrated reduced p-eNOSSer1177 in the inner medulla of these mice as compared with WT. In addition, chronic insulin infusion resulted in significant rise in BP and significantly lower eNOS abundance in inner medullary homogenates from IRKO mice as compared with WT littermates. Taken together these findings suggest that insulin stimulates inner medullary eNOS expression (chronically), as well as activity (acutely and chronically), and that a reduction in the number of active receptors affects this feed-forward response on expression, and therefore, affects activity via altered NO production.
Our time course- and dose-dependent experiments for insulin-induced NO production in IMCD cells suggest that insulin at a dose of 100 nm could maximally generate NO in IMCD cells within 15 min of stimulation. This is significantly above the physiological range for insulin in mice or humans (44); however, an increase was also observed at lower doses. Our studies do indicate that IMCD cells have the capacity to respond in some manner to greater agonist levels of insulin, if available. Insulin at 100 nm concentration has repeatedly been shown to strongly stimulate phosphorylation of Akt, eNOS, and other insulin-activated pathways (45, 46).
In IMCD cells, constitutively phosphorylated eNOSSer1177 was observed in vehicle-treated cells as indicated by immunoblotting as well as immunofluorescence. Insulin significantly increased phosphorylation by ∼2.5-fold in 15 min. Generation of significantly higher levels of NO within the first 2 min suggests a rapid phosphorylation of eNOS at Ser-1177 (Fig. 2). This insulin-induced eNOS activation and NO production appeared to be dependent on PI 3-kinase in IMCD cells (Fig. 4A). In addition, to PI 3-kinases, calcium/calmodulin-dependent protein kinase II (CaMKII) (47) and PKA (47) have also been shown to phosphorylate Ser-1177 and increase eNOS activity and NO production, at least in endothelial cells. We have not directly assessed the activation of these kinases; however, studies done in other cell systems have not shown insulin stimulation of eNOS via calcium/calmodulin-dependent protein kinase II or PKA (47, 48).
In endothelial cells, IGF-1R has been suggested to reduce the sensitivity of cells toward insulin and has also been indicated as a negative regulator of insulin-induced NO production (49, 50). In other cell systems, IGF-1R may activate the same pathways, i.e. PI3K, and may potentially amplify the signal (51, 52). To address the potential role of IGF-1R in mediating insulin-induced NO production in IMCD, we compared the transcript levels of IGF-1R in IMCD cells using RT-PCR. We found ∼4-fold higher IGF-1R in IMCD cells relative to IR levels. This compares reasonably with what has been reported in an IMCD Transcriptome Database (53). The higher levels of IGF-1R did not appear to affect sensitivity of IMCD toward insulin, at least with regard to eNOS activation. That is, IGF-1R silencing did not significantly affect insulin-stimulated eNOS phosphorylation. This is in contrast to the microvascular endothelium, where silencing of IGF-1R resulted in further increase in insulin-induced eNOS activation (49). This could be attributed to a greater -fold difference in IGF-1R versus IR (20 times more than IR) in endothelium as compared with IMCD (54) because a greater predominance of IGFR-1R may result in the formation of more hybrid receptors along with the IR, which responds more to IGF-1 than to insulin (50). However, this may not be the case in IMCD, at least for NO production, because IGF-1 stimulation in IMCD cells (0.1–200 nm) was not found to increase or decrease nitrate + nitrite levels in the medium (data not shown). Thus, IGF-1R or IGF-1 ligand acting through hybrid or IGF-1R receptors may not be crucial for NO production in IMCD cells.
IMCD cells express all three known isoforms of NOS (15, 55); however, in this study, we have focused on the eNOS (NOS3) isoform. eNOS regulation has been suggested as a candidate link in the pathogenesis of hypertension in the insulin-resistant state (Shankar et al. (56)). Moreover, eNOS null mice were shown to have impaired insulin stimulation of blood flow and substrate delivery to skeletal muscle tissue, both NO-dependent processes. On the other hand, nNOS null mice had well preserved vascular function including arterial BP (57). Furthermore, even in the absence of nNOS, the insulin-stimulated blood flow was found to be preserved, suggesting that insulin-induced vascular tone is mediated by eNOS and not nNOS (57). However, an important role of inducible NOS as a BP modulator in a case of salt-sensitive hypertension has been suggested (58). Finally, most studies report that IR signaling is linked to the activation of NOS, especially the eNOS isoform (30). Here we report a potential role for Akt in collecting duct cells in mediating eNOS regulation by IR.
One of the reasons we set out to study the effect of insulin on IMCD-generated NO was the fact that we observed reduced urine NOx and elevated BP in renal epithelial cell-targeted (Ksp-cadherin promoter) IR KO mice (8). In the current study, we found significantly lower p-eNOSSer1177 in IMCD in kidney sections from IRKO mice as compared with WT littermates in the basal state (Fig. 8A). Moreover, chronic insulin infusion led to rise in blood pressure and an ∼55% lower band density for eNOS protein in IRKO mice as compared with WT littermates (Fig. 8, B--D). In fact, WT mice infused with insulin, as compared with those maintained in the basal state, showed a marked increase in eNOS protein in inner medulla (Fig. 1, A and B). Thus, the reduced capacity to respond to insulin at the level of the IMCD in the IRKO might very well have contributed to reduced urine NOx and high BP in these mice. Moreover, normalized BP in insulin-infused WT mice, along with increased insulin-induced NO production in renal medulla (Fig. 1, C and D), further suggests that NO metabolism in renal inner medulla may have a role in normalizing BP in the insulin-sensitive state, despite putative sodium retention.
In summary, we provide direct evidence that in mouse IMCD cells, insulin augments NO production through increased eNOS expression and activity via PI3K-dependent pathway. This impairment in NO production in the setting of insulin resistance may further contribute to hypertension.
Acknowledgments
We thank Dr. Peter Igarashi (University of Texas Southwestern Medical Center, Dallas) for the generous gift of the mIMCD-3 cells and Drirh Khare, Ph.D. (Sanjay Gandhi Postgraduate Institute of Medical Sciences) for technical assistance.
This work was supported by a Ramalingaswami grant from the Department of Biotechnology (to S. T.).
- IR
- insulin receptor
- IMCD
- inner medullary collecting duct
- mIMCD
- mouse IMCD
- BP
- blood pressure
- NOx
- NO metabolite
- eNOS
- endothelial NOS
- nNOS
- neuronal NOS
- IGF-1R
- insulin-like growth factor-1 receptor
- PI
- phosphatidylinositol
- DAF-FM
- 4-amino-5-methylamino-2′,7′-difluorofluorescein
- MAP
- mean arterial blood pressure
- p
- phosphorylated
- DAF-2DA
- 4,5-diaminofluorescein.diacetate
- DAF-2T
- fluorescent triazole derivative of DAF-2.
REFERENCES
- 1. Venkatesan N., Davidson M. B. (1995) Insulin resistance in rats harboring growth hormone-secreting tumors: decreased receptor number but increased kinase activity in liver. Metabolism 44, 75–84 [DOI] [PubMed] [Google Scholar]
- 2. Grote C. W., Groover A. L., Ryals J. M., Geiger P. C., Feldman E. L., Wright D. E. (2013) Peripheral nervous system insulin resistance in ob/ob mice. Acta Neuropathol. Commun. 1, 15. [DOI] [PMC free article] [PubMed] [Google Scholar]
- 3. Rojas F. A., Hirata A. E., Saad M. J. (2003) Regulation of insulin receptor substrate-2 tyrosine phosphorylation in animal models of insulin resistance. Endocrine 21, 115–122 [DOI] [PubMed] [Google Scholar]
- 4. Boden G., Chen X., Ruiz J., Heifets M., Morris M., Badosa F. (1994) Insulin receptor down-regulation and impaired antilipolytic action of insulin in diabetic patients after pancreas/kidney transplantation. J. Clin. Endocrinol. Metab. 78, 657–663 [DOI] [PubMed] [Google Scholar]
- 5. Garvey W. T., Olefsky J. M., Marshall S. (1986) Insulin induces progressive insulin resistance in cultured rat adipocytes: sequential effects at receptor and multiple postreceptor sites. Diabetes 35, 258–267 [DOI] [PubMed] [Google Scholar]
- 6. Gavin J. R., 3rd, Roth J., Neville D. M., Jr., de Meyts P., Buell D. N. (1974) Insulin-dependent regulation of insulin receptor concentrations: a direct demonstration in cell culture. Proc. Natl. Acad. Sci. U.S.A. 71, 84–88 [DOI] [PMC free article] [PubMed] [Google Scholar]
- 7. Giorgino F., Almahfouz A., Goodyear L. J., Smith R. J. (1993) Glucocorticoid regulation of insulin receptor and substrate IRS-1 tyrosine phosphorylation in rat skeletal muscle in vivo. J. Clin. Invest. 91, 2020–2030 [DOI] [PMC free article] [PubMed] [Google Scholar]
- 8. Tiwari S., Sharma N., Gill P. S., Igarashi P., Kahn C. R., Wade J. B., Ecelbarger C. M. (2008) Impaired sodium excretion and increased blood pressure in mice with targeted deletion of renal epithelial insulin receptor. Proc. Natl. Acad. Sci. U.S.A. 105, 6469–6474 [DOI] [PMC free article] [PubMed] [Google Scholar]
- 9. Tiwari S., Singh R. S., Li L., Tsukerman S., Godbole M., Pandey G., Ecelbarger C. M. (2013) Deletion of the insulin receptor in the proximal tubule promotes hyperglycemia. J. Am. Soc. Nephrol. 24, 1209–1214 [DOI] [PMC free article] [PubMed] [Google Scholar]
- 10. Tiwari S., Halagappa V. K., Riazi S., Hu X., Ecelbarger C. A. (2007) Reduced expression of insulin receptors in the kidneys of insulin-resistant rats. J. Am. Soc. Nephrol. 18, 2661–2671 [DOI] [PubMed] [Google Scholar]
- 11. Li L., Garikepati R. M., Tsukerman S., Tiwari S., Ecelbarger C. M. (2012) Salt sensitivity of nitric oxide generation and blood pressure in mice with targeted knockout of the insulin receptor from the renal tubule. Am. J. Physiol. Regul. Integr. Comp. Physiol. 303, R505–R512 [DOI] [PMC free article] [PubMed] [Google Scholar]
- 12. Mattson D. L., Lu S., Nakanishi K., Papanek P. E., Cowley A. W., Jr. (1994) Effect of chronic renal medullary nitric oxide inhibition on blood pressure. Am. J. Physiol. 266, H1918–H1926 [DOI] [PubMed] [Google Scholar]
- 13. Elkayam U., Cohen G., Gogia H., Mehra A., Johnson J. V., Chandraratna P. A. (1996) Renal vasodilatory effect of endothelial stimulation in patients with chronic congestive heart failure. J. Am. Coll. Cardiol. 28, 176–182 [DOI] [PubMed] [Google Scholar]
- 14. Cowley A. W., Jr., Mori T., Mattson D., Zou A. P. (2003) Role of renal NO production in the regulation of medullary blood flow. Am. J. Physiol. Regul. Integr. Comp. Physiol. 284, R1355–R1369 [DOI] [PubMed] [Google Scholar]
- 15. Wu F., Park F., Cowley A. W., Jr., Mattson D. L. (1999) Quantification of nitric oxide synthase activity in microdissected segments of the rat kidney. Am. J. Physiol. 276, F874–F881 [DOI] [PubMed] [Google Scholar]
- 16. Zeidel M. L., Silva P., Brenner B. M., Seifter J. L. (1987) cGMP mediates effects of atrial peptides on medullary collecting duct cells. Am. J. Physiol. 252, F551–F559 [DOI] [PubMed] [Google Scholar]
- 17. Zimpelmann J., Li N., Burns K. D. (2003) Nitric oxide inhibits superoxide-stimulated urea permeability in the rat inner medullary collecting duct. Am. J. Physiol. Renal Physiol. 285, F1160–F1167 [DOI] [PubMed] [Google Scholar]
- 18. Kuboki K., Jiang Z. Y., Takahara N., Ha S. W., Igarashi M., Yamauchi T., Feener E. P., Herbert T. P., Rhodes C. J., King G. L. (2000) Regulation of endothelial constitutive nitric oxide synthase gene expression in endothelial cells and in vivo: a specific vascular action of insulin. Circulation 101, 676–681 [DOI] [PubMed] [Google Scholar]
- 19. Schmetterer L., Müller M., Fasching P., Diepolder C., Gallenkamp A., Zanaschka G., Findl O., Strenn K., Mensik C., Tschernko E., Eichler H. G., Wolzt M. (1997) Renal and ocular hemodynamic effects of insulin. Diabetes 46, 1868–1874 [DOI] [PubMed] [Google Scholar]
- 20. Ter Maaten J. C., Bakker S. J., Serné E. H., Moshage H. J., Donker A. J., Gans R. O. (2000) Insulin-mediated increases in renal plasma flow are impaired in insulin-resistant normal subjects. Eur. J. Clin. Invest. 30, 1090–1098 [DOI] [PubMed] [Google Scholar]
- 21. ter Maaten J. C., Bakker S. J., Serné E. H., Donker A. J., Gans R. O. (2001) Renal sodium handling and haemodynamics are equally affected by hyperinsulinaemia in salt-sensitive and salt-resistant hypertensives. J. Hypertens. 19, 1633–1641 [DOI] [PubMed] [Google Scholar]
- 22. Scherrer U., Sartori C. (1997) Insulin as a vascular and sympathoexcitatory hormone: implications for blood pressure regulation, insulin sensitivity, and cardiovascular morbidity. Circulation 96, 4104–4113 [DOI] [PubMed] [Google Scholar]
- 23. Erdely A., Freshour G., Maddox D. A., Olson J. L., Samsell L., Baylis C. (2004) Renal disease in rats with type 2 diabetes is associated with decreased renal nitric oxide production. Diabetologia 47, 1672–1676 [DOI] [PMC free article] [PubMed] [Google Scholar]
- 24. Trujillo J., Ramírez V., Pérez J., Torre-Villalvazo I., Torres N., Tovar A. R., Muñoz R. M., Uribe N., Gamba G., Bobadilla N. A. (2005) Renal protection by a soy diet in obese Zucker rats is associated with restoration of nitric oxide generation. Am. J. Physiol. Renal Physiol. 288, F108–F116 [DOI] [PubMed] [Google Scholar]
- 25. Lin S., Chen J., Sun J., Zhu W. (1997) Existence of an abnormal nitric oxide metabolism seen in glomeruli and inner medullary collecting duct in diabetic rat. Chin. Med. J. (Engl.) 110, 515–519 [PubMed] [Google Scholar]
- 26. Schmidt R. J., Baylis C. (2000) Total nitric oxide production is low in patients with chronic renal disease. Kidney Int. 58, 1261–1266 [DOI] [PMC free article] [PubMed] [Google Scholar]
- 27. Schmidt R. J., Yokota S., Tracy T. S., Sorkin M. I., Baylis C. (1999) Nitric oxide production is low in end-stage renal disease patients on peritoneal dialysis. Am. J. Physiol. 276, F794–F797 [DOI] [PMC free article] [PubMed] [Google Scholar]
- 28. Rauchman M. I., Nigam S. K., Delpire E., Gullans S. R. (1993) An osmotically tolerant inner medullary collecting duct cell line from an SV40 transgenic mouse. Am. J. Physiol. 265, F416–F424 [DOI] [PubMed] [Google Scholar]
- 29. Cohen D. M., Chin W. W., Gullans S. R. (1994) Hyperosmotic urea increases transcription and synthesis of Egr-1 in murine inner medullary collecting duct (mIMCD3) cells. J. Biol. Chem. 269, 25865–25870 [PubMed] [Google Scholar]
- 30. Kaulfuss S., Burfeind P., Gaedcke J., Scharf J. G. (2009) Dual silencing of insulin-like growth factor-I receptor and epidermal growth factor receptor in colorectal cancer cells is associated with decreased proliferation and enhanced apoptosis. Mol. Cancer Ther. 8, 821–833 [DOI] [PubMed] [Google Scholar]
- 31. Montagnani M., Chen H., Barr V. A., Quon M. J. (2001) Insulin-stimulated activation of eNOS is independent of Ca2+ but requires phosphorylation by Akt at Ser1179. J. Biol. Chem. 276, 30392–30398 [DOI] [PubMed] [Google Scholar]
- 32. Green L. C., Wagner D. A., Glogowski J., Skipper P. L., Wishnok J. S., Tannenbaum S. R. (1982) Analysis of nitrate, nitrite, and [15N]nitrate in biological fluids. Anal. Biochem. 126, 131–138 [DOI] [PubMed] [Google Scholar]
- 33. Kojima H., Nakatsubo N., Kikuchi K., Urano Y., Higuchi T., Tanaka J., Kudo Y., Nagano T. (1998) Direct evidence of NO production in rat hippocampus and cortex using a new fluorescent indicator: DAF-2 DA. Neuroreport 9, 3345–3348 [DOI] [PubMed] [Google Scholar]
- 34. Li L., Garikepati R. M., Tsukerman S., Kohan D., Wade J. B., Tiwari S., Ecelbarger C. M. (2013) Reduced ENaC activity and blood pressure in mice with genetic knockout of the insulin receptor in the renal collecting duct. Am. J. Physiol. Renal Physiol. 304, F279–F288 [DOI] [PMC free article] [PubMed] [Google Scholar]
- 35. Kikawa K., Sakano D., Shiraki N., Tsuyama T., Kume K., Endo F., Kume S. (2014) Beneficial effect of insulin treatment on islet transplantation outcomes in Akita mice. PLoS One 9, e95451. [DOI] [PMC free article] [PubMed] [Google Scholar]
- 36. Frikke-Schmidt H., Pedersen T. Å., Fledelius C., Olsen G. S., Hellerstein M. (2013) Adipose weight gain during chronic insulin treatment of mice results from changes in lipid storage without affecting de novo synthesis of palmitate. PLoS One 8, e76060. [DOI] [PMC free article] [PubMed] [Google Scholar]
- 37. Song J., Hu X., Riazi S., Tiwari S., Wade J. B., Ecelbarger C. A. (2006) Regulation of blood pressure, the epithelial sodium channel (ENaC), and other key renal sodium transporters by chronic insulin infusion in rats. Am. J. Physiol. Renal Physiol. 290, F1055–F1064 [DOI] [PubMed] [Google Scholar]
- 38. Tiwari S., Li L., Riazi S., Halagappa V. K., Ecelbarger C. M. (2009) Sex and age result in differential regulation of the renal thiazide-sensitive NaCl cotransporter and the epithelial sodium channel in angiotensin II-infused mice. Am. J. Nephrol. 30, 554–562 [DOI] [PMC free article] [PubMed] [Google Scholar]
- 39. Kalani A., Mohan A., Godbole M. M., Bhatia E., Gupta A., Sharma R. K., Tiwari S. (2013) Wilm's tumor-1 protein levels in urinary exosomes from diabetic patients with or without proteinuria. PLoS One 8, e60177. [DOI] [PMC free article] [PubMed] [Google Scholar]
- 40. Ecelbarger C. A., Kim G. H., Terris J., Masilamani S., Mitchell C., Reyes I., Verbalis J. G., Knepper M. A. (2000) Vasopressin-mediated regulation of epithelial sodium channel abundance in rat kidney. Am. J. Physiol. Renal Physiol. 279, F46–F53 [DOI] [PubMed] [Google Scholar]
- 41. Ecelbarger C. A., Knepper M. A., Verbalis J. G. (2001) Increased abundance of distal sodium transporters in rat kidney during vasopressin escape. J. Am. Soc. Nephrol. 12, 207–217 [DOI] [PubMed] [Google Scholar]
- 42. Tiwari S., Nordquist L., Halagappa V. K., Ecelbarger C. A. (2007) Trafficking of ENaC subunits in response to acute insulin in mouse kidney. Am. J. Physiol. Renal Physiol. 293, F178–F185 [DOI] [PubMed] [Google Scholar]
- 43. Li G., Barrett E. J., Wang H., Chai W., Liu Z. (2005) Insulin at physiological concentrations selectively activates insulin but not insulin-like growth factor I (IGF-I) or insulin/IGF-I hybrid receptors in endothelial cells. Endocrinology 146, 4690–4696 [DOI] [PubMed] [Google Scholar]
- 44. Muniyappa R., Sowers J. R. (2012) Endothelial insulin and IGF-1 receptors: when yes means NO. Diabetes 61, 2225–2227 [DOI] [PMC free article] [PubMed] [Google Scholar]
- 45. Nagoshi T., Matsui T., Aoyama T., Leri A., Anversa P., Li L., Ogawa W., del Monte F., Gwathmey J. K., Grazette L., Hemmings B. A., Kass D. A., Champion H. C., Rosenzweig A. (2005) PI3K rescues the detrimental effects of chronic Akt activation in the heart during ischemia/reperfusion injury. J. Clin. Invest. 115, 2128–2138 [DOI] [PMC free article] [PubMed] [Google Scholar]
- 46. Tsuchiya A., Kanno T., Nishizaki T. (2014) PI3 kinase directly phosphorylates Akt1/2 at Ser473/474 in the insulin signal transduction pathway. J. Endocrinol. 220, 49–59 [DOI] [PMC free article] [PubMed] [Google Scholar]
- 47. Michell B. J., Chen Z.-p., Tiganis T., Stapleton D., Katsis F., Power D. A., Sim A. T., Kemp B. E. (2001) Coordinated control of endothelial nitric-oxide synthase phosphorylation by protein kinase C and the cAMP-dependent protein kinase. J. Biol. Chem. 276, 17625–17628 [DOI] [PubMed] [Google Scholar]
- 48. Fleming I., Fisslthaler B., Dimmeler S., Kemp B. E., Busse R. (2001) Phosphorylation of Thr495 regulates Ca2+/calmodulin-dependent endothelial nitric oxide synthase activity. Circ. Res. 88, E68–E75 [DOI] [PubMed] [Google Scholar]
- 49. Abbas A., Imrie H., Viswambharan H., Sukumar P., Rajwani A., Cubbon R. M., Gage M., Smith J., Galloway S., Yuldeshava N., Kahn M., Xuan S., Grant P. J., Channon K. M., Beech D. J., Wheatcroft S. B., Kearney M. T. (2011) The insulin-like growth factor-1 receptor is a negative regulator of nitric oxide bioavailability and insulin sensitivity in the endothelium. Diabetes 60, 2169–2178 [DOI] [PMC free article] [PubMed] [Google Scholar]
- 50. Gatenby V. K., Imrie H., Kearney M. (2013) The IGF-1 receptor and regulation of nitric oxide bioavailability and insulin signalling in the endothelium. Pflugers Arch. 465, 1065–1074 [DOI] [PubMed] [Google Scholar]
- 51. Repetto S., Salani B., Maggi D., Cordera R. (2005) Insulin and IGF-I phosphorylate eNOS in HUVECs by a caveolin-1 dependent mechanism. Biochem. Biophys. Res. Commun. 337, 849–852 [DOI] [PubMed] [Google Scholar]
- 52. Wang Y., Nagase S., Koyama A. (2004) Stimulatory effect of IGF-I and VEGF on eNOS message, protein expression, eNOS phosphorylation and nitric oxide production in rat glomeruli, and the involvement of PI3-K signaling pathway. Nitric Oxide 10, 25–35 [DOI] [PubMed] [Google Scholar]
- 53. Uawithya P., Pisitkun T., Ruttenberg B. E., Knepper M. A. (2008) Transcriptional profiling of native inner medullary collecting duct cells from rat kidney. Physiol. Genomics 32, 229–253 [DOI] [PMC free article] [PubMed] [Google Scholar]
- 54. Johansson G. S., Chisalita S. I., Arnqvist H. J. (2008) Human microvascular endothelial cells are sensitive to IGF-I but resistant to insulin at the receptor level. Mol. Cell. Endocrinol. 296, 58–63 [DOI] [PubMed] [Google Scholar]
- 55. Cai Z., Xin J., Pollock D. M., Pollock J. S. (2000) Shear stress-mediated NO production in inner medullary collecting duct cells. Am. J. Physiol. Renal Physiol. 279, F270–274 [DOI] [PubMed] [Google Scholar]
- 56. Shankar R. R., Wu Y., Shen H. Q., Zhu J. S., Baron A. D. (2000) Mice with gene disruption of both endothelial and neuronal nitric oxide synthase exhibit insulin resistance. Diabetes 49, 684–687 [DOI] [PubMed] [Google Scholar]
- 57. Turini P., Thalmann S., Jayet P. Y., Cook S., Mathieu C., Burcelin R., Nicod P., Vollenweider P., Sartori C., Scherrer U. (2007) Insulin resistance in mice lacking neuronal nitric oxide synthase is related to an α-adrenergic mechanism. Swiss Med. Wkly. 137, 700–704 [DOI] [PubMed] [Google Scholar]
- 58. Tan D. Y., Caramelo C. (2000) Role of renal medullary inducible nitric oxide synthase in the regulation of arterial pressure. Sheng Li Xue Bao 52, 103–108 [PubMed] [Google Scholar]