Abstract
Objectives
To compare the difference between the China growth reference and the WHO growth standards in assessing malnutrition of children under 5 years.
Settings
The households selected from 31 provinces, autonomous regions and municipalities in mainland China (except Taiwan, Hong Kong and Macao).
Participants
Households were selected by using a stratified, multistage probability cluster sampling. Children under 5 years of age in the selected households were recruited (n=15 886).
Primary and secondary outcome measures
Underweight, stunting, wasting, overweight and obesity.
Results
According to the China growth reference, the prevalence of underweight (8.7% vs 4.8%), stunting (17.2% vs 16.1%) and wasting (4.4% vs 3%) was significantly higher than that based on the WHO growth standards, respectively (p<0.001); the prevalence of overweight was lower than that based on the WHO growth standards (9.4% vs 10.2%, p<0.001). In most cases, the prevalence of undernutrition assessed by using the China growth reference was significantly higher. However, the prevalence of overweight was significantly lower by using China charts for boys aged 3–4, 6, 8, 10, 12–18 and 24 months.
Conclusions
The WHO growth standards could be more conservative in undernutrition estimation and more applicable for international comparison for Chinese children. Future researches are warranted for using the WHO growth standards within those countries with local growth charts when there are distinct differences between the two.
Keywords: malnutrition, children under 5, China growth reference, WHO growth standards
Strengths and limitations of this study.
The study compared the China growth reference with the WHO growth standards in assessing malnutrition of children under 5 years of age by using a national representative samples in China.
The comparison could provide practical suggestions for selecting growth reference in malnutrition assessment in China.
The results could provide evidence for adapting the WHO growth standards in the member country with a local growth reference.
The information available is not sufficient to address the reasons for the difference between the two growth charts.
Introduction
Child malnutrition remains highly prevalent in low-income and middle-income countries, which results in significantly high mortality and morbidity.1 The Lancet series on Maternal and child malnutrition in 2013 estimated that 3.1 million deaths and 45% of all child deaths in 2011 were due to malnutrition (fetal growth restriction, stunting, wasting, vitamin A and zinc deficiency and suboptimal breastfeeding) globally.1 Anthropometric measurements (weight, length/height) of children under five are widely used indicators for assessing health and nutrition status.2 These measurements are commonly assessed against growth charts, which are often used as a scale to evaluate individual and population growth status.
The WHO released a set of growth standards in 2006, which was constructed by using data from six countries (Brazil, Ghana, India, Norway, Oman and the USA) across the world.3 All children living under the optimal environment for growth (breastfed, non-smoking mother and adequate access to healthcare) were sampled to construct the standards. Many countries had their own growth reference or used the previous NCHS/WHO growth reference before the new WHO growth standards were released. About 125 countries have adopted the WHO growth charts, 25 countries were considering adopting them and 30 countries did not adopt them by 2011.4 Some countries partially adopted the new growth standards. For example, the USA adopted the part of growth charts for those under 2 years of age.5 The European Society for Paediatric Gastroenterology, Hepatology and Nutrition Committee on Nutrition recommends that the WHO child growth standards should be adopted for 0–5-year-old children in Europe.6
The current China growth reference was released in 2009, which was developed based on a 9-city study in 2005.7 The nine cities (including Beijing, Ha'erbin, Xi'an, Shanghai, Nanjing, Wuhan, Fuzhou, Guangzhou and Kunming) represent north, central and south China. The growth reference was widely used in clinics in China.
The purpose of the current study is to compare the WHO growth standards with the China growth reference in assessing malnutrition of children under 5 years of age in a national representative sample in China.
Subjects and methods
The data were extracted from the China National Nutrition and Health Survey in 2002 (CNNHS). The detailed information of CNNHS was described somewhere else.8 A brief study design of CNNHS 2002 is outlined below. All children under 5 years were recruited from the selected households in the survey. In rural sites, children under 3 years were recruited from the remaining households of the six selected villages to meet the minimal requirement of a sample size of 50 for each county. In urban sites, children under 3 years were recruited from paediatric healthcare clinics or immunisation clinics in the selected communities and each age group of children between 3 and 5 years of age was sampled from kindergarten to meet the minimal requirement of a sample size of 50 for each country. All caregivers or guardians gave their written consent.
Anthropometric measurements were conducted by trained field workers and standard procedure was followed. Body weight was measured by using the same model beam scales across the survey sties, with light clothes (to the nearest 0.1 kg for children aged 3 years or older and 0.05 kg for children younger than 3 years). Scales were calibrated by using 10 L water when the scales were moved. Length was measured by using an infantometer for children younger than 3 years; height was measured by using a stadiometer for children aged 3 years or older (to the nearest 0.1 cm), after removing shoes and hats. All equipment was provided by the project. Gender and birth date information were extracted from the family or children's questionnaire.
The construction of the WHO and China growth charts was described elsewhere.3 9 Briefly, the WHO growth charts were released in 2006.3 The WHO growth charts study included a longitudinal study until 24 months of age and a cross-sectional study of children aged between 18 and 71 months. Study populations were from a socioeconomic environment without constraint to growth, with low mobility and 20% of mothers practising breastfeeding. Non-smoking mothers were included in the study if they were willing to follow the study's feeding recommendations (ie, exclusive or predominant breastfeeding for at least 4 months for a longitudinal study and any form of breastfeeding for at least 3 months, introduction of complementary foods by the age of 6 months, and partial breastfeeding continued to age ≥12 months). The gestational age was between ≥37 completed weeks and ≤42 weeks. Full-term low birthweight babies were not excluded. The newborn was a singleton and absent of significant morbidity.
The China growth reference was developed based on a cross-sectional study, which was conducted in 2005 in nine cities (including Beijing, Ha'erbin, Xi'an, Shanghai, Nanjing, Wuhan, Fuzhou, Guangzhou and Kunming).9 All children aged under 7 years living in study areas were eligible for the study (n=69 760). The exclusion criteria included: (1) preterm (<37-weeks of gestation) or low birth weight (birth weight <2500 g), (2) twins or triplets; (3) significant diseases (cardiovascular diseases, chronic nephritis, tuberculosis, hepatitis, endemic diseases, chronic bronchitis, asthma, endocrinological disorder, neurological diseases, rickets, hand–foot deformity, acute diseases (pneumonia, dysentery) recovery within 1 month, fever for 7 days during the past 2 weeks or diarrhoea lasting for 5 days). The outliers for height or weight (<−3 SD or >+ 4 SD) were excluded for the model building. The age group was classified according to 1 month each group for infants aged between 0 month and 11 months and 3 months each group for children aged between 12 and 83 months in the model. The LMS method was used for model fit.
We used SAS software (V.9.2; SAS Institute Inc, Cary, North Carolina, USA) to perform all the analyses. All extreme values were excluded for those >3 SD or <−3 SD by age and gender, as the maximum sample size for each age and gender group is below 550 and the distribution from−3 SD to 3 SD covers 99.74% of the population. SD was calculated based on sample distribution. Stunting was defined as length/height shorter than the corresponding length/height of length/height-for-age Z-scores of −2 for specific age and gender. Severe stunting was defined as length/height shorter than the corresponding length/height of length/height-for-age Z-scores of −3 for specific age and gender. Underweight was defined as weight lighter than the corresponding weight of weight-for-age Z-scores of −2 for specific age and gender. Severe underweight was defined as weight lighter than the corresponding weight of weight-for-age Z-scores of −3 for specific age and gender. Wasting was defined as weight lighter than the corresponding weight of weight-for-length/height Z-scores of −2 for specific length/height and gender. Severe wasting was defined as weight lighter than the corresponding weight of weight-for-length/height Z-scores of −3 for specific length/height and gender. Overweight was defined as weight heavier than the corresponding weight of weight-for-length/height Z-scores of 2 for specific length/height and gender. Obesity was defined as weight heavier than the corresponding weight of weight-for-length/height Z-scores of 3 for specific length/height and gender. Children aged 2–3 years were excluded for wasting and overweight assessments because length measurement cannot be converted to height for weight-for-height growth charts without age being specified. McNemar's test was used to compare the prevalence estimates between the WHO growth charts and China growth charts. McNemar’s test is appropriate for analysing matched pair data with a dichotomous response. Under the null hypothesis with the number of discordants greater than 25, the distribution follows a χ2 distribution with 1 degree of freedom. A logistic regression model was used to assess the relationship between malnutrition and age and gender based on the WHO charts. p Values<0.05 were considered significant. Descriptive statistics are presented as mean±SD or per cent, and results of the logistic regression analyses are presented as OR (95% CI).
Results
In total, 15 886 children under 5-years of age were included in the analyses, 54.4% of whom were boys, and the percentages of each age composition ranged between 0.65% and 7.12%.
The prevalence of stunting was 17.2% when estimated by using the China growth charts, which was significantly higher than 16.1% when assessed by using the WHO growth standards (table 1). The prevalence of severe stunting was significantly higher when assessed by using the China charts than by using the WHO charts (6.7% vs 6.0%, p<0.001; table 1). The prevalence of underweight was 8.7% when estimated by using the China charts, which was significantly greater than 4.8% estimated by using the WHO charts (table 1). The prevalence of severe underweight was doubled when assessed by using the China charts (table 1). The prevalence of wasting was 4.4% when assessed by using the China charts, which was significantly higher than 3% assessed by using the WHO charts (table 1). The prevalence of severe wasting was significantly higher when assessed by using the China charts than by using the WHO charts (1.4% vs 1%, p<0.001). In contrast, the prevalence of overweight was significantly lower when assessed by using the China charts than by using the WHO growth charts (9.4% vs 10.2%, p<0.001). There was no significant difference in assessing obesity between the China charts and the WHO charts (4% vs 4.1%, p=0.13).
Table 1.
Comparison of prevalence of malnutrition estimated by using the China charts versus the WHO charts
| Indicators | China | WHO | p Value |
|---|---|---|---|
| Stunting (%) | 17.2 | 16.1 | <0.001 |
| Severe stunting (%) | 6.7 | 6.0 | <0.001 |
| Underweight (%) | 8.7 | 4.8 | <0.001 |
| Severe underweight (%) | 2.1 | 1.0 | <0.001 |
| Wasting (%) | 4.4 | 3.0 | <0.001 |
| Severe wasting (%) | 1.4 | 1.0 | <0.001 |
| Overweight (%) | 9.4 | 10.2 | <0.001 |
| Obesity (%) | 4.0 | 4.1 | 0.13 |
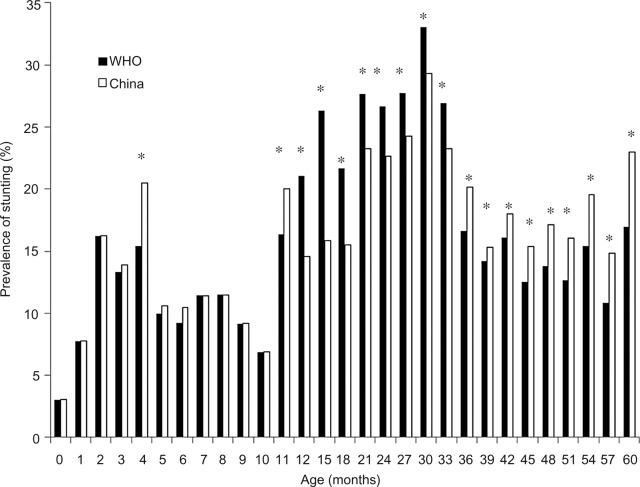
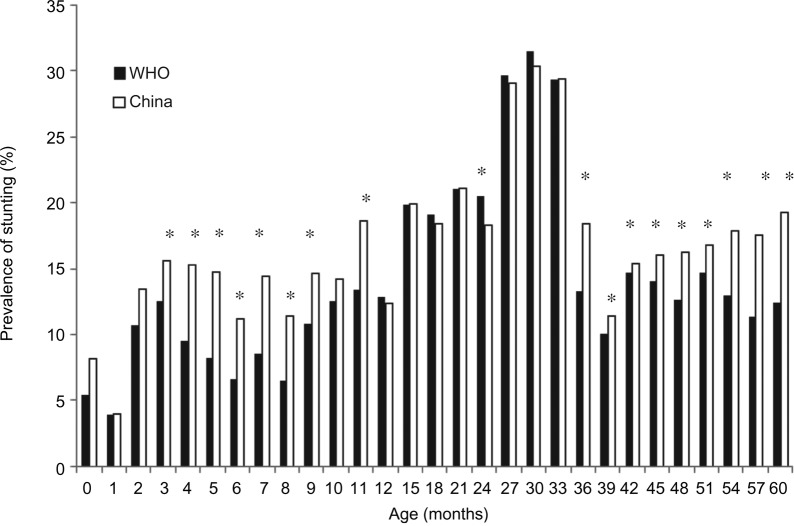
The results for stunting were mixed across various gender and ages. The prevalence of stunting was significantly higher for boys aged 4, 11, 36–60 months when assessed by using the China charts than by using the WHO charts (figure 1). The prevalence of stunting was significantly higher for girls aged 3–9, 11 and 36–60 months when estimated by using the China charts than by using the WHO charts (figure 2). However, the prevalence of stunting was significantly lower for boys aged 12–33 months and for girls aged 24 months when assessed by using the China charts than by using the WHO charts (figures 1 and 2). Even though not all differences were statistically significant, the prevalence of stunting tended to be equal or higher for boys or girls aged 12–33 months when the WHO growth standards were used. It was the opposite for other age groups (figures 1 and 2).
Figure 1.
Comparison of prevalence of stunting for boys under 5 years estimated by the WHO growth standards versus China growth reference; WHO growth standards: solid bar; China growth reference: empty bar; *p<0.05.
Figure 2.
Comparison of prevalence of stunting for girls under 5-years estimated by the WHO growth standards versus China growth charts; WHO growth standards: solid bar; China growth reference: empty bar; *p<0.05.
The prevalence of severe stunting was significantly higher for boys aged 36–60 months when estimated by using the China charts than by using the WHO charts. However, the results were the opposite for boys aged 12–24 and 30 months. The prevalence of severe stunting was significantly higher for girls aged 6, 36 and 42–60 months.
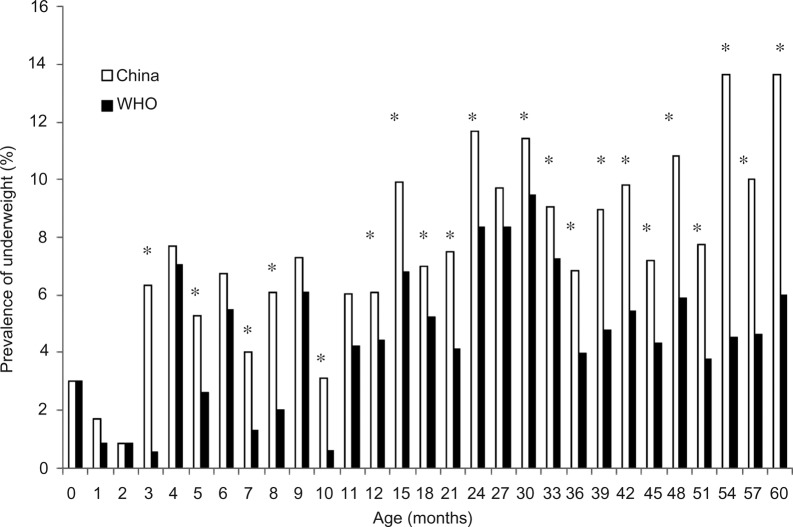
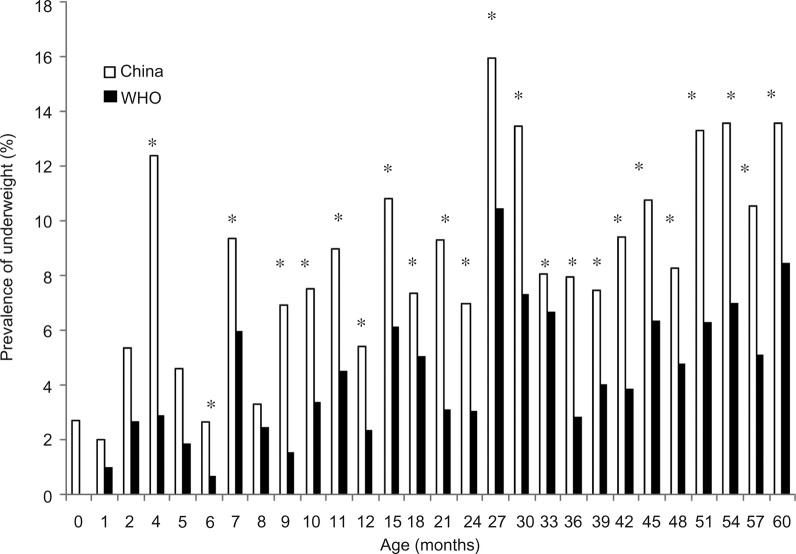
The prevalence of underweight was significantly greater for boys older than 3 months, except those aged 4, 6, 9, 11 and 27 months when estimated by using the China charts than by using the WHO charts (figure 3). So was the prevalence of underweight for girls older than 4 months, except those at 5 and 8 months (figure 4). For those age groups with non-significant difference, the prevalence of underweight tended to be equal or greater for both genders too when the China growth charts were used (figures 3 and 4).
Figure 3.
Comparison of prevalence of underweight for boys under 5-years estimated by the WHO growth standards versus China growth charts; WHO growth standards: solid bar; China growth reference: empty bar; *p<0.05.
Figure 4.
Comparison of prevalence of underweight for girls under 5-years estimated by the WHO growth standards versus China growth charts; WHO growth standards: solid bar; China growth reference: empty bar; *p<0.05.
The prevalence of severe underweight was significantly higher for boys aged 18, 24, 33 and 42–60 months when estimated by using the China charts than by using the WHO charts. So was the prevalence of severe underweight for girls aged 27 and 45–60 months.
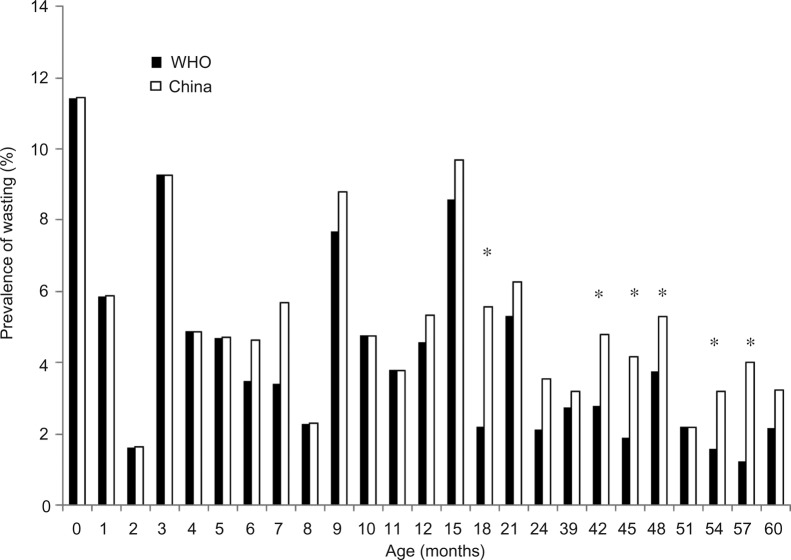
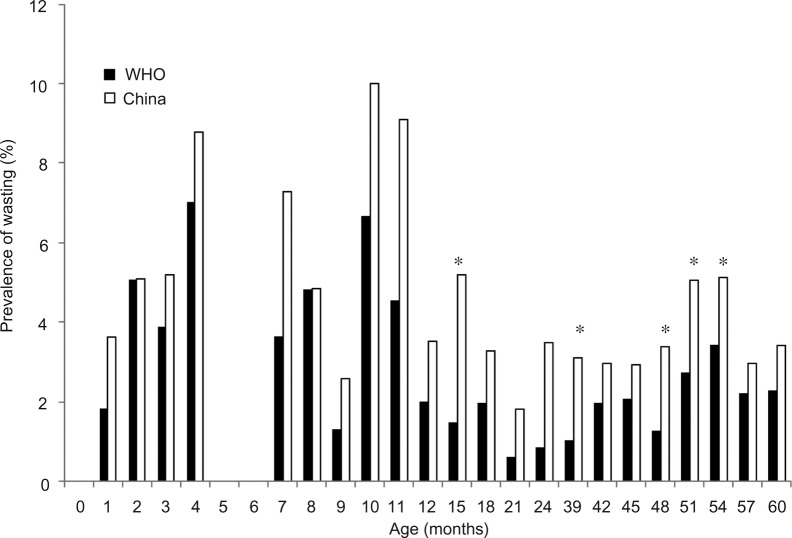
The prevalence of wasting was significantly lower for boys aged 18, 42–48 and 54–57 months and for girls aged 15, 39, 48–54 months when the WHO charts were used (figures 5 and 6). The difference was in the same direction even for other age groups with non-significant differences between the WHO and China charts (figures 5 and 6). Regardless of gender and age group, the prevalence of severe wasting was not significantly different between the two growth charts.
Figure 5.
Comparison of prevalence of wasting for boys under 5-years estimated by the WHO growth standards versus China growth charts; WHO growth standards: solid bar; China growth reference: empty bar; *p<0.05.
Figure 6.
Comparison of prevalence of wasting for girls under 5-years estimated by the WHO growth standards versus China growth charts; WHO growth standards: solid bar; China growth reference: empty bar; *p<0.05.
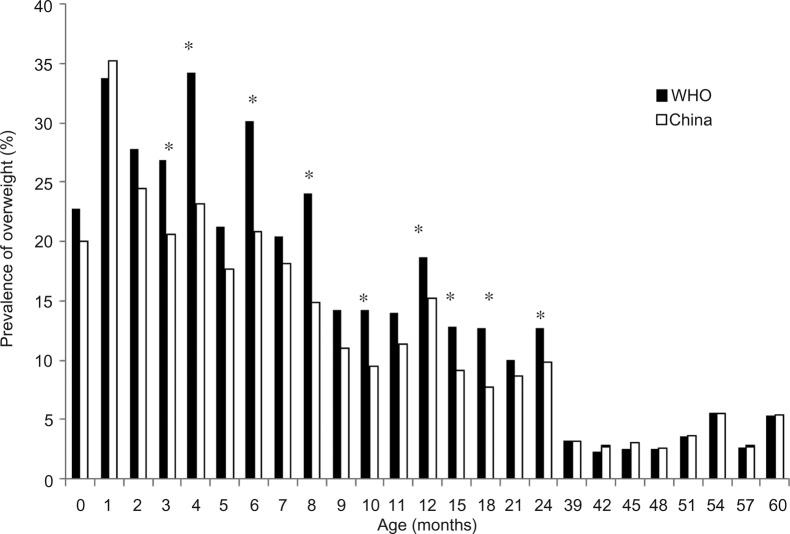
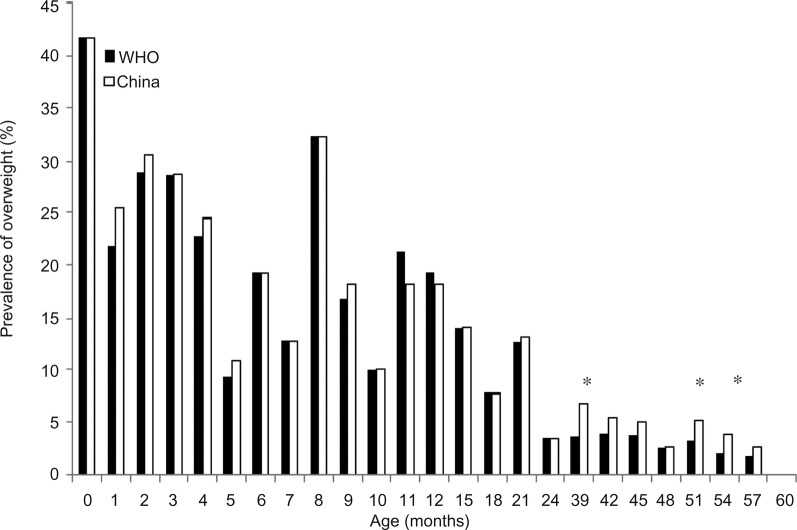
The prevalence of overweight was significantly higher when assessed by using the WHO growth charts than by using the China charts for boys aged 3, 4, 6, 8, 10, 12, 15, 18 and 24 months (figure 7), and it was the opposite for girls aged 39, 51 and 54 months (figure 8). The difference was in the same direction even when it was not significant for other age group boys (figure 7). The prevalence of obesity was similar between the two growth charts except for 0 and 6-month-old boys.
Figure 7.
Comparison of prevalence of overweight for boys under 5 years estimated by the WHO growth standards versus China growth charts; WHO growth standards: solid bar; China growth reference: empty bar; *p<0.05.
Figure 8.
Comparison of prevalence of overweight for girls under 5-years estimated by the WHO growth standards versus China growth charts; WHO growth standards: solid bar; China growth reference: empty bar; *p<0.05.
Based on the estimation from the WHO charts, gender was not associated with the risk of underweight; boys had about 18% greater odds of stunting than girls. Compared to children aged 60 months, children aged 1–3, 5–8, 10, 12, 21 and 36 months had 0.51–0.96 less odds of underweight; children aged 1, 5, 6, 8 and 10 months had 0.41–0.77 less odds of stunting and children aged 15–33 months had 48–174% greater odds.
Discussion
There are some significant differences in assessing all these malnutrition indicators except obesity of Chinese children between these two growth charts. The distinction for the prevalence of underweight could be the most notable and the prevalence of underweight was higher when assessed by using the China growth reference than by using the WHO standards. So was the prevalence of severe underweight. The prevalence of stunting, severe stunting, wasting and severe wasting was significantly higher when assessed by using the China growth reference than by using the WHO growth standards. Higher prevalence of overweight was seen when the WHO growth standards were used.
Our findings are consistent with the results from most studies when comparing local growth charts with the WHO growth standards in estimating the prevalence of underweight. When the WHO weight-for-age curves were compared with the Centers for Disease Control and Prevention (CDC) ones, the median weight was greater for the CDC samples than for the WHO samples except during the first 6 months.10 Overall, the CDC sample children are heavier than the WHO sample children, which implies that the prevalence of underweight (<−2 SD) would be higher when using the CDC charts than when using the WHO charts. This phenomenon held true for comparing the WHO growth standards with the Netherland and Europe growth references.11 12 A study in Argentina also found that the prevalence of underweight with the WHO standards was lower than its own growth references.13 However, a study in Hong Kong found that the centre of weight for age distribution of the breastfed Chinese children was similar to the one of the WHO growth standards reference population.14 The difference in underweight prevalence of these Chinese children between the China growth charts and the WHO growth standards could be due to the sample selection of children: (1) different type of feeding modes in the two standards (breastfeeding is not a criterion for the China growth reference).10 15 According to the National Health Survey 2008 in China, the exclusive breastfeeding rate for 0–6-month-old infants was only 27.6%, which was even lower in urban areas (15.8%); only 37% of children aged 12–15 months continued breastfeeding nationwide and 15.5% of urban children continued breastfeeding. From 2002 to 2008, formula retail value sales increased from 1000 million to about US$3400 dollar in China (Euromonitor International 2009). These indicated that a high percentage of sampled children in the China growth reference were fed with breast milk substitutes (mainly infant formula) from birth until 15 months. It is commonly agreed that breastfed children grow slower than formula-fed children.16 The weight of breastfed children is lower than that of formula-fed children from infancy until adulthood.17 Thus, sampled children might be heavier in the China growth reference than in the WHO growth standards, which was reflected in the lower prevalence of underweight when breastfed-based WHO growth standards were used. (2) Birth weight: Full-term low birth weight was excluded from the China growth charts, but not the WHO growth charts, which could truncate the lower end of weight distribution.
Various studies found that growth charts in different countries differed from the WHO growth standards with regard to height of children. On average, the WHO sample children were taller than the CDC sample children.10 Both Japanese breastfed children and Japanese growth charts children were shorter than the WHO growth standards children.18 The prevalence of stunting (<−2 SD) is expected to be higher when the WHO growth standards are used in these populations. In contrast, the median height of children aged 3–5 years in Poland and Germany was greater than the WHO growth standards.19 The present study found that the prevalence of stunting was greater when the China growth reference was used (ie, the China growth reference of −2 SD cut-offs was higher than that of the WHO standards, especially for children aged 3–5 years). The distinction might be the statistical difference due to the large sample size. Or excluding full-term low birth weight infants might truncate the extreme of the distribution. The study in Hong Kong mentioned above found that height for age distribution of breastfed Chinese children was shifted to the left compared to the WHO growth standards reference population.14 Another study in rural areas in mainland China found that breastfed boys were shorter and breastfed girls were slightly taller than those under the WHO growth standards.20 In urban areas, breastfed Chinese children were taller than those under the WHO growth standards for both boys and girls.21 Thus, it is not simply to attribute the difference to ethnical variation. More precisely speaking, the −2 SD cut-offs from the urban children in the Chinese growth charts could be greater than those under the WHO growth standards, especially for children aged 3–5 years.
Also, as seen in the comparison between the CDC and WHO growth charts, the prevalence of wasting and severe wasting was lower and the prevalence of overweight was higher when based on the WHO growth standards. The large sample size in this study might partially explain these differences. The main difference of overweight was seen for boys under 2 years, which might be related to the difference in the feeding mode (ie, breastfed children in the WHO growth standards vs mixed feeding children in the China growth charts) and gender difference in growth pattern response to the feeding mode. It was interesting to see that the prevalence of obesity was similar between the two growth charts in this study, which indicates that the cut-offs for obesity (>3SD) were similar between them.
Since the WHO growth standards were released, more and more countries have adopted the standards. Countries with 75% of children under 5 years of age worldwide have adopted the WHO growth standards.4 There is no doubt that the WHO growth standards are more representative than the growth references based on one country for global use.15 For example, the WHO growth standards could be used to assess the progress of achieving the Millennium Development Goal globally or other international child growth indicators.22 It was argued that local growth charts might be more suitable for individual growth monitoring.15 The major reason for not adopting the WHO growth standards in most countries is that the local growth reference is more preferable.4 The difference between the WHO growth standards and local growth references might be due to environmental factors, genetic factors and/or epigenetic factors. The WHO Multicentre Growth Reference Study (MGRS) found that the linear growth of children in the six countries was very similar and only 3% of variation was explained by site.23 This phenomenon implied that race difference or genetic factors might not be a key determinant for the difference between the WHO growth standards and local growth references. When compared with the WHO growth standards, the difference between rural breastfed Chinese children, urban breastfed Chinese children and Hong Kong breastfed Chinese children also supported the theory that race might not be a main factor.14 20 21
The limitation of this study is that the information available is not sufficient to address the reasons for the difference between the two growth charts, although it is not the main objective of the study. The back-to-back comparison could give practical suggestions for growth reference selection.
Based on the significant difference of malnutrition prevalence of Chinese children between WHO growth standards and China growth reference, it is well-justified to use WHO growth standards for population malnutrition assessment in China, which could be used for global, national and regional comparison and target achievement. In addition, using the WHO growth standards could promote healthy growth (breastfeeding, no smoking during pregnancy and so on). Future researches are warranted to apply the WHO growth standards in those countries with local growth charts when there are distinct differences between the WHO growth charts and local growth charts including those in China.
Acknowledgments
The authors would like to thank Dr Patrice Armstrong, founder of International Nutrition Consultant Services in Paris, France, for her comments and editing of the manuscript.
Footnotes
Contributors: ZY designed the study, analysed the data and drafted the manuscript. YD assisted in the data analysis and manuscript preparation. GM, XY and SY designed and oversaw the data collection of the China National Nutrition and Health Survey in 2002. SY designed and assisted with the explanation of the results. All authors reviewed the manuscript.
Funding: The original survey was partially funded by the Ministry of Health and Ministry of Science and Technology, China (Grant numbers: 2001DEA30035, 2003DIA6N008).
Competing interests: None.
Ethics approval: Institute of Nutrition and Food Safety, Chinese Center for Disease Control and Prevention.
Provenance and peer review: Not commissioned; externally peer reviewed.
Data sharing statement: Statistical code is available by emailing yang.zhenyuid@gmail.com (ZY).
References
- 1.Black RE, Victora CG, Walker SP et al. . Maternal and child undernutrition and overweight in low-income and middle-income countries. Lancet 2013;382:427–51. 10.1016/S0140-6736(13)60937-X [DOI] [PubMed] [Google Scholar]
- 2.Gibson RS. Principles of nutritional assessment. Oxford University Press, 2005. [Google Scholar]
- 3.Stein AD, Rundle A, Wada N et al. . Associations of gestational exposure to famine with energy balance and macronutrient density of the diet at age 58years differ according to the reference population used. J Nutr 2009;139:1555–61. 10.3945/jn.109.105536 [DOI] [PMC free article] [PubMed] [Google Scholar]
- 4.de Onis M, Onyango A, Borghi E et al. . Worldwide implementation of the WHO Child Growth Standards. Public Health Nutr 2012;15:1603–10. 10.1017/S136898001200105X [DOI] [PubMed] [Google Scholar]
- 5.Centers for Disease Control and Prevention. Growth Charts. http://www.cdc.gov/growthcharts/ (accessed 25 Sep 2013).
- 6.Turck D, Michaelsen KF, Shamir R et al. . World Health Organization 2006 child growth standards and 2007 growth reference charts: a discussion paper by the committee on nutrition of the European Society for Pediatric Gastroenterology, Hepatology, and Nutrition. J Pediatr Gastroenterol Nutr 2013;57:258–64. 10.1097/MPG.0b013e318298003f [DOI] [PubMed] [Google Scholar]
- 7.WHO. Obesity and overweight 2006. http://www.who.int/mediacentre/factsheets/fs311/en/index.html (accessed 12 Jul 2010).
- 8.Corvalan C, Gregory CO, Ramirez-Zea M et al. . Size at birth, infant, early and later childhood growth and adult body composition: a prospective study in a stunted population. Int J Epidemiol 2007;36:550–7. 10.1093/ije/dym010 [DOI] [PubMed] [Google Scholar]
- 9.Li H, Ji CY, Zong XN et al. . [Height and weight standardized growth charts for Chinese children and adolescents aged 0 to 18years]. Zhonghua Er Ke Za Zhi 2009;47:487–92. [PubMed] [Google Scholar]
- 10.Stewart CD, Morris BH, Huseby V et al. . Randomized trial of sterile water by gavage drip in the fluid management of extremely low birth weight infants. J Perinatol 2009;29:26–32. 10.1038/jp.2008.111 [DOI] [PubMed] [Google Scholar]
- 11.Lewis SJ, Leary S, Davey Smith G et al. . Body composition at age 9years, maternal folate intake during pregnancy and methyltetrahydrofolate reductase (MTHFR) C677T genotype. Br J Nutr 2009;102:493–6. 10.1017/S0007114509231746 [DOI] [PubMed] [Google Scholar]
- 12.Victora CG, Sibbritt D, Horta BL et al. . Weight gain in childhood and body composition at 18 years of age in Brazilian males. Acta Paediatr 2007;96:296–300. 10.1111/j.1651-2227.2007.00110.x [DOI] [PMC free article] [PubMed] [Google Scholar]
- 13.Kain J, Corvalan C, Lera L et al. . Accelerated growth in early life and obesity in preschool Chilean children. Obesity (Silver Spring) 2009;17:1603–8. 10.1038/oby.2009.37 [DOI] [PubMed] [Google Scholar]
- 14.Hui LL, Schooling CM, Cowling BJ et al. . Are universal standards for optimal infant growth appropriate? Evidence from a Hong Kong Chinese birth cohort. Arch Dis Child 2008;93:561–5. 10.1136/adc.2007.119826 [DOI] [PubMed] [Google Scholar]
- 15.Gillman MW. Early infancy as a critical period for development of obesity and related conditions. Nestle Nutr Workshop Ser Pediatr Program 2010;65:13–20; discussion 20–14 10.1159/000281141 [DOI] [PMC free article] [PubMed] [Google Scholar]
- 16.Hoddinott P, Tappin D, Wright C. Breast feeding. BMJ 2008;336:881–7. 10.1136/bmj.39521.566296.BE [DOI] [PMC free article] [PubMed] [Google Scholar]
- 17.Oddy WH, Mori TA, Huang RC et al. . Early infant feeding and adiposity risk: from infancy to adulthood. Ann Nutr Metab 2014;64:262–70. 10.1159/000365031 [DOI] [PubMed] [Google Scholar]
- 18.Lucas A. Growth and later health: a general perspective. Nestle Nutr Workshop Ser Pediatr Program 2010;65:1–9; discussion 9–11 10.1159/000281107 [DOI] [PubMed] [Google Scholar]
- 19.Owen CG, Martin RM, Whincup PH et al. . Effect of infant feeding on the risk of obesity across the life course: a quantitative review of published evidence. Pediatrics 2005;115:1367–77. 10.1542/peds.2004-1176 [DOI] [PubMed] [Google Scholar]
- 20.Kramer MS. Breastfeeding, complementary (solid) foods, and long-term risk of obesity. Am J Clin Nutr 2010;91:500–1. 10.3945/ajcn.2010.29199 [DOI] [PubMed] [Google Scholar]
- 21.de Armas MG, Megias SM, Modino SC et al. . [Importance of breastfeeding in the prevalence of metabolic syndrome and degree of childhood obesity]. Endocrinol Nutr 2009;56:400–3. 10.1016/S1575-0922(09)72709-3 [DOI] [PubMed] [Google Scholar]
- 22.Girardet JP, Rieu D, Bocquet A et al. . [Childhood diet and cardiovascular risk factors]. Arch Pediatr 2010;17:51–9. 10.1016/j.arcped.2009.10.012 [DOI] [PubMed] [Google Scholar]
- 23.Bartok CJ, Ventura AK. Mechanisms underlying the association between breastfeeding and obesity. Int J Pediatr Obes 2009;4:196–204. 10.3109/17477160902763309 [DOI] [PubMed] [Google Scholar]


