Abstract
Four different conjugated polymer nanoparticles (CPNs) were used to differentiate structurally similar glycosaminoglycans (GAGs) in a urine simulant. Unique emission response patterns of CPNs were analyzed by linear discriminant analysis (LDA), confirming that structurally diverse CPNs are sensitive and effective at differentiating GAGs in a complex biological medium.
Changes in urinary glycosaminoglycan (GAG) levels can signify proliferation of several diseases including kidney and bladder disorders, polysaccharide storage diseases, and certain cancers.1–4 However, detection or differentiation of GAGs in a biological medium has been challenged by the structural similarity of GAGs and interferences of the concomitant biomolecules commonly present in biological fluids. Conventional GAG detection methods require sample preparation steps followed by complicated instrumental analysis or biochemical assays.5–9 Recently, several researchers have developed conceptually important detection methods on the basis of pattern recognition using nanoparticles, conjugated polyelectrolytes, and liposomes.10–14 In those examples, differentiation of GAGs was demonstrated by using multivariate statistical methods including linear discriminant analysis (LDA). While current sensory systems perform well in a simplified solution (i.e., highly diluted media with buffers), few sensory systems have been reported for sensitive detection of GAGs in complicated biological fluids. Development of simple and sensitive sensory systems of GAGs in biological media is highly important and practical for future disease diagnostics.
Owing to their excellent photophysical properties, conjugated polymers (CPs) have attracted much attention for optical detection of chemicals, metal ions, and biological substances.15–18 Many synthetic and fabrication methods have been developed to increase aqueous compatibility of CPs to achieve necessary sensitivity for specific analytes in aqueous environments.19 Depending on the aqueous solubility of CPs and the nature of interaction between CPs and analytes, structural changes can occur in individual CP chains or multiple chain aggregates, which correspond to changes in CP optical properties.20,21
Previously, we have fabricated positively charged conjugated polymer nanoparticles (CPNs) by treating a non-aqueous soluble, primary amine-containing CP [i.e., poly(p-phenyleneethynylene) (PPE)] with organic acids followed by dialysis.22 The aggregation structures and sizes of CPNs were dependent on the nature of organic acid treatment. Furthermore, we found that CPNs fabricated with a semi-flexible CP [i.e., a flexible linker containing poly(p-phenylenebutadiynylene) (PPB)] exhibited backbone reorganization to maximize hydrophobic chain interaction when treated with an anionic linear polysaccharide, hyaluronic acid (HA).23,24 The structural reorganization of CPNs was evident by photophysical changes including a new sharp absorption peak at longer wavelength and decreased fluorescence intensity. The physical change was observed as an elongated particle shape shown in atomic force microscopic images.
From these observations, we hypothesized that the aggregation status of cationic CPNs will be different upon interaction with GAGs due to the differences in ionic strength of the GAGs exhibiting different degrees of acetylation and sulfonation in the repeating disaccharide units [see Electronic Supporting Information (ESI) for chemical structures of GAGs]. While the hydrophobic interaction among non-aqueous soluble CPs provides the structural integrity of CPNs in a biological medium, the loosely aggregated CPNs will undergo backbone reorganization under polyelectrolyte interactions with GAGs. Depending on the strength of ionic interactions, the aggregation properties of CPNs will change accordingly, resulting in measurable spectral changes.
In this report, we use four different CPNs that act as both an analyte receptor and a signal transducer, and analyze their differential responses to each GAG in a urine simulant. A systematic investigation of the aggregation properties of CPNs that vary by side chain amine density, backbone flexibility, and type of backbone structure in response to GAGs was conducted by monitoring changes in absorption/emission profiles and size/size distributions. Finally, entire spectral responses of the structurally diverse CPNs were analyzed by LDA to differentiate structurally similar GAGs at a physiologically relevant concentration25 in a urine simulant. We found that side chain and backbone flexibility strongly affects both the physical and photophysical properties of CPN/GAG complexes. A clear differentiation of recognition patterns was observed in a LDA plot, supporting that structurally diverse CPNs are effective at differentiating GAGs in a complex biological medium.
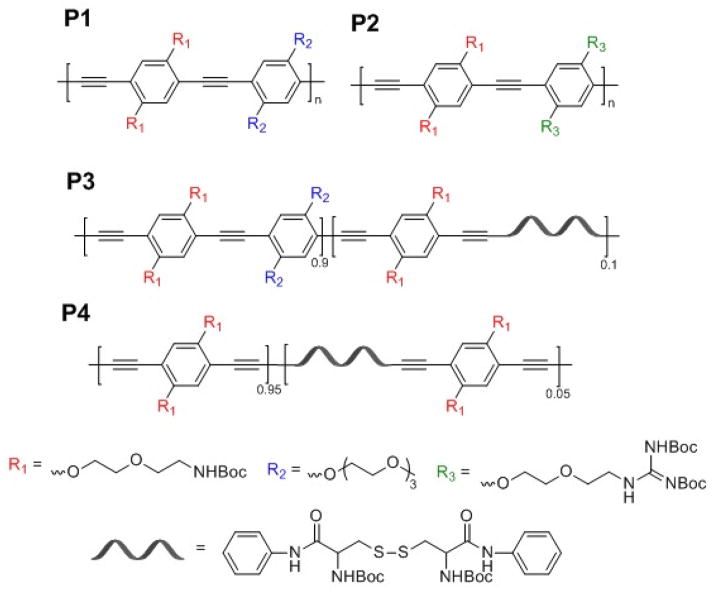
We used four CPs having different side chain and backbone structures (Fig. 1) to obtain an array of CPNs with different aggregation natures. Compared to P1, which contains a short ethylene oxide (EO) and protonated primary amine after removal of N-tert-butoxycarbonyl (Boc) group per repeating unit, the side chains of P2 have a higher amine density by replacing the EO side chain with a guanidinium group. P3 was designed to increase backbone flexibility by introducing a non-conjugated, flexible moiety in the conjugated phenyleneethynylene (PE) backbone, while maintaining the fluorescent nature and the side chain functionality of P1. Lastly, P4 was used because the flexible phenylenebutadiynylene (PB) backbone induces higher backbone aggregation than the structurally similar PE analogues.
FIG. 1.
Chemical structures of CPs with different side chains (P1 and P2), PPE with flexible backbone (P3), and PPB with flexible backbone (P4).
The cationic CPNs were fabricated using our previously published method,23 in which the corresponding P1-P4 were treated with trifluoroacetic and acetic acid followed by dialysis. The resulting nanoparticles in water were homogeneous yellow solutions, and the key characteristic properties are summarized in Table 1.
TABLE 1.
Key photophysical and physical properties of CPNs.
| CPN | CP | Mna (kDa) | λmax, absb (nm) | λmax, emc (nm) | Hydrodynamic diameterd (nm) | Zeta potentiale (mV) |
|---|---|---|---|---|---|---|
| 1 | P1 | 17,457 | 417 | 482 | 140 ± 0.9 | + 40 ± 1.3 |
| 2 | P2 | 14,079 | 411 | 479 | 179 ± 6.3 | + 54 ± 3.1 |
| 3 | P3 | 14,489 | 422 | 464 | 117 ± 10.1 | + 48 ± 2.9 |
| 4 | P4 | 35,907 | 444 | 466 | 134 ± 8.1 | + 30 ± 1.7 |
Determined by gel permeation chromatography in tetrahydrofuran (THF) relative to polystyrene standard.
Measured in water.
Excited at 400 nm.
Measured by single particle tracking analysis at 25°C in water. Mean values ± standard deviation.
Electrophoretic measurement in water at pH 7. Mean value ± standard deviation.
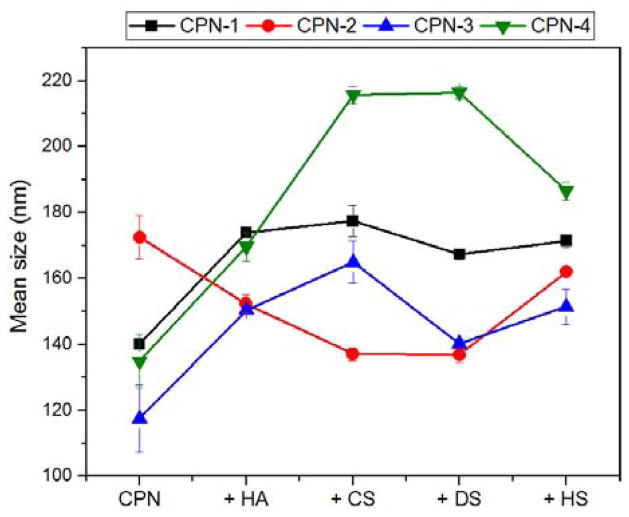
The hydrodynamic diameters of CPNs were measured using nanoparticle tracking analysis (NTA), which tracks the Brownian motion of each particle to accurately calculate the hydrodynamic diameter of particles with size distributions.26 The hydrodynamic diameters of CPNs ranged from ~120 to ~180 nm in water. The relatively larger diameter of CPN-2 can be attributed to the hydrophilic nature of side chains, which form aggregates of more solvated chains. Upon complexation, diameters of CPNs changed as aggregation properties of CPNs were affected by GAGs with different ionic strengths. As shown in Fig. 2, CPN-2 showed decreased sizes upon complexation, while the rest of the CPNs exhibited increased sizes. The loosely aggregated, more solvated P2 chains are believed to form compact and smaller complexes with GAGs (see ESI for detailed NTA data). Increased sizes observed from the rest of the CPNs were likely due to the formation of hydrophilic GAG shells on CPNs. Among them, CPN-4 showed the largest diameter increase, confirming that the ionic interaction induces further CP chain aggregation due to the nature of PPB backbone with flexibility.
FIG. 2.
Average hydrodynamic diameters of CPN-1 (black square), CPN-2 (red circle), CPN-3 (blue triangle point up), and CPN-4 (green triangle point down) upon complexation with hyaluronic acid (HA), chondroitin sulfate (CS), dermatan sulfate (DS), and heparin sulfate (HS), respectively, measured by NTA in triplicate.
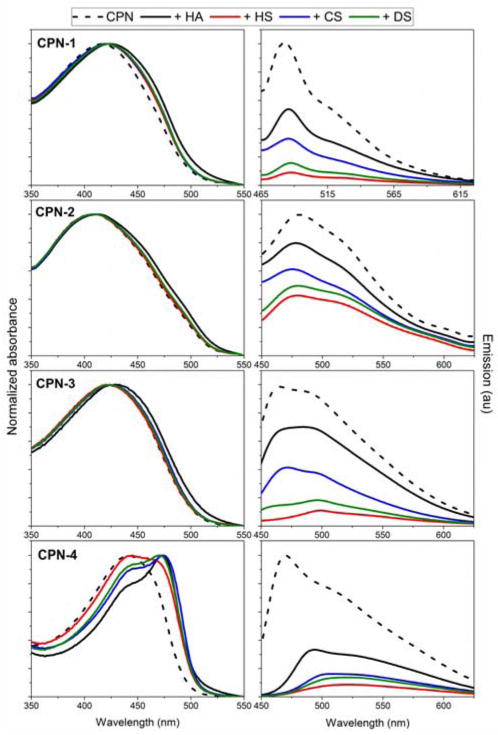
The absorption and fluorescent profiles support the NTA data. GAGs induce changes in the aggregation structures as evidenced by red shifts in absorption and decreased fluorescent intensity in emission spectra for all CPNs (Fig. 3). As expected, CPN-4 displayed dramatic changes in both absorption and emission profiles due to extensive chain reorganization. CPN-3, which also has flexible linkers along the PPE backbone, displayed relatively small changes in the absorption, implying that the chemical backbone structure of the CP is an important contributor for chain reorganization. The structurally similar GAGs also interact differently with CPNs with structural diversity. The carboxylated HA induced higher absorption shifts compared to the sulfonated GAGs, although the effects were somewhat minimal, with the exception of CPN-4. Due to the relatively weak ionic strength of carboxylic acid, compared to sulfonic acid, HA is believed to form outer shell layers by contributing to increase π-π interaction among CPs. Meanwhile, GAGs with sulfonic acids interact strongly with CPs, especially with CP chains of low molecular weights, resulting in more solvated random complexes. As expected, the emission profiles of all CPNs were unique and different upon complexation with GAGs; These spectral changes can then be used for differentiation of GAGs. Hierarchical cluster analysis (HCA) of emission profiles show that the sulfonated GAGs cluster together, indicating that there is differentiation based on functional group (ESI). The most structurally similar chondroitin sulfate (CS) and dermatan sulfate (DS) form the closest cluster, and the most structurally different hyaluronic acid (HA) and heparin sulfate (HS) form the furthest cluster.
FIG. 3.
Effect of GAG complexation on absorption (left column) and emission (right column) for CPN-1 (first row), CPN-2 (second row), CPN-3 (third row), and CPN-4 (fourth row) in water. Optical density of CPNs was fixed at 0.1.
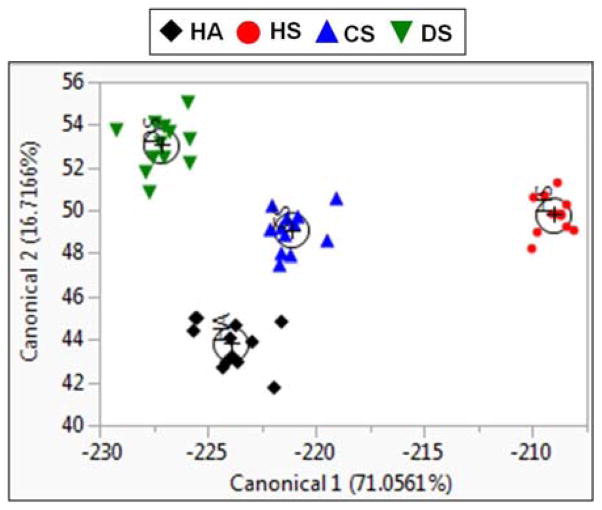
The differentiation ability of CPNs in a complex aqueous medium was verified using LDA of fluorescence spectral responses of CPNs to GAGs. This method can be used to establish a pattern for a “chemical nose” type array sensor,27 which relies on a differential response of the receptor (i.e., CPN) to the analyte (i.e., GAG). After adding CPNs to the GAG solution (100 nM) in a commercially available urine simulant, emission spectra (ESI) of complexes were recorded and used for LDA. The ratios of fluorescent intensity were analysed using the statistical software JMP® (version 11). The LDA plot depicting the first two canonicals is shown in Fig. 4. A summary of canonical scores can be found in the ESI. There is a clear separation among the GAGs, with no overlap of groups with a 95% confidence limit. Three canonical correlations account for 71.1, 16.7, and 12.2% of the variation, occupying 100% of the total variation between the groups, indicating that GAG differentiation is maximized. Traditional discriminant functions correctly predict 100% of group classification, based on their squared distances to each group centroid (ESI). These results confirm that loosely aggregated CPNs can undergo structural reorganization in the presence of strong polyelectrolytes in a complex biological medium. Owing to the structural integrity of the hydrophobic CP backbone and the ratiometric measurements before and after polyelectrolytes complexation in a complex medium, potential environmental interferences minimally influenced the differentiation of GAGs.
FIG. 4.
An LDA plot between two largest canonical correlations of emission intensity ratios of CPNs with and without GAGs (100 nM) in a urine simulant. HA in black, HS in red, CS in blue, and DS in green, with (+) marking the centroid of each group.
Conclusions
In summary, we report a systematic investigation on the aggregation properties of CPNs that vary by side chain and backbone structures in response to GAGs by observing changes in absorption/emission profiles and complex size/size distributions. This investigation demonstrated that side chain and backbone flexibility strongly affect the photophysical and physical properties of CPN/GAG complex. We analyzed the four CPNs and their differential responses to each GAG using the LDA method to demonstrate that structurally diverse CPNs differentiate GAGs in a complex biological medium. The structure-function relationships obtained from this work will lead to further improvements in designing functional polymers for sensing biological and biomedical substances.
Supplementary Material
Acknowledgments
This work was conducted under generous support from NIH (GM092778) and NSF (DMR1352317).
Footnotes
Electronic Supplementary Information (ESI) available: Detailed synthetic procedures, characterzations, mutivariate analyses. See DOI: 10.1039/b000000x/
References
- 1.Lokeshwar V, Selzer M, Unwala D, Estrella V, Gomez M, Golshani RR, Kester R, Klumpp D, Gousse A. J Urol. 2006;176:1001–1007. doi: 10.1016/j.juro.2006.04.012. [DOI] [PubMed] [Google Scholar]
- 2.Nabih E, Sayed M. Egyptian Journal of Chest Diseases and Tuberculosis. 2013;62:343–348. doi: 10.1016/j.ejcdt.2013.07.017. [DOI] [PMC free article] [PubMed] [Google Scholar]
- 3.Soler R, Brushini H, Truzzi J, Martins J, Camara N, Alves M, Leit K, Nader H, Srougi M, Ortiz V. Int Braz J Urol. 2008;34:503–511. doi: 10.1590/s1677-55382008000400013. [DOI] [PubMed] [Google Scholar]
- 4.Yip G, Smollich M, Gotte M. Mol Cancer Ther. 2008;5:2139–2148. doi: 10.1158/1535-7163.MCT-06-0082. [DOI] [PubMed] [Google Scholar]
- 5.Kalita M, Balivada S, Swarup VP, Mencio C, Raman K, Desai UR, Troyer D, Kuberan B. J Am Chem Soc. 2014;136:554–7. doi: 10.1021/ja409170z. [DOI] [PubMed] [Google Scholar]
- 6.Volpi N, Maccari F, Linhardt R. J Anal Biochem. 2009;388:140–145. doi: 10.1016/j.ab.2009.02.012. [DOI] [PMC free article] [PubMed] [Google Scholar]
- 7.Langeslay DJ, Beecher CN, Naggi A, Guerrini M, Torri G, Larive CK. Anal Chem. 2013;85:1247–1255. doi: 10.1021/ac3032788. [DOI] [PMC free article] [PubMed] [Google Scholar]
- 8.Spencer J, Kauffman J, Reepmeyer J, Gryniewicz C, Ye W, Toler D, Buhse L, Westenberger B. J Pharm Sci. 2009;98:3540–3547. doi: 10.1002/jps.21660. [DOI] [PubMed] [Google Scholar]
- 9.Wu H, Saez C, Campana M, Megehee E, Wang E. Anal Chim Acta. 2013;804:221–227. doi: 10.1016/j.aca.2013.10.028. [DOI] [PubMed] [Google Scholar]
- 10.Elci S, Moyano D, Rana S, Tonga G, Phillips R, Bunz UHF, Rotello V. Chem Sci. 2013;4:2076–2080. [Google Scholar]
- 11.Nyren-Erickson E, Haldar M, Gu Y, Qian S, Friesner D, Mallik S. Anal Chem. 2011;83:5989–95. doi: 10.1021/ac2009993. [DOI] [PMC free article] [PubMed] [Google Scholar]
- 12.Jagt RB, Gomez-Biagi RF, Nitz M. Angew Chemie. 2009;48:1995–7. doi: 10.1002/anie.200805238. [DOI] [PubMed] [Google Scholar]
- 13.Muller-Graff P, Szelke H, Severin K, Kramer R. Org Biomol Chem. 2010;8:2327–31. doi: 10.1039/c000420k. [DOI] [PubMed] [Google Scholar]
- 14.Moyano DF, Rotello VM. Langmuir. 2011;27(17):10376–85. doi: 10.1021/la2004535. [DOI] [PMC free article] [PubMed] [Google Scholar]
- 15.Pinto MR, Schanze KS. Proc Natl Acad Sci USA. 2004;101:7505–7510. doi: 10.1073/pnas.0402280101. [DOI] [PMC free article] [PubMed] [Google Scholar]
- 16.Gaylord BS, Heeger AJ, Bazan G. Proc Natl Acad Sci USA. 2002;99:10954–10957. doi: 10.1073/pnas.162375999. [DOI] [PMC free article] [PubMed] [Google Scholar]
- 17.Nelson T, O’Sullivan C, Greene N, Maynor M, Lavigne J. J Am Chem Soc. 2006;128:5640–5641. doi: 10.1021/ja060589n. [DOI] [PubMed] [Google Scholar]
- 18.Wang LH, Pu KY, Li J, Qi XY, Li H, Zhang H, Fan CH, Liu B. Adv Mater. 2011;23:4386–4391. doi: 10.1002/adma.201102227. [DOI] [PubMed] [Google Scholar]
- 19.Pecher J, Mecking S. Chem Rev. 2010;110:6260–6279. doi: 10.1021/cr100132y. [DOI] [PubMed] [Google Scholar]
- 20.Thomas SW, Joly GD, Swager TM. Chem Rev. 2007;107:1339–1386. doi: 10.1021/cr0501339. [DOI] [PubMed] [Google Scholar]
- 21.Zhu CL, Liu LB, Yang Q, Lv FT, Wang S. Chem Rev. 2012;112:4687–4735. doi: 10.1021/cr200263w. [DOI] [PubMed] [Google Scholar]
- 22.Ko YJ, Mendez E, Moon JH. Macromolecules. 2011;44:5527–5530. doi: 10.1021/ma200661h. [DOI] [PMC free article] [PubMed] [Google Scholar]
- 23.Vokatá T, Moon JH. Macromolecules. 2013;46:1253–1259. doi: 10.1021/ma3019975. [DOI] [PMC free article] [PubMed] [Google Scholar]
- 24.Twomey M, Na Y, Roche Z, Mendez E, Panday N, He J, Moon JH. Macromoleules. 2013;46:6374–6378. doi: 10.1021/ma400996y. [DOI] [PMC free article] [PubMed] [Google Scholar]
- 25.To estimate GAG concentration levels in urine, we approximated molar concentrations based on previously reported concentration of total uronic acid excreted from normal (i.e, healthy) subjects. The value for normal subjects was reported as ~ 8 mg/L (total uronic acid in mg per liter of urine) (see Michelacci Y, Glashan R, Schor N. Kidney Int. 1989;36:1022–1028. doi: 10.1038/ki.1989.296. We converted to molarity based on the repeating unit of HS (MW = ~ 665 g/mol), resulting in a value of ~ 10 μM. HS was chosen because it has the highest repeating unit, therefore, resulting in the lowest concentration upon conversion. To demonstrate sensitivity of our system in a biological medium, we performed LDA at a concentration 100 times below (100 nM) the reported value for all GAGs.
- 26.Filipe V, Hawe A, Jiskoot W. Pharm Res. 2010;27:796–81. doi: 10.1007/s11095-010-0073-2. [DOI] [PMC free article] [PubMed] [Google Scholar]
- 27.You CC, Miranda OR, Gider B, Ghosh PS, Kim IB, Erdogan B, Krovi SA, Bunz UHF, Rotello VM. Nat Nanotechnol. 2007;2:318–323. doi: 10.1038/nnano.2007.99. [DOI] [PubMed] [Google Scholar]
Associated Data
This section collects any data citations, data availability statements, or supplementary materials included in this article.


