

Abstract
Aims
Two single-dose studies were conducted in Japan and Europe to compare the pharmacokinetic (PK) and pharmacodynamic (PD) profiles of new insulin glargine 300 U/ml (Gla-300) and insulin glargine 100 U/ml (Gla-100) in people with type 1 diabetes mellitus.
Methods
In two double-blind, randomized, crossover studies, 18 Japanese participants (aged 20–65 years) and 24 European participants (aged 18–65 years) with glycated haemoglobin levels ≤9.0% (≤75 mmol/mol) received single subcutaneous doses of Gla-300, 0.4, 0.6 and 0.9 U/kg (0.9 U/kg in the European study only), and Gla-100, 0.4 U/kg. A 36-h euglycaemic clamp procedure was performed after each dosing.
Results
The serum insulin glargine concentration (INS) and glucose infusion rate (GIR) developed more gradually into more constant and prolonged profiles with Gla-300 than with Gla-100. In support of this, the times to 50% of glargine exposure and insulin activity were longer for all Gla-300 doses than for Gla-100 during the 36-h clamp period, indicating a more evenly distributed exposure and metabolic effect beyond 24 h. Exposure to insulin glargine and glucose utilization were lower with the 0.4 and 0.6 U/ml Gla-300 doses in both studies compared with the 0.4 U/ml Gla-100 dose. Glucose-lowering activity was detected for up to 36 h with all doses of Gla-300.
Conclusions
Single-dose injections of Gla-300 present more constant and prolonged PK and PD profiles compared with Gla-100, maintaining blood glucose control for up to 36 h in euglycaemic clamp settings in Japanese and European participants with type 1 diabetes.
Keywords: insulin analogues, pharmacodynamics, pharmacokinetics, type 1 diabetes
Introduction
The approval and use of insulin glargine 100 U/ml (Gla-100) in Europe since 2000 and in Japan since 2003 has established basal insulin supplementation as a reliable treatment option for people with diabetes who require insulin. Gla-100 provides effective glycaemic control in people with diabetes, and has been shown to reduce the incidence of severe hypoglycaemia and nocturnal hypoglycaemia compared with neutral protamine Hagedorn in both Japanese and European people [1,2]. Nevertheless, there are opportunities to further improve management of diabetes with the development of new insulin analogue products that ensure that glycaemic goals are met whilst further minimizing the risk of hypoglycaemia, and by providing flexibility in the timing of injection intervals for basal insulin. A new insulin glargine product comprising 300 U/ml has been developed and this provides consistent activity and a prolonged duration of action, and may contribute to such an improvement in diabetes management. Like Gla-100, insulin glargine 300 U/ml (Gla-300) uses subcutaneous precipitation as a retarding principle. It is hypothesized that the redissolution rate of the subcutaneous depot of Gla-300 is reduced, which may result in the more constant and prolonged pharmacokinetic (PK) and pharmacodynamic (PD) profiles, with longer blood glucose control, compared with Gla-100.
To confirm the potential advantageous differences in the PK and PD profiles of Gla-300 compared with Gla-100, euglycaemic clamp studies investigating both single doses and multiple doses of Gla-300 and Gla-100 have been performed in people with type 1 diabetes mellitus [3,4]. Two single-dose euglycaemic clamp studies conducted in Japanese (clinical trials no. NCT01493115) and European populations (clinical trials no. NCT01195454) to determine the PK and PD profiles of Gla-300 in comparison with Gla-100 are discussed in the present study.
Materials and Methods
Good Clinical Practice
Both studies were performed in compliance with Good Clinical Practice, the Helsinki Declaration and local regulations. The protocols were approved by the responsible ethical review boards and all participants provided written informed consent.
Participants
The first study enrolled Japanese men and women aged 20–65 years with type 1 diabetes for ≥1 year, as defined by the Japan Diabetes Society [5]. The second study enrolled European men and women aged 18–65 years with type 1 diabetes for ≥1 year, as defined by the American Diabetes Association [6]. In both studies, the inclusion criteria included a stable insulin regimen for ≥2 months, total insulin dose <1.2 U/kg/day, body mass index (BMI) 18–30 kg/m2, fasting negative serum C-peptide concentration of <0.3 nmol/l and glycated haemoglobin (HbA1c) level of ≤8.6% (≤70 mmol/mol; Japan Diabetes Society criteria), which is equivalent to the ≤9.0% (≤75 mmol/mol) criterion in the European study according to the National Glycohemoglobin Standardization Program [7]. Key exclusion criteria included any history or presence of another clinically relevant disease.
Study Design and Treatment
The Japanese study was a single-centre, randomized, double-blind, three-treatment, three-period, three-sequence, crossover study. Participants were randomized to one of the three treatment sequences to receive single subcutaneous doses of Gla-300, 0.4 and 0.6 U/kg, and Gla-100, 0.4 U/kg, with a 6–20-day washout period between consecutive treatment periods (Figure 1A).
Figure 1.

Designs of the (A) Japanese and (B) European studies. (A) Day (D); D-1, evening before D1 visit and insulin glargine 300 U/ml (Gla-300) or insulin glargine 100 U/ml (Gla-100) administration; D1, Gla-100 0.4 U/kg, Gla-300 0.4 U/kg or Gla-300 0.6 U/kg administered at approximately 10:00 h (14:00 h at latest) after adjustment for blood glucose during preclamp; D2, end of clamp. The study comprised three treatments (Gla-100 0.4 U/kg, Gla-300 0.4 U/kg and Gla-300 0.6 U/kg), three treatment periods (periods 1–3) and three sequences. (B) D1, Gla-100 0.4 U/kg, Gla-300 0.4 U/kg, Gla-300 0.6 U/kg or Gla-300 0.9 U/kg administered at approximately 09:00 h (14:00 h at latest) after adjustment for blood glucose during preclamp. The clamp was maintained for 36 h after dosing. The study comprised four treatments (Gla-100 0.4 U/kg, Gla-300 0.4 U/kg, Gla-300 0.6 U/kg and Gla-300 0.9 U/kg), four treatment periods (periods 1–4) and four sequences.
The European study was a single-centre, randomized, double-blind, four-treatment, four-period, four-sequence crossover study evaluating single subcutaneous doses of Gla-300, 0.4, 0.6 and 0.9 U/kg, and of Gla-100, 0.4 U/kg, with a 5–18-day washout period between consecutive treatment periods (Figure 1B). In both studies, insulin was administered at a peri-umbilical site of the abdomen, under fasting conditions.
Assessments
During each treatment period, a euglycaemic clamp procedure was performed using the STG-22 glycaemic control device (Nikkiso Co., Ltd, Toyko, Japan: Japanese study) or the Biostator™ device (MTB Medizintechnik, Amstetten, Germany: European study). Participants in both studies were switched from their current insulin regimen in a stepwise manner as predefined. In the Japanese study, participants were connected to the device after an overnight fast (≥10 h), approximately 2 h before dosing. In the European study, participants were connected to the Biostator device approximately 5 h before dosing. Blood glucose levels were adjusted within a preclamp target of 4.4–6.6 mmol/l (80–120 mg/dl) and maintained by intravenous infusions of insulin glulisine and glucose. When the blood glucose level had been stable within a range of 5.5 mmol/l (100 mg/dl) ±20% (euglycaemic clamp level) for at least 1 h without any glucose infusion, the insulin glulisine infusion was discontinued immediately before the administration of Gla-300 or Gla-100. The target blood glucose level of 5.5 mmol/l (100 mg/dl) was maintained for a clamp duration of 36 h; rescue insulin (e.g. insulin glulisine) was given if blood glucose increased to >13.9 mmol/l (>250 mg/dl) or >11.1 mmol/l (>200 mg/dl) for 30 min in the Japanese and European studies, respectively. Blood samples to assess insulin glargine concentration (INS) were collected at time 0 (pre-dose) and at 1, 2, 4, 6, 8, 12, 16, 20, 24, 28, 32 and 36 h after glargine administration. Serum INS was determined using a validated radioimmunoassay with a lower limit of quantification (LLOQ) of 30 pmol/l (5.02 µU/ml). Because of the assay limitation of cross-reactivity to other insulins, concentrations for insulin glargine within the clamp period were only used up to the application of intravenous rescue insulin and were to be set to zero thereafter. In addition to quantification of INS with the radioimmunoassay, which allowed combined measurement of glargine (parent drug) and its active metabolites, 21A-Gly-human insulin (metabolite 1) and 21A-Gly-des-30B-Thr-human insulin (metabolite 2), the Japanese study also determined the plasma concentration of insulin glargine and metabolites separately using a validated liquid chromatography coupled to tandem mass spectrometry with a LLOQ of 30 pmol/l (5.02 µU/ml).
The PK endpoints in both studies were area under the INS time curve from time 0 to 24 and 36 h after dosing (INS-AUC0–24/36), time to 50% of INS-AUC0–36 (T50%-INS-AUC0–36), maximum INS (INS-Cmax), and time to INS-Cmax(INS-Tmax).
In both studies, the PD endpoints were insulin activity [area under the body-weight-standardized glucose infusion rate (GIR) time curve from time 0 to 36 h (GIR-AUC0–36)], time to 50% of GIR-AUC0–36 (T50%-GIR-AUC0–36), and duration of blood glucose control within predefined margins [time from dosing to the last value of the smoothed blood glucose concentration curve at or below 110, 130 and 150 mg/dl (6.1, 7.2 and 8.3 mmol/l)]. Maximum locally weighted regression in smoothing scatterplots (LOESS) smoothed body-weight-standardized GIR (GIRmax) and time to GIRmax (GIR-Tmax) were ancillary measured variables. The European study also included area under the body-weight-standardized GIR time curve from time 0 to 24 h (GIR-AUC0–24).
Safety assessments were performed in all participants exposed to at least one dose of study treatment, and included adverse events, electrocardiogram variables, vital signs, clinical laboratory measurements, anti-insulin antibodies and local tolerability. Adverse events were assessed for severity and possible relationship to study medication.
Statistical Analysis
Analyses included graphical presentations of PK and PD profiles; PK and PD variables were listed by treatment using descriptive statistics. For descriptive statistical analysis, insulin serum concentrations of pre-dose samples and serum concentrations below the LLOQ of samples post dose were set to zero.
A linear mixed-effects model on log-transformed data was applied to estimate pairwise treatment ratios for AUCs, INS-Cmax and GIRmax. Treatment effects of Gla-300 versus Gla-100 were considered significant where the p values were <0.05.
Exact Hodges-Lehmann estimators with 90% confidence interval for the treatment shift in locations were applied to explore time-related variables (T50%-AUC0–36 and INS-Tmax). The treatment effects of Gla-300 versus Gla-100 were considered significant if the p values were <0.10. Because of the explorative nature of the assessment, no adjustment for multiple testing was applied.
Participants with at least one sample value >LLOQ were included for PK analysis. For participants receiving intravenous rescue insulin after dosing during the clamp procedure, samples were set to zero for the remaining corresponding period. Mean calculations and their associated statistics were to be generated from unrounded numbers and presented in gravimetric units (µU/ml). An insulin conversion factor of 1 µU/ml = 6 pmol/l.
The GIR-AUC0–24 and GIR-AUC0–36 values were calculated according to the trapezoidal rule. A locally weighted smoothing scatterplot technique (SAS®, PROC LOESS) was used with a smoothing factor of 0.06 to estimate secondary GIR (GIRmax and GIR-Tmax) and blood glucose (time of blood glucose control within predefined margins) variables. Smoothing was also applied for the visualization of GIR and blood glucose profiles.
Results
Participants
In the Japanese study, a total of 18 participants (16 men and 2 women) with type 1 diabetes at a mean [standard deviation (s.d.)] age of 34.8 (11.5) years and a mean (s.d.) BMI of 22.42 (2.10) kg/m2 were randomized; all participants completed the study. In the European study, a total of 24 participants (5 women and 19 men) with type 1 diabetes [mean (s.d.) age 42.6 (10.0) years; mean (s.d.) BMI 25.6 (2.0) kg/m2) were randomized. Two subjects terminated their participation prematurely for personal reasons, resulting in 22 subjects constituting the PK and PD population.
Pharmacokinetics
The PK variables and INS profiles of Gla-300 and Gla-100 after a single dose are shown in Figure 2A and Table 1A for the Japanese study, and in Figure 3A and Table 1B for the European study. Gla-100 and Gla-300 were found to have different PK profiles regardless of dose and ethnicity of the participant. The median INS time profiles of Gla-300 were without pronounced maxima for all Gla-300 doses, with Gla-300 INS profiles increasing with increasing dose. Gla-100 showed a more distinct rise in concentration, reaching a maximum at 12 h and declining thereafter. The maximum concentration (INS-Cmax) and insulin glargine exposure over 24 h after injection (INS-AUC0–24) were higher for Gla-100 than for all doses of Gla-300. Exposure (INS-AUC0–36) was only higher with Gla-300 0.9 U/kg (dose used in European participants only) than with Gla-100 over 36 h after injection. Time to INS-Cmax (INS-Tmax) and time to 50% of glargine exposure over the whole clamp period (T50%-INS-AUC0–36) were longer for all Gla-300 doses than for Gla-100 in both studies. The median serum INS was detectable up to 32 and 36 h post dosing with Gla-300 0.6 U/kg (in European and Japanese participants, respectively) and also up to 36 h post-dosing with Gla-300 0.9 U/kg (European participants only).
Figure 2.

Serum insulin glargine concentration (INS), glucose infusion rate (GIR) and blood glucose profiles after a single dose in the Japanese study. (A) Median INS profiles (linear scale) with lower limit of quantification (LLOQ) of 5.02 µU/ml; (B) mean smoothed [locally weighted regression in smoothing scatterplots (LOESS) factor 0.15] 36-h body-weight-standardized GIR profiles; (C) mean smoothed (LOESS factor 0.15) 36-h blood glucose profiles.
Table 1.
Pharmacokinetic characteristics after a single dose in (A) the Japanese and (B) the European study
| (A) | Gla-100 0.4 U/kg | Gla-300 0.4 U/kg | Gla-300 0.6 U/kg |
|---|---|---|---|
| Number | 18 | 15* | 18 |
| Mean ± s.d. INS-Cmax, µU/ml | 17.3 ± 4.8 | 10.9 ± 3.4† | 13.8 ± 7.1† |
| Mean ± s.d. INS-AUC0–24, µU·h/ml | 303 ± 79 | 190 ± 67† | 232 ± 123† |
| Mean ± s.d. INS-AUC0–36, µU·h/ml | 370 ± 101 | 251 ± 92† | 326 ± 156† |
| Median (interquartile range) T50%-INS-AUC0–36, h | 14 (12–15) | 17 (13–19)‡ | 18 (16–18)‡ |
| Median (interquartile range) INS-Tmax, h | 8 (2–12) | 16 (12–16)‡ | 14 (8–16)‡ |
| (B) | Gla-1000.4 U/kg | Gla-3000.4 U/kg | Gla-3000.6 U/kg | Gla-3000.9 U/kg |
|---|---|---|---|---|
| Number | 22 | 15§ | 20¶ | 22 |
| Mean ± s.d. INS-Cmax, µU/ml | 15.3 ± 6.0 | 8.9 ± 2.9† | 9.3 ± 2.8† | 13.0 ± 6.2 |
| Mean ± s.d. INS-AUC0–24, µU·h/ml | 266 ± 92 | 148 ± 64† | 149 ± 76† | 222 ± 98 |
| Mean ± s.d. INS-AUC0–36, µU·h/ml | 318 ± 109 | 195 ± 89† | 206 ± 105† | 327 ± 139 |
| Median (interquartile range) T50%-INS-AUC0-36, h | 13 (12–15) | 15 (12–19)‡ | 17 (14–20)‡ | 19 (17–19)‡ |
| Median (interquartile range) INS-Tmax, h | 12 (8–12) | 12 (8–14) | 12 (12–18)‡ | 16 (12–20)‡ |
Gla-100, insulin glargine 100 U/ml; Gla-300, insulin glargine 300 U/ml; INS, insulin glargine concentration; INS-Cmax, maximum serum insulin concentration; INS-AUC0–24/36, area under the concentration versus time curve from time 0 to 24 or 36 h; INS-Tmax, time to INS-Cmax; T50%-INS-AUC0–36, time to 50% of INS-AUC0–36; s.d., standard deviation; LLOQ, lower limit of quantification.
Note: Normality assumptions were not always met, limiting interpretability of p values for certain cases.
Three of 18 participants on rescue insulin were excluded from the analysis.
Statistically significantly different from insulin glargine 100 U/ml 0.4 U/kg: concluded if p value <0.05.
Statistically significantly different from insulin glargine 100 U/ml 0.4 U/kg: for T50%-INS-AUC0–36 and INS-Tmax, concluded if p value < 0.1.
Seven of 22 participants with INS < LLOQ.
Two of 22 participants with INS < LLOQ.
Figure 3.
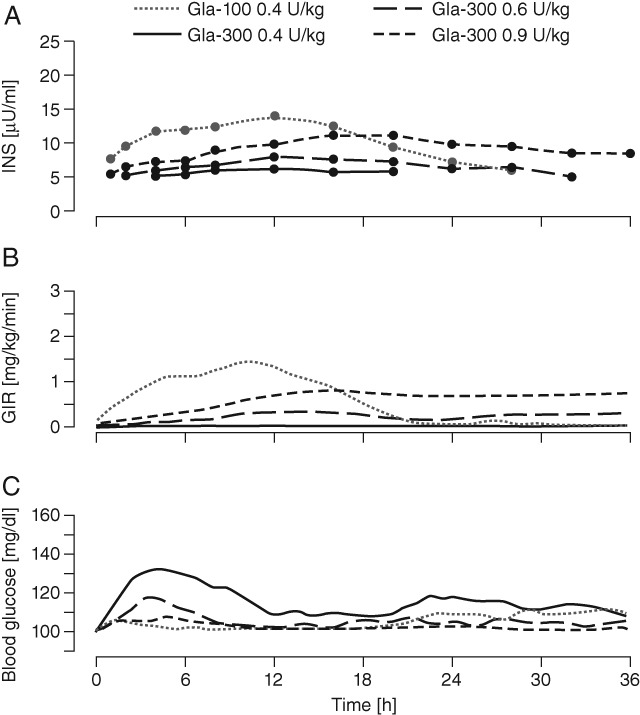
Serum insulin glargine concentration (INS), glucose infusion rate (GIR) and blood glucose profiles after a single dose in the European study. (A) Median INS profiles (linear scale) with lower limit of quantification (LLOQ) of 5.02 µU/ml; (B) mean smoothed [locally weighted regression in smoothing scatterplots (LOESS) factor 0.15] 36-h body-weight-standardized GIR profiles; (C) mean smoothed (LOESS factor 0.15) 36-h blood glucose profiles.
The point estimates of the treatment ratios (or differences) for key PK variables between Gla-300 and Gla-100 were similar between both populations (data not shown).
Pharmacodynamics
The PD variables and profiles of Gla-300 and Gla-100 for the Japanese study are shown in Figure 2B, C and in Table 2A. Figure 3B, C and Table 2B show corresponding data for the European study. In both studies, Gla-100 and Gla-300 had different PD profiles, corresponding to the observed PK profiles. In the Japanese study, blood glucose levels for both Gla-300 doses gradually increased up to approximately 6 h, and subsequently settled at the clamp level until 36 h. By contrast, blood glucose levels were maintained at the clamp level until approximately 24 h with Gla-100, but increased gradually thereafter. In the European study, a glucodynamic effect was also detected for up to 36 h.
Table 2.
Pharmacodynamic characteristics after a single dose in (A) the Japanese and (B) the European study
| (A) | Gla-100 0.4 U/kg | Gla-300 0.4 U/kg | Gla-300 0.6 U/kg |
|---|---|---|---|
| Number | 18 | 18 | 18 |
| Mean ± s.d. GIR-AUC0–36, mg/kg | 1859 ± 1085 | 990 ± 1233† | 1591 ± 1719† |
| Mean ± s.d. GIRmax, mg/kg/min* | 2.2 ± 0.8 | 1.2 ± 1.0† | 1.8 ± 1.3† |
| Median (interquartile range) T50%-GIR-AUC0–36, h | 13 (10–15) | 17 (14–21)‡§ | 18 (15–21)‡ |
| (B) | Gla-100 0.4 U/kg | Gla-300 0.4 U/kg | Gla-300 0.6 U/kg | Gla-300 0.9 U/kg |
|---|---|---|---|---|
| Number | 22 | 22** | 22†† | 22 |
| Mean ± s.d. GIR-AUC0–24, mg/kg | 1480 ± 810 | 383 ± 379† | 728 ± 779† | 1179 ± 608 |
| Mean ± s.d. GIR-AUC0–36, mg/kg | 1725 ± 920 | 631 ± 590† | 1118 ± 1018† | 1845 ± 765 |
| Mean ± s.d. GIRmax, mg/kg/min* | 2.2 ± 0.9 | 1.6 ± 1.1† | 1.5 ± 0.9 | 2.2 ± 0.7 |
| Median (interquartile range) T50%-GIR-AUC0–36, h | 12 (11–13) | 17 (12–24)‡ | 17 (14–23)‡ | 19 (18–22)‡ |
| Median (interquartile range) T50%-GIR-AUC0–24, h | 11 (10–12) | 11 (8–14) | 13 (11–13) | 13 (12–15) |
GIR, glucose infusion rate; GIR-AUC0–24/36, area under the body-weight-standardized GIR time curve from time 0 to 24 or 36 h; GIRmax, maximum smoothed body-weight-standardized GIR; T50%-GIR-AUC0–36, time to 50% of GIR-AUC0–36; s.d., standard deviation.
LOESS smoothing factor of 0.06.
Statistically significantly different from insulin glargine 100 U/ml 0.4 U/kg: concluded if p-value <0.05.
Statistically significantly different from insulin glargine 100 U/ml 0.4 U/kg: for T50%-GIR-AUC0–36, concluded if p-value <0.1. No inferential analysis was performed for T50%-GIR-AUC0–24.
N = 14 (4 of 18 subjects with no GIR were excluded).
Three of 22 subjects received rescue insulin, after which GIR was set to ‘missing’.
Two of 22 subjects received rescue insulin, after which GIR was set to ‘missing’.
In both studies, insulin activity for all Gla-300 doses was delayed and GIRmax was lower than after Gla-100 administration (Figure 2B and 3B); however, total exogenous glucose consumption (GIR-AUC0–36) rose with increasing Gla-300 dose but required Gla-300 0.9 U/kg to yield a greater glucose demand than Gla-100 0.4 U/kg (Table 2B). Consistent with GIR profiles, the T50%-GIR-AUC0–36 was postponed by approximately 5–7 h for Gla-300, to values close to 18 h after dosing (Table 2A and B). Because of the predefined clamp end at 36 h, the full duration of Gla-300 activity could not be assessed.
Premature termination of the glucose clamp experiments requiring intravenous insulin administration occurred in the European study in two participants twice, after both Gla-300 0.4 and 0.6 U/kg, and once in one participant with Gla-300 0.4 U/kg administration.
Four of these clamps were terminated early (between 3.5 and 7 h after dosing) because of insufficient blood glucose control, while one clamp termination occurred late, at 28 h after dosing, with 0.4 U/kg Gla-300. Termination early in the clamp after having received intravenous insulin glulisine concealed whether any late-onset metabolic activity had occurred.
Metabolite Concentrations
In a separate analysis in Japanese subjects, the principle active moiety in plasma after Gla-300 administration was identified as metabolite 1, which is the same for Gla-100 [8]. The measured metabolite 1 concentrations for all treatments were approximately three times the LLOQ [30 pmol/l (0.2 ng/ml)]; the highest concentration was observed in Gla-100 [104 pmol/l (0.628 ng/ml)] followed by Gla-300 0.6 U/kg [75 pmol/l (0.452 ng/ml)] and 0.4 U/kg [66 pmol/l (0.402 ng/ml)]. Across the majority of individual samples, parent insulin glargine and metabolite 2 concentrations were below the LLOQ of 30 pmol/l (0.2 ng/ml; data not shown).
Safety
In both studies, Gla-300 and Gla-100 were well tolerated, and no between-treatment differences in safety measures were observed. The anti-insulin antibody status, titre and cross-reactivity did not change significantly throughout the course of the study (data not shown). No serious adverse events or withdrawals as a result of adverse events occurred in either study.
Discussion
In these similarly designed single-dose euglycaemic clamp studies in Japanese and European participants with type 1 diabetes, Gla-100 and Gla-300 had different INS and GIR profiles. Insulin exposure and activity took more time to develop and were prolonged, and more constant profiles were produced with Gla-300 than with Gla-100. A more evenly distributed metabolic effect was also apparent with Gla-300, observable in particular at the Gla-300 0.6 and 0.9 U/kg doses (0.9 U/kg dose not used in the Japanese study), reflected in the longer T50%-GIR-AUC0–36 (∼18 h) observed in those dose groups compared with Gla-100 (∼12 h). As a result, blood glucose control was more sustained and maintained up to 36 h for all Gla-300 doses. As the clamp period ended at 36 h, Gla-300 could potentially be active beyond this time point. Notably, the higher dose of Gla-300 (0.9 U/kg) was not investigated in the Japanese study as it is not relevant to clinical practice in Japan, where lower doses of Gla-100 are used compared with in Western countries.
The findings of these studies point to modification of the retarding principle observed with Gla-100, and suggest that the pH-dependent precipitation and redissolution of insulin glargine is dependent upon the concentration of the injected solution [9]. This contrasts with insulins that remain soluble after injection. This glargine-specific phenomenon may rest in a surface-dependent release, proportional to the volume of a coherent amorphous precipitate.
The PK and PD findings in both the Japanese and European single-dose studies were generally consistent, suggesting that assessment in steady-state conditions in either population would be mutually relevant [3]. Based on these similarities, it may be assumed that the potential benefit in diabetes management conferred by the more constant PK and PD profiles with once-daily Gla-300 compared with Gla-100 may be observed across ethnicities; this includes the achievement of glycaemic goals, a potentially reduced risk of hypoglycaemia and the possibility of injection-time flexibility.
The ongoing EDITION clinical trial programme comparing glycaemic control and hypoglycaemia with Gla-300 and Gla-100 in a range of different populations with both type 2 diabetes and type 1 diabetes, will help to determine whether the more constant and prolonged PK and PD profiles observed with Gla-300 translate into clinical improvements. The results so far in this programme, including those specifically in the Japanese population, show that Gla-300 is as effective as Gla-100 in achieving glycaemic control but with less hypoglycaemia and weight gain [10–15].
Acknowledgments
This study was funded by Sanofi. Medical writing and editorial assistance was provided by Victoria Panagakis at Fishawack Communications Ltd, and this service was supported by Sanofi. The data were previously published in abstract form at the 49th Annual Meeting of the European Association for the Study of Diabetes (EASD), 23–27 September 2013, Barcelona, Spain.
Conflict of Interest
A. F., Y. T., M. K., L. T., J. T., R. D. and R. H. A. B. are employees of Sanofi. M. S., T. E., and S. I. disclose no conflicts of interest. T. H. is the CEO and co-owner of PROFIL, a private research institute, which has received research grant support from Adocia, Becton Dickinson, Biocon, Boehringer Ingelheim, Bristol-Myers Squibb, Dance Pharmaceuticals, Evolva, Hoffmann La-Roche, Johnson & Johnson, Eli Lilly, Marvel, Novartis, Novo Nordisk, Sanofi and Servier. T. H. has received honoraria from Eli Lilly and Novo Nordisk and travel grants from Novo Nordisk. He is a member of advisory panels for Novo Nordisk.
M. K. and R. B. planned the study and developed the manuscript. M. S., T. E. and S. I. collected the pharmacokinetic and pharmacodynamic data and reviewed the manuscript. R. D., J. T. and L. T. contributed to the study conception, design, data analysis and discussion, and reviewed and edited the manuscript. A. F. and Y. T. reviewed the manuscript as study director and pharmacokineticist, respectively. T. H. contributed to the study conception and design, and data analysis and interpretation, performed the experiments and reviewed and edited the manuscript. R. B. is the guarantor of this work and, as such, had full access to all the data in the study and takes responsibility for the integrity of the data and the accuracy of the data analysis.
References
- 1.Yamamoto-Honda R, Takahashi Y, Yoshida Y, et al. Use of insulin glargine in Japanese patients with type 1 diabetes. Intern Med. 2007;46:937–943. doi: 10.2169/internalmedicine.46.6467. [DOI] [PubMed] [Google Scholar]
- 2.Pieber TR, Eugène-Jolchine I, Derobert E. Efficacy and safety of HOE 901 versus NPH insulin in patients with type 1 diabetes. The European Study Group of HOE 901 in type 1 diabetes. Diabetes Care. 2000;23:157–162. doi: 10.2337/diacare.23.2.157. [DOI] [PubMed] [Google Scholar]
- 3.Jax T, Heise H, Dahmen R, et al. New insulin glargine formulation has a flat and prolonged steady state profile in subjects with type 1 diabetes. Diabetologia. 2013;56(Suppl. 1):S414. [Google Scholar]
- 4.Tillner J, Bergmann K, Teichert L, Dahmen R, Heise T, Becker RHA. Euglycaemic single dose clamp profile of new insulin glargine formulation in subjects with type 1 diabetes is flat and prolonged. Diabetologia. 2013;56(Suppl. 1):S415. [Google Scholar]
- 5.Seino Y, Nanjo K, Tajima N, et al. Report of the Committee on the classification and diagnostic criteria of diabetes mellitus. Diabetol Int. 2010;1:2–20. doi: 10.1111/j.2040-1124.2010.00074.x. [DOI] [PMC free article] [PubMed] [Google Scholar]
- 6.The Expert Committee On The Diagnosis And Classification Of Diabetes Mellitus. Report of the expert committee on the diagnosis and classification of diabetes mellitus. Diabetes Care. 1998;21:S5–S19. doi: 10.2337/diacare.26.2007.s5. [DOI] [PubMed] [Google Scholar]
- 7.Kashiwagi A, Kasuga M, Araki E, et al. International clinical harmonization of glycated hemoglobin in Japan: from Japan Diabetes Society to National Glycohemoglobin Standardization Program values. J Diabetes Investig. 2012;3:39–40. doi: 10.1111/j.2040-1124.2012.00207.x. [DOI] [PMC free article] [PubMed] [Google Scholar]
- 8.Steinstraesser A, Schmidt R, Bergmann K, Dahmen R, Becker RH. Investigational new insulin glargine 300 U/ml has the same metabolism as insulin glargine 100 U/ml. Diabetes Obes Metab. 2014;16:873–876. doi: 10.1111/dom.12283. [DOI] [PMC free article] [PubMed] [Google Scholar]
- 9.Cochran E, Musso C, Gorden P. The use of U-500 in patients with extreme insulin resistance. Diabetes Care. 2005;28:1240–1244. doi: 10.2337/diacare.28.5.1240. [DOI] [PubMed] [Google Scholar]
- 10.Riddle MC, Bolli GB, Zieman M, Meuhlen-Bartmer I, Bizet F, Home PD. New insulin glargine 300 units/mL versus glargine 100 units/mL in people with type 2 diabetes using basal and mealtime insulin: glucose control and hypoglycemia in a 6-month randomized controlled trial (EDITION 1) Diabetes Care. 2014;37:2755–2762. doi: 10.2337/dc14-0991. [DOI] [PubMed] [Google Scholar]
- 11.Yki-Järvinen H, Bergenstal RM, Ziemen M, et al. New insulin glargine 300 units/mL versus glargine 100 units/mL in people with type 2 diabetes using oral agents and basal insulin: glucose control and hypoglycemia in a 6-month randomized controlled trial (EDITION 2) Diabetes Care. 2014;37:3235–3243. doi: 10.2337/dc14-0990. [DOI] [PubMed] [Google Scholar]
- 12.Bolli GB, Riddle MC, Bergenstal B, et al. New insulin glargine 300 U/mL: glycemic control and hypoglycemia in insulin naïve people with T2DM (EDITION 3) (Abstract) Diabetes. 2014;63(Suppl. 1):A19. [Google Scholar]
- 13.Home PD, Bergenstal B, Riddle MC, et al. Glycemic control and hypoglycemia with new insulin glargine 300 U/mL in people with T1DM (EDITION 4) (Abstract) Diabetes. 2014;63(Suppl. 1A):LB19. [Google Scholar]
- 14.Matsuhisa M, Koyama M, Cheng XN, Shimizu S, Hirose T. New insulin glargine 300 U/mL: glycemic control and hypoglycemia in Japanese people with T1DM (EDITION JP 1) (Abstract) Diabetes. 2014;63(Suppl. 1A):LB22. [Google Scholar]
- 15.Terauchi Y, Koyama M, Cheng XN, Shimizu S, Hirose T. Glycemic control and hypoglycemia in Japanese people with T2DM receiving new insulin glargine 300 U/mLin combination with OADs (EDITION JP 2) (Abstract) Diabetes. 2014;63(Suppl. 1A):LB24. [Google Scholar]