

Abstract
Rationale: Oropharyngeal (OP) swabs and induced sputum (IS) are used for airway bacteria surveillance in nonexpectorating children with cystic fibrosis (CF). Molecular analyses of these airway samples detect complex microbial communities. However, the optimal noninvasive sampling approach for microbiota analyses and the clinical relevance of microbiota, particularly its relationship to airway inflammation, is not well characterized.
Objectives: The goals of this study were to compare molecular analyses of concurrently collected saliva, OP swabs, IS, and expectorated sputum (ES) from children with CF and to determine the association between microbiota, lung function, and airway inflammation.
Methods: Saliva, OP swabs, IS, and ES were collected from 16 children with CF. Spirometry was performed.
Measurements and Main Results: Respiratory and saliva samples (n = 61) were sequenced for bacterial microbial communities, and total and CF-specific bacterial quantitative PCR assays were performed. Airway samples underwent conventional culture for CF-specific pathogens. Neutrophil elastase, IL-1β, IL-1ra, IL-6, Il-8, TNF-α, and vascular endothelial growth factor were measured in ES and IS. Sequencing results from individual subjects were similar across samples, with greater between-subject than within-subject variation. However, Pseudomonas and Staphylococcus were detected in higher relative abundance from lower airways (ES and IS) compared with paired upper airway samples (OP and saliva). Pseudomonas, Staphylococcus, and Enterobacteriaceae correlated with increased airway inflammation. Divergence between microbiota in upper airway compared with lower airway samples, indicating greater differences between communities, was associated with increased sputum neutrophil elastase.
Conclusions: Bacteria detected in IS samples resemble ES samples, whereas OP samples may underrepresent bacteria associated with airway inflammation. Divergence of lower airway communities from upper airway was associated with airway inflammation and may portend disease progression.
Keywords: bacterial infection, sputum, oropharyngeal swab, DNA sequencing, microbiome
Progressive obstructive lung disease, characterized by chronic airway infection and inflammation, is the leading cause of morbidity and mortality in cystic fibrosis (CF) (1). Pseudomonas aeruginosa and Staphylococcus aureus are the bacteria most frequently implicated in CF airway infection. However, culture-independent molecular approaches have detected far more complex microbiota in CF airways (2–9). Nontraditional bacteria from CF airway specimens, particularly anaerobes (e.g., Prevotella, Actinomyces, Veillonella, and Rothia), have been identified by molecular approaches and isolated using anaerobic cultures. This finding led to speculation that additional bacteria may contribute to CF lung disease and may require alternative treatments (10–12). Ecologic characteristics of the airway microbiota, such as diversity, species richness, and evenness, which describe the number and relative prevalence of bacteria within a community, also may be important markers of disease activity and progression (13–16).
Despite a number of studies demonstrating the complexity of the CF airway microbiota, the link between microbiota and clinical outcomes in CF is just beginning to be untangled. Interpretation of microbiota data is particularly challenging due to concerns about optimal sampling techniques and crossover between upper and lower airway bacterial communities. This is especially true for nonexpectorating children in whom oropharyngeal (OP) cultures are used as a surrogate to identify lower airway bacteria. Even for traditional CF pathogens, interpretation of culture results from OP samples is difficult because predictive values for lower airway bacteria change with the prevalence of particular bacteria (17–19). In molecular analyses, results from OP samples are further complicated by the fact that many of the bacteria detected are considered commensal oral microbiota (20). Sputum induction has been shown to be safe and effective in obtaining lower airway samples from nonexpectorating children with CF, but how airway microbiota detected from induced sputum (IS) compare with expectorated sputum (ES) or OP samples is not known (21).
The goals of this study were to compare bacteria detected by sequencing and quantitative PCR (qPCR) from concurrently collected saliva, OP swabs, ES, and IS specimens and to correlate these findings with indices of disease. To compare airway samples, we determined bacterial communities, total bacterial load (TBL), and load of CF-specific pathogens and Prevotella species in each specimen. We next compared airway inflammation measured from induced and expectorated sputum samples. Finally, we examined the associations between microbiologic results, lung function, and airway inflammation measured from IS specimens. Portions of this study have been previously reported in the form of an abstract (22) and in a previous publication (23).
Methods
An expanded description of the methods is available in the online supplement.
Study Design and Subjects
Subjects 8 to 21 years of age with a diagnosis of CF (sweat chloride > 60 mEq/L and/or the presence of two known CF mutations) and clinically stable lung disease were recruited. Clinical stability was defined by clinical impression of the primary pulmonologist and no change in antibiotic treatment in the preceding 30 days. The study was approved by the Colorado Multiple Institutional Review Board, and written informed consent and HIPPA Authorization were obtained from participants over 17 years of age or from parents or legal guardians of participants under 18 years of age. Assent was obtained from participants between 10 and 17 years of age. Subjects underwent history and physical examination, spirometry following American Thoracic Society guidelines (24), and specimen collection, using standardized procedures, for OP, saliva, ES, and IS samples at a single study visit. We defined saliva and OP specimens as representative of upper airways and IS and ES specimens as representative of lower airways.
Molecular Methods
DNA extraction was performed using the Qiagen EZ1 Advanced extraction platform (Qiagen Inc., Valencia, CA) with the bacterial card and tissue extraction kit. TBL and quantity of specific bacterial species P. aeruginosa, Haemophilus influenzae, S. aureus, Prevotella denticola, Prevotella melaninogenica, and Prevotella oris were measured using previously published qPCR assays (23). Primers are shown in Table E1 in the online supplement.
Pyrosequencing
Bacterial communities were determined by pyrosequencing (454 Roche Life Sciences, Branford, CT). The DNA sequencing data were deposited in the NCBI Short Read Archive database under the accession number SRP039515 (25).
Sputum Inflammatory Markers
Expectorated and induced sputum samples were processed as previously described (26) and analyzed for total cell counts and differentials, free neutrophil elastase activity (Sigma Diagnostics) (lower limit of detection [LLD], 0.5 μg/ml), and the following cytokines (R&D Systems, Minneapolis, MN): IL-1β (LLD, 2.5 pg/ml), IL-1ra (LLD, 40 pg/ml), IL-6 (LLD, 2.0 pg/ml), IL-8 (LLD, 1.0 pg/ml), TNF-α (LLD, 4.0 pg/ml), and vascular endothelial growth factor (VEGF) (LLD, 12 pg/ml).
Statistical Analysis
Descriptive statistics include the mean and SD or the median and range. To account for differences in the number of sequences detected per sample, the relative abundance (RA) of each taxon, defined as the percentage of total sequences attributable to a specific taxon within the community, was calculated for each sample. Shannon diversity index, an ecologic parameter that takes into account community richness and evenness, was calculated in Explicet (27) using rarefaction to the number of sequences in the smallest library (28, 29). Communities across sample types within a subject were compared using Shannon Beta, a measure of β-diversity (30). This approach extends the β-diversity measure to apply to a group of samples rather than just for pairwise comparisons. For ease of clinical interpretation, Shannon Beta is expressed as a Hill number, which indicates the effective number of communities represented by the group of samples. This measure is dependent on the number of samples (in our study, sample types) from which it was calculated and ranges from 1 to n (in our study, n = 4 for subjects with all sample types collected). A normalizing transformation was used to rescale the Hill numbers to allow comparison across subjects with differences in the number of collected samples (31). Principal component analysis was performed for the sequence data using the covariance matrix. A small constant (1/total) was added to the counts to eliminate zeros before the application of the centered log ratio transformation recommended for compositional data (32, 33). Comparison of all variables across sample type was performed using Wilcoxon signed-rank tests. Spearman’s correlation coefficients were used to determine the correlation between inflammatory markers, lung function, and qPCR assays and between ecologic parameters (Shannon diversity, richness, and evenness), β-diversity, and clinical variables (lung function, body mass index, and age). Analyses were performed using SAS version 9.3 software (SAS Institute Inc., Cary, NC).
Results
Subjects
Airway specimens (n = 61) were collected concurrently from 16 children with CF; samples consisted of 16 oropharyngeal (OP) swabs, 15 spontaneously expectorated sputa (ES), 16 induced sputa (IS), and 14 saliva samples. One IS sample had insufficient quantity for sequencing. Subject characteristics are shown in Table 1. The bacteria most commonly detected by culture were P. aeruginosa and S. aureus.
Table 1.
Subject characteristics (N = 16)
| Subject Characteristics | Values |
|---|---|
| Female, n (%) | 6 (38) |
| Age, yr (mean ± SD) | 13.8 ± 3.8 |
| White, n (%) | 15 (94) |
| Genotype: F508/F508, n (%) | 7 (44) |
| F508/other, n (%) | 6 (38) |
| Other/other, n (%) | 3 (19) |
| FVC % predicted (mean, SD) | 97.1 ± 24.9 |
| FEV1% predicted (mean, SD) | 95.8 ± 17.2 |
| BMI % predicted | 51.4 ± 26.0 |
| Sputum culture,* n (%) | |
| Pseudomonas aeruginosa | 10 (63) |
| Staphylococcus aureus | 11 (69) |
| Haemophilus influenzae | 4 (25) |
| Stenotrophomonas maltophilia | 4 (25) |
| Aspergillus† | 6 (38) |
| Streptococcus milleri group‡ | 5 (31) |
| Scedosporium apiospermum | 1 (6) |
TBL and Specific Bacterial Species Measured by qPCR
TBL detected from ES, IS, and saliva samples were similar, with no statistically significant differences (see Figure E1). TBL was lower in OP (mean [SD] 8.8 Log10 gene copies/ml [1.8]) compared with ES (10.6 [1.04]; P < 0.001), IS (10.3 [1.4]; P = 0.004), and saliva (9.7 [2.1]; P = 0.02). Specific qPCR assays also tended to detect bacteria in lower quantities from OP samples compared with IS, ES, and saliva samples (Figure E2). P. aeruginosa, H. influenzae, and S. aureus were generally present in higher quantities in IS and ES compared with paired saliva, although not all differences reached statistical significance; conversely, P. denticola had a trend toward higher quantities in saliva compared with induced sputum. Quantities did not differ between paired IS and ES samples. Complete results of specific qPCR assays are available in Table E2.
Sequencing Detects Diverse Microbiota from all Airway Sample Types
A total of 194 bacterial taxa were detected from 60 samples, with a median of 28 taxa per sample (range, 8–98). The total number of sequences per sample varied from 873 to 2,811, with a median count of 1,391 sequences per sample and with no significant difference between sample types. The RA of each taxon was calculated by dividing the number of sequences for a specific taxon by the total number of sequences. Figure 1 shows the community composition from saliva, OP, ES, and IS from each subject. Shannon diversity index and its components, richness and evenness, were compared across all paired samples. There was no statistically significant difference detected between ecologic measurements by sample types (Figure E3, Shannon diversity index).
Figure 1.

Bacteria detected by sequencing from each participant by sample type. Relative abundances (RAs) of the most prominent taxa are displayed in the bar graph. Participants A through P are ordered by increasing β-diversity (Hill number, absolute Hill number; specified in A indicating greater difference in community between sample types). In specimens where total RA displayed is less than 100%, the proportion not displayed was made up of other taxa present in low RA (<1%). Total bacterial load (log10 bacterial ribosomal RNA copy number/ml) is given below each sample. Positive or negative culture results for cystic fibrosis pathogens (Psuedomonas aeruginosa, Staphylococcus aureus, Haemophilus influenzae, Stenotrophomonas maltophilia, and Streptococcus milleri group) are indicated by + and – below the bar graphs. AF = amplification failed; ES = expectorated sputum; Hill’s #, absolute Hill number; Hn = Hill number normalized for number of samples (shown in each panel); IS = induced sputum; NC = not collected; ND = assay not done; OP = oropharyngeal swab; S = saliva.
Hill Numbers Reveals within-Subject Differences in Microbiota, Primarily due to Divergence between Upper and Lower Airway Communities
Divergence, a measure of the difference between microbiota communities within a subject, was determined using Hill number for Shannon β-diversity, which provides an estimate for the number of distinct communities across samples taken from an individual subject. Values ranged from 1.0 (Figure 1, Subject A; bar graph shows high similarity of communities across sample types) to 1.6 (Figure 1, Subject P; bar graph shows divergence between upper and lower airway samples with distinct microbiota profiles for IS and ES compared with OP and saliva). The median Hill numbers value of 1.2 indicates that, for many subjects, communities were highly similar across sample types and did not diverge markedly between upper and lower airway samples. Bacterial communities were more similar within an individual subject than between subjects. When communities diverged within an individual subject, the difference was most often accounted for by differences between upper versus lower airway samples (Figure E4). Those subjects with more pronounced divergence between sample types, indicated by higher Hill numbers, had higher RAs of Pseudomonas (e.g., Figure 1, Subjects K, M, and O), Staphylococcus (e.g., Subjects J, K, L, and P), Enterobacteriaceae (e.g., Subject P), and Haemophilus (e.g., Subject N) in induced and expectorated sputum samples compared with OP and saliva. Prevotella was detected in similar relative abundance across sample types, except in one subject (Subject F). Only one subject (Subject O) had distinct differences in the bacteria detected from IS and ES; TBL was approximately 25-fold (2.6 logs) lower for ES compared with IS in this subject, suggesting an inadequate ES sample.
Sequencing Reveals Enrichment of Traditional CF Pathogens in Sputum Samples
We compared the bacterial communities detected by sequencing from all samples using PCA clustering (Figure 2). The first two components explained 26% of the variability across samples. Samples generally clustered by subject. Pseudomonas and Staphylococcus contributed in large part to explaining the variability across subjects as seen in the first two components. We next compared the RA of specific taxa between paired sample types (Figure 3). Traditional CF-associated taxa, Pseudomonas and Staphylococcus, were detected in higher relative abundance from IS compared with saliva (P = 0.05 and P = 0.03) and OP samples (P = 0.02 and P = 0.03); similar results were seen for ES. In one subject, Enterobacteriaceae was detected in markedly higher RA in ES and IS compared with saliva and OP; the differences across all samples were not statistically significant, likely due to there being few subjects with this taxon. Conversely, Veillonella was detected in higher abundance in OP and saliva samples compared with IS (P = 0.003 and P = 0.01) and ES (P < 0.001 and P = 0.03). The relative abundances of major taxa detected were highly similar between paired IS and ES and paired OP and saliva samples (Figure E5). The most common taxa detected from each sample types are listed in Table E3.
Figure 2.
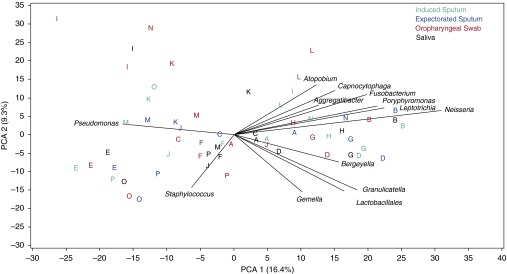
Principal component analysis (PCA). The first two principal components explain 26% of the variability across samples. Pseudomonas is negatively associated with commensal taxa along PCA 1, whereas Staphylococcus is associated with PCA 2. Letters within the PCA plot indicate the subject from whom the sample was obtained and correspond to the letters in Figure 1. Samples from most individual subjects tend to cluster together. Sample types are displayed by color indicated in the key.
Figure 3.

Comparison of relative abundance (RA) between paired specimens. Box plots show the median difference in RA for prominent bacterial taxa and traditional cystic fibrosis–associated taxa detected by sequencing from expectorated sputum (ES) and induced (IS) sputum compared with paired oropharyngeal (OP) and salivary (S) samples. Samples were excluded if RA for the taxon was zero in both paired samples. Pseudomonas and Staphylococcus RAs were higher in lower airway samples compared with upper airways, whereas Veillonella, Rothia, and Streptococcus RAs were higher in upper airway samples. Enterobacteriaceae appears increased in lower airways but was not statistically significant. Boxes indicate median and 25 to 75% interquartile range. Diamonds indicate means; circles indicate values outside the interquartile range. Statistically significant differences are indicated by *P ≤ 0.05 and **P ≤ 0.01.
Comparison of Molecular Sequencing with Conventional Culture and qPCR
Results for Pseudomonas from standard culture and sequencing were concordant in 36 of 45 (80%) samples. Six samples (two IS, two ES, and two OP) were positive for P. aeruginosa only by culture, whereas three samples (one IS, one ES, and one OP) were positive only by sequencing. Sequencing for Staphylococcus performed less well in comparison to culture, with 49% concordance and 23 samples positive for S. aureus only by culture (4 IS, 8 ES, and 11 OP); only one ES sample was positive for Staphylococcus by sequencing but negative by culture. Haemophilus was concordant for 64% of samples but was detected by sequencing in 16 samples despite negative cultures.
We determined the correlation between specific bacterial qPCR assays for CF pathogens and RA determined by sequencing. P. aeruginosa and S. aureus were highly correlated to Pseudomonas RA (r = 0.94; P < 0.001) and Staphylococcus RA (r = 0.75; P = 0.001), respectively. Conversely, H. influenzae was not well correlated with Haemophilus RA (r = 0.19; P = 0.5), potentially due to the presence of other Haemophilus species (e.g., H. parainfluenzae).
Comparison of Inflammatory Markers Detected from Respiratory Samples
Inflammatory markers measured from 14 ES and IS pairs were highly correlated, with the exception of IL-1ra: neutrophil elastase (r = 0.64; P = 0.01), IL-6 (r = 0.61; P = 0.02), IL-8 (r = 0.58; P = 0.03), IL-1β (r = 0.69; P = 0.005), TNF-α (r = 0.71; P = 0.003), VEGF (r = 0.65; P = 0.01), and IL-1ra (r = −0.1; P = 0.8) (Figure E6). Although not statistically significant, there was a trend toward lower neutrophil elastase in ES compared with IS samples (P = 0.08), with a median difference of −0.15 log10 μg/ml. Mean values for all inflammatory markers are provided in Table E4.
Cross-Sectional Relationship between Induced Sputum Microbiota, Inflammation, and Lung Function
By qPCR, P. aeruginosa load was associated with increased sputum neutrophil elastase (r = 0.53; P = 0.04), whereas S. aureus was associated with increased IL-1β (r = 0.61; P = 0.02) and VEGF (r = 0.59; P = 0.02) and was marginally associated with neutrophil elastase (r = 0.47; P = 0.08) and IL-8 (r = 0.48; P = 0.07) (Figure E7). Neither bacterial species, quantified by qPCR, was significantly associated with lung function. We did not detect an association between TBL and lung function or any sputum inflammatory markers.
We found statistically significant relationships between community ecology and airway inflammation. Shannon diversity index and evenness were inversely associated with neutrophil elastase (r = −0.5; P = 0.06 for both comparisons). Evenness, but not diversity, was associated with increased Pseudomonas RA and P. aeruginosa by qPCR (r = −0.5; P = 0.06 and r = −0.6; P = 0.02, respectively). Increased β-diversity, suggesting divergence in airway bacterial communities in different niches within the same subject, was associated with increased neutrophil elastase (r = 0.65; P = 0.01) but not with lung function (r = −0.26; P = 0.34).
Consistent with qPCR results, Pseudomonas RA determined by sequencing was associated with increased neutrophil elastase (r = 0.52; P = 0.06). Although not all relationships were significantly correlated, where associations were detected, Staphylococcus and Enterobacteriaceae were associated with increased inflammatory markers, whereas Haemophilus, Prevotella, Streptococcus, Veillonella, Rothia, Fusobacterium, and Neisseria were either not associated or were inversely associated with inflammatory markers (Figure 4).
Figure 4.

Associations between bacterial communities, lung function, and inflammation. The heat map shows Spearman’s correlation coefficients for ecology metrics (Shannon diversity index, Evenness) and relative abundance (RA) of prominent bacterial taxa related to lung function (FEV1) and airway inflammatory markers: neutrophil elastase (NE), IL-8, IL-6, TNF-α, vascular endothelial growth factor (VEGF), IL-1ra, and IL-1β. Red shades indicate positive correlations; blue shades indicate negative correlations. Positive (up) and negative (down) correlations are also indicated by the direction of the arrow symbol in the heat map. Correlations with a value of ≤|0.5| have a P value of ≤0.05.
Discussion
In this study, we found that in spontaneously expectorating, clinically stable children with CF, bacterial communities detected from IS using molecular approaches more closely reflected bacterial communities in ES than OP or saliva specimens. Although upper (OP and saliva) and lower (ES and IS) airway microbiota were highly similar in some patients, distinct communities were apparent in other subjects with lower airway microbiota diverging from upper airway microbiota. Importantly, bacterial taxa traditionally associated with CF lung disease were detected in higher RA in lower airway samples. The RA of Pseudomonas, Staphylococcus, and, in one patient, Enterobacteriaceae was higher in bacterial communities detected from lower airway samples compared with upper airway samples. P. aeruginosa load measured by qPCR was also higher in bacterial communities detected from lower airways compared with upper airways. Conversely, RA of Veillonella was higher, and there was a trend toward higher RA of Streptococcus, Prevotella, and Rothia in OP and saliva compared with sputum. Furthermore, Pseudomonas, Enterobacteriaceae, and, to a more moderate degree, Staphylococcus were positively associated with sputum neutrophil elastase, a known mediator of CF airways damage. Streptococcus, Prevotella, Veillonella, and Rothia were not associated with or had negative associations with sputum markers of inflammation.
Unlike previously published studies, we did not detect an association between microbial diversity and lung function, perhaps reflecting the small sample size or relative mild lung disease in our cohort (13–16, 34). However, decreased Shannon diversity, evenness, and increased divergence between upper and lower airway samples (measured as Hill numbers for β-diversity) were associated with increased sputum neutrophil elastase. These changes may reflect expansion of pathogenic bacteria within lower airway microbial communities. For example, in our cohort, increased community divergence between upper and lower airway samples was seen, with increased RA of Pseudomonas, Staphylococcus, Haemophilus, and Enterobacteriaceae in sputum samples compared with OP and saliva. Charlson and colleagues reported a similar finding comparing oropharyngeal wash (OW) and BAL specimens from healthy subjects and lung transplant recipients using Unifrac distance and the Jaccard Index to measure community similarity (35, 36). BAL and OW bacterial communities were highly similar in healthy subjects, although bacterial load was lower in BAL specimens. Conversely, in lung transplant recipients, OW and BAL bacterial communities were more distinct, and BAL specimens had bacterial loads closer in value to OW, likely due to growth of bacterial pathogens (e.g., Pseudomonas, Staphylococcus, and Achromobacter) in lung specimens. Measures of community distance (e.g., Unifrac and Jaccard Index) are useful for sequencing data expressed as operational taxonomic units (35, 36). To measure divergence between communities, we calculated Hill numbers for β-diversity, a metric of the number of distinct communities present across a collection of samples appropriate for phylogenetic data, providing a novel approach to comparing communities across clinical samples (30).
We also found that salivary and OP bacterial communities were dominated by the taxa Streptococcus, Prevotella, Rothia, Veillonella, Gemella, and Granulicatella. These findings are consistent with previous studies of the salivary microbiome in healthy subjects, although Neisseria was less prominent in our findings compared with other reports (37–41). Streptococcus, Prevotella, Rothia, and Veillonella were also detected in high RA in ES and IS samples, consistent with previous studies of CF airway samples using molecular approaches and anaerobic cultures (7, 9, 10, 13, 42). Taxa traditionally associated with CF (e.g., Pseudomonas, Staphylococcus, Haemophilus, Stenotrophomonas, and Achromobacter) were less prevalent but were present in high RA in individual subjects. Enterobacteriaceae is a family of bacteria that includes genera with known human pathogens, including Cedecea, Citrobacter, Enterobacter, Escherichia, Klebsiella, and Serratia. Escherichia coli and Klebsiella pneumonia in particular have been reported in patients with CF (43, 44). Cedecea was also recently reported in a patient with CF with pneumonia (45).
We also found substantial overlap between bacteria detected from IS, ES, OP, and saliva samples. This finding is similar to reports comparing upper and lower airway samples from healthy subjects and subjects with asthma (46) and may reflect repeated microaspiration with inoculation of oral bacteria into the lower airways (47). Patients with CF have increased difficulty clearing bacteria due to impaired mucociliary clearance and abnormal mucus (1), which may lead to a bacterial community common to both sputum and saliva. Culture-based assessment of trans-tracheal aspirates identified commensal organisms in airway samples that were not exposed to the oral cavity, which further supports the upper airways and oral cavity as a source of exposure for the lower airways in CF (48). Unlike our findings, Rogers and colleagues compared mouthwash samples with sputum using terminal restriction fragment length polymorphism and found that only 10% of terminal restriction fragment length polymorphism bands overlapped between saliva and sputum (49). One potential reason for this difference may be that our study was performed in younger, pediatric patients who may have less divergence in lower airway samples compared with upper airway due to less expansion of pathogens within the airway bacterial communities or increased crossover during sample collection.
Our study has several limitations. First, our sample size was relatively small, and thus we may not have detected an association between bacteria and lung function that a larger study may reveal. All but one of our subjects were able to expectorate sputum; thus, how reliably induced sputum reflects lower airway bacteria from nonexpectorating patients cannot be extrapolated from this data. However, previous studies of induced sputum from nonexpectorating pediatric patients with CF found a high success rate of induction (21) and good concordance with standard microbiologic culture of lower airway specimens (50). We found that sequencing was less sensitive in detecting S. aureus compared with culture. Standard bacterial lysis, as used in our sample processing approach, may have lower sensitivity for S. aureus compared with DNA extraction using a lysostaphin- and lysozyme-amended lysis buffer, which may explain our findings (51). We also did not examine repeated sample collections from individual patients; thus, we cannot comment on whether additional bacterial taxa may have been detected from multiple samples. It is possible that greater divergence in upper and lower airway bacterial communities may reflect more copious secretions, and thus sputum samples more reflective of the lower airways, in subjects with more severe disease. Finally, our subjects were all clinically stable, and therefore we cannot comment on changes in microbial communities with illnesses or whether OP swabs would have greater yield during times of acute pulmonary illness.
In conclusion, we found that microbiota sequenced from induced sputum samples more closely represents expectorated sputum samples compared with OP swabs in spontaneously expectorating children with CF. This finding suggests that sputum induction may be advantageous over OP swabs for microbiota analyses, although further studies are needed in nonexpectorating children with CF. Importantly, expectorated and induced sputum samples were enriched with traditional CF pathogens Pseudomonas and Staphylococcus, and OP swab alone may have missed these taxa. In addition, inflammatory markers from IS closely correlated with inflammatory markers in paired ES samples. RA of Pseudomonas, Staphylococcus, and Enterobacteriaceae were associated with increased airway inflammation, whereas bacterial taxa often classified as oral microbiota were not associated with increased inflammation. Divergence of bacterial communities between upper and lower airway samples, likely due to expansion of bacterial pathogens, was associated with increased neutrophil elastase, possibly representing a mechanism of disease activity. Understanding how these pathogens propagate within the microbial community and identification of strategies to maintain diverse communities may lead to novel therapeutic interventions.
Acknowledgments
Acknowledgment
The authors thank Churee Pardee, Research Coordinator; Elinor Towler, Database Manager at Children’s Hospital Colorado; and the children and families who participated for their dedication to this study.
Footnotes
This work was supported by the Cystic Fibrosis Foundation grant ZEMANI07DO, National Institutes of Health grant K23HL114883, and National Institutes of Health/National Center for Advancing Translational Sciences Colorado CTSI grant UL1 TR001082.
Author Contributions: E.T.Z. contributed to the study design, analysis, and interpretation of data and wrote the manuscript. B.D.W. contributed to the data analysis and statistical interpretation and to writing the manuscript. C.E.R. contributed to data analysis and critically reviewed the manuscript. M.J.S. contributed to the sample analysis and critically reviewed the manuscript. S.J.S. contributed to data interpretation and critically reviewed the manuscript. F.J.A. contributed to the study design, data analysis, and interpretation and critically reviewed the manuscript. S.D.S. contributed to the study design and data interpretation and critically reviewed the manuscript. J.K.H. contributed to the sample analyses, data analysis and interpretation, and writing the manuscript.
Data Deposition: The DNA sequencing data reported in this paper have been deposited in the NCBI Short Read Archive database under accession number SRP039515 following guidelines from the National Center for Biotechnology Information.
This article has an online supplement, which is accessible from this issue's table of contents at www.atsjournals.org
Author disclosures are available with the text of this article at www.atsjournals.org.
References
- 1.Gibson RL, Burns JL, Ramsey BW. Pathophysiology and management of pulmonary infections in cystic fibrosis. Am J Respir Crit Care Med. 2003;168:918–951. doi: 10.1164/rccm.200304-505SO. [DOI] [PubMed] [Google Scholar]
- 2.Burns JL, Emerson J, Stapp JR, Yim DL, Krzewinski J, Louden L, Ramsey BW, Clausen CR. Microbiology of sputum from patients at cystic fibrosis centers in the United States. Clin Infect Dis. 1998;27:158–163. doi: 10.1086/514631. [DOI] [PubMed] [Google Scholar]
- 3.Saiman L. Microbiology of early CF lung disease. Paediatr Respir Rev. 2004;5(Suppl A):S367–S369. doi: 10.1016/s1526-0542(04)90065-6. [DOI] [PubMed] [Google Scholar]
- 4.Sibley CD, Rabin H, Surette MG. Cystic fibrosis: a polymicrobial infectious disease. Future Microbiol. 2006;1:53–61. doi: 10.2217/17460913.1.1.53. [DOI] [PubMed] [Google Scholar]
- 5.Bittar F, Rolain JM. Detection and accurate identification of new or emerging bacteria in cystic fibrosis patients. Clin Microbiol Infect. 2010;16:809–820. doi: 10.1111/j.1469-0691.2010.03236.x. [DOI] [PubMed] [Google Scholar]
- 6.Rogers GB, Carroll MP, Serisier DJ, Hockey PM, Jones G, Bruce KD. Characterization of bacterial community diversity in cystic fibrosis lung infections by use of 16s ribosomal DNA terminal restriction fragment length polymorphism profiling. J Clin Microbiol. 2004;42:5176–5183. doi: 10.1128/JCM.42.11.5176-5183.2004. [DOI] [PMC free article] [PubMed] [Google Scholar]
- 7.Bittar F, Richet H, Dubus JC, Reynaud-Gaubert M, Stremler N, Sarles J, Raoult D, Rolain JM. Molecular detection of multiple emerging pathogens in sputa from cystic fibrosis patients. PLoS One. 2008;3:e2908. doi: 10.1371/journal.pone.0002908. [DOI] [PMC free article] [PubMed] [Google Scholar]
- 8.Harris JK, De Groote MA, Sagel SD, Zemanick ET, Kapsner R, Penvari C, Kaess H, Deterding RR, Accurso FJ, Pace NR. Molecular identification of bacteria in bronchoalveolar lavage fluid from children with cystic fibrosis. Proc Natl Acad Sci USA. 2007;104:20529–20533. doi: 10.1073/pnas.0709804104. [DOI] [PMC free article] [PubMed] [Google Scholar]
- 9.Tunney MM, Klem ER, Fodor AA, Gilpin DF, Moriarty TF, McGrath SJ, Muhlebach MS, Boucher RC, Cardwell C, Doering G, et al. Use of culture and molecular analysis to determine the effect of antibiotic treatment on microbial community diversity and abundance during exacerbation in patients with cystic fibrosis. Thorax. 2011;66:579–584. doi: 10.1136/thx.2010.137281. [DOI] [PubMed] [Google Scholar]
- 10.Tunney MM, Field TR, Moriarty TF, Patrick S, Doering G, Muhlebach MS, Wolfgang MC, Boucher R, Gilpin DF, McDowell A, et al. Detection of anaerobic bacteria in high numbers in sputum from patients with cystic fibrosis. Am J Respir Crit Care Med. 2008;177:995–1001. doi: 10.1164/rccm.200708-1151OC. [DOI] [PubMed] [Google Scholar]
- 11.Sibley CD, Parkins MD, Rabin HR, Duan K, Norgaard JC, Surette MG. A polymicrobial perspective of pulmonary infections exposes an enigmatic pathogen in cystic fibrosis patients. Proc Natl Acad Sci USA. 2008;105:15070–15075. doi: 10.1073/pnas.0804326105. [DOI] [PMC free article] [PubMed] [Google Scholar]
- 12.Field TR, Sibley CD, Parkins MD, Rabin HR, Surette MG. The genus Prevotella in cystic fibrosis airways. Anaerobe. 2010;16:337–344. doi: 10.1016/j.anaerobe.2010.04.002. [DOI] [PubMed] [Google Scholar]
- 13.Zhao J, Schloss PD, Kalikin LM, Carmody LA, Foster BK, Petrosino JF, Cavalcoli JD, VanDevanter DR, Murray S, Li JZ, et al. Decade-long bacterial community dynamics in cystic fibrosis airways. Proc Natl Acad Sci USA. 2012;109:5809–5814. doi: 10.1073/pnas.1120577109. [DOI] [PMC free article] [PubMed] [Google Scholar]
- 14.Cox MJ, Allgaier M, Taylor B, Baek MS, Huang YJ, Daly RA, Karaoz U, Andersen GL, Brown R, Fujimura KE, et al. Airway microbiota and pathogen abundance in age-stratified cystic fibrosis patients. PLoS One. 2010;5:e11044. doi: 10.1371/journal.pone.0011044. [DOI] [PMC free article] [PubMed] [Google Scholar]
- 15.Klepac-Ceraj V, Lemon KP, Martin TR, Allgaier M, Kembel SW, Knapp AA, Lory S, Brodie EL, Lynch SV, Bohannan BJ, et al. Relationship between cystic fibrosis respiratory tract bacterial communities and age, genotype, antibiotics and Pseudomonas aeruginosa. Environ Microbiol. 2010;12:1293–1303. doi: 10.1111/j.1462-2920.2010.02173.x. [DOI] [PubMed] [Google Scholar]
- 16.Fodor AA, Klem ER, Gilpin DF, Elborn JS, Boucher RC, Tunney MM, Wolfgang MC. The adult cystic fibrosis airway microbiota is stable over time and infection type, and highly resilient to antibiotic treatment of exacerbations. PLoS One. 2012;7:e45001. doi: 10.1371/journal.pone.0045001. [DOI] [PMC free article] [PubMed] [Google Scholar]
- 17.Rosenfeld M, Emerson J, Accurso F, Armstrong D, Castile R, Grimwood K, Hiatt P, McCoy K, McNamara S, Ramsey B, et al. Diagnostic accuracy of oropharyngeal cultures in infants and young children with cystic fibrosis. Pediatr Pulmonol. 1999;28:321–328. doi: 10.1002/(sici)1099-0496(199911)28:5<321::aid-ppul3>3.0.co;2-v. [DOI] [PubMed] [Google Scholar]
- 18.Ramsey BW, Wentz KR, Smith AL, Richardson M, Williams-Warren J, Hedges DL, Gibson R, Redding GJ, Lent K, Harris K. Predictive value of oropharyngeal cultures for identifying lower airway bacteria in cystic fibrosis patients. Am Rev Respir Dis. 1991;144:331–337. doi: 10.1164/ajrccm/144.2.331. [DOI] [PubMed] [Google Scholar]
- 19.Armstrong DS, Grimwood K, Carlin JB, Carzino R, Olinsky A, Phelan PD. Bronchoalveolar lavage or oropharyngeal cultures to identify lower respiratory pathogens in infants with cystic fibrosis. Pediatr Pulmonol. 1996;21:267–275. doi: 10.1002/(SICI)1099-0496(199605)21:5<267::AID-PPUL1>3.0.CO;2-K. [DOI] [PubMed] [Google Scholar]
- 20.Huse SM, Ye Y, Zhou Y, Fodor AA. A core human microbiome as viewed through 16S RRNA sequence clusters. PLoS ONE. 2012;7:e34242. doi: 10.1371/journal.pone.0034242. [DOI] [PMC free article] [PubMed] [Google Scholar]
- 21.Sagel SD, Kapsner R, Osberg I, Sontag MK, Accurso FJ. Airway inflammation in children with cystic fibrosis and healthy children assessed by sputum induction. Am J Respir Crit Care Med. 2001;164:1425–1431. doi: 10.1164/ajrccm.164.8.2104075. [DOI] [PubMed] [Google Scholar]
- 22.Zemanick ET, Harris J.K., Sagel SD, Accurso FJ. Microbial communities in children with cystic fibrosis and clinically stable lung disease [abstract] E-PAS. 2008:3450.3. [Google Scholar]
- 23.Zemanick ET, Wagner BD, Sagel SD, Stevens MJ, Accurso FJ, Harris JK. Reliability of quantitative real-time PCR for bacterial detection in cystic fibrosis airway specimens. PLoS One. 2010;5:e15101. doi: 10.1371/journal.pone.0015101. [DOI] [PMC free article] [PubMed] [Google Scholar]
- 24.Miller MR, Hankinson J, Brusasco V, Burgos F, Casaburi R, Coates A, Crapo R, Enright P, van der Grinten CP, Gustafsson P, et al. Standardisation of spirometry. Eur Respir J. 2005;26:319–338. doi: 10.1183/09031936.05.00034805. [DOI] [PubMed] [Google Scholar]
- 25.Wheeler DL, Barrett T, Benson DA, Bryant SH, Canese K, Chetvernin V, Church DM, Dicuccio M, Edgar R, Federhen S, et al. Database resources of the National Center for Biotechnology Information. Nucleic Acids Res. 2008;36:D13–D21. doi: 10.1093/nar/gkm1000. [DOI] [PMC free article] [PubMed] [Google Scholar]
- 26.Sagel SD, Wagner BD, Anthony MM, Emmett P, Zemanick ET. Sputum biomarkers of inflammation and lung function decline in children with cystic fibrosis. Am J Respir Crit Care Med. 2012;186:857–865. doi: 10.1164/rccm.201203-0507OC. [DOI] [PMC free article] [PubMed] [Google Scholar]
- 27.Robertson CE, Harris JK, Wagner BD, Granger D, Browne K, Tatem B, Feazel LM, Park K, Pace NR, Frank DN. Explicet: graphical user interface software for metadata-driven management, analysis and visualization of microbiome data. Bioinformatics. 2013;29:3100–3101. doi: 10.1093/bioinformatics/btt526. [DOI] [PMC free article] [PubMed] [Google Scholar]
- 28.Colwell RK, Chao A, Gotelli NJ, Shang-Yi L, Mau CX, Chazdon RL, Longino JT. Models and estimators linking individual-based and sample-based rarefaction, extrapolation and comparison of assemblages. J Plant Ecol. 2011;5:3–21. [Google Scholar]
- 29.Mao CX, Colwell RK, Chang J. Estimating the species accumulation curve using mixtures. Biometrics. 2005;61:433–441. doi: 10.1111/j.1541-0420.2005.00316.x. [DOI] [PubMed] [Google Scholar]
- 30.Marcon E, Hérault B, Baraloto C, Lang G. The decomposition of Shannon's entropy and a confidence interval for beta diversity. Oikos. 2012;121:516–522. [Google Scholar]
- 31.Chao A, Chiu CH, Hsieh TC. Proposing a resolution to debates on diversity partitioning. Ecology. 2012;93:2037–2051. doi: 10.1890/11-1817.1. [DOI] [PubMed] [Google Scholar]
- 32.Filzmoser P, Hron K, Reimann C. Univariate statistical analysis of environmental (compositional) data: problems and possibilities. Sci Total Environ. 2009;407:6100–6108. doi: 10.1016/j.scitotenv.2009.08.008. [DOI] [PubMed] [Google Scholar]
- 33.Aitchinson J.The statistical analysis of compositional data. In: Monographs on statistics and applied probabilityLondon, UK: Chapman & Hall; 1986 [Google Scholar]
- 34.Stressmann FA, Rogers GB, van der Gast CJ, Marsh P, Vermeer LS, Carroll MP, Hoffman L, Daniels TW, Patel N, Forbes B, et al. Long-term cultivation-independent microbial diversity analysis demonstrates that bacterial communities infecting the adult cystic fibrosis lung show stability and resilience. Thorax. 2012;67:867–873. doi: 10.1136/thoraxjnl-2011-200932. [DOI] [PubMed] [Google Scholar]
- 35.Charlson ES, Diamond JM, Bittinger K, Fitzgerald AS, Yadav A, Haas AR, Bushman FD, Collman RG. Lung-enriched organisms and aberrant bacterial and fungal respiratory microbiota after lung transplant. Am J Respir Crit Care Med. 2012;186:536–545. doi: 10.1164/rccm.201204-0693OC. [DOI] [PMC free article] [PubMed] [Google Scholar]
- 36.Doll HM, Armitage DW, Daly RA, Emerson JB, Goltsman DS, Yelton AP, Kerekes J, Firestone MK, Potts MD. Utilizing novel diversity estimators to quantify multiple dimensions of microbial biodiversity across domains. BMC Microbiol. 2013;13:259. doi: 10.1186/1471-2180-13-259. [DOI] [PMC free article] [PubMed] [Google Scholar]
- 37.Lazarevic V, Manzano S, Gaia N, Girard M, Whiteson K, Hibbs J, Francois P, Gervaix A, Schrenzel J. Effects of amoxicillin treatment on the salivary microbiota in children with acute otitis media. Clin Microbiol Infect. 2013;19:E335–E342. doi: 10.1111/1469-0691.12213. [DOI] [PubMed] [Google Scholar]
- 38.Lazarevic V, Whiteson K, Hernandez D, Francois P, Schrenzel J. Study of inter- and intra-individual variations in the salivary microbiota. BMC Genomics. 2010;11:523. doi: 10.1186/1471-2164-11-523. [DOI] [PMC free article] [PubMed] [Google Scholar]
- 39.Lazarevic V, Gaia N, Girard M, Francois P, Schrenzel J. Comparison of DNA extraction methods in analysis of salivary bacterial communities. PLoS One. 2013;8:e67699. doi: 10.1371/journal.pone.0067699. [DOI] [PMC free article] [PubMed] [Google Scholar]
- 40.Charlson ES, Bittinger K, Haas AR, Fitzgerald AS, Frank I, Yadav A, Bushman FD, Collman RG. Topographical continuity of bacterial populations in the healthy human respiratory tract. Am J Respir Crit Care Med. 2011;184:957–963. doi: 10.1164/rccm.201104-0655OC. [DOI] [PMC free article] [PubMed] [Google Scholar]
- 41.Stahringer SS, Clemente JC, Corley RP, Hewitt J, Knights D, Walters WA, Knight R, Krauter KS. Nurture trumps nature in a longitudinal survey of salivary bacterial communities in twins from early adolescence to early adulthood. Genome Res. 2012;22:2146–2152. doi: 10.1101/gr.140608.112. [DOI] [PMC free article] [PubMed] [Google Scholar]
- 42.Zemanick ET, Harris JK, Wagner BD, Robertson CE, Sagel SD, Stevens MJ, Accurso FJ, Laguna TA. Inflammation and airway microbiota during cystic fibrosis pulmonary exacerbations. PLoS One. 2013;8:e62917. doi: 10.1371/journal.pone.0062917. [DOI] [PMC free article] [PubMed] [Google Scholar]
- 43.Barillova P, Tchesnokova V, Dubbers A, Kuster P, Peters G, Dobrindt U, Sokurenko EV, Kahl BC. Prevalence and persistence of Escherichia Coli in the airways of cystic fibrosis patients: an unrecognized CF pathogen? Int J Med Microbiol. 2014;304:415–421. doi: 10.1016/j.ijmm.2014.02.008. [DOI] [PubMed] [Google Scholar]
- 44.Steinkamp G, Wiedemann B, Rietschel E, Krahl A, Gielen J, Barmeier H, Ratjen F. Prospective evaluation of emerging bacteria in cystic fibrosis. J Cyst Fibros. 2005;4:41–48. doi: 10.1016/j.jcf.2004.10.002. [DOI] [PubMed] [Google Scholar]
- 45.Ismaael TG, Zamora EM, Khasawneh FA. Cedecea davisae’s role in a polymicrobial lung infection in a cystic fibrosis patient. Case Rep Infect Dis. 2012;2012:176864. doi: 10.1155/2012/176864. [DOI] [PMC free article] [PubMed] [Google Scholar]
- 46.Hilty M, Burke C, Pedro H, Cardenas P, Bush A, Bossley C, Davies J, Ervine A, Poulter L, Pachter L, et al. Disordered microbial communities in asthmatic airways. PLoS One. 2010;5:e8578. doi: 10.1371/journal.pone.0008578. [DOI] [PMC free article] [PubMed] [Google Scholar]
- 47.Whiteson KL, Bailey BF, Bergkessel MF, Conrad DF, Delhaes LF, Felts BF, Harris JK, Hunter R, Lim YW, Maughan H, et al. The upper respiratory tract as a microbial source for pulmonary infections in cystic fibrosis. parallels from island biogeography. Am J Respir Crit Care Med. 2014;189:1309–1315. doi: 10.1164/rccm.201312-2129PP. [DOI] [PMC free article] [PubMed] [Google Scholar]
- 48.Brook I, Fink R. Transtracheal aspiration in pulmonary infection in children with cystic fibrosis. Eur J Respir Dis. 1983;64:51–57. [PubMed] [Google Scholar]
- 49.Rogers GB, Carroll MP, Serisier DJ, Hockey PM, Jones G, Kehagia V, Connett GJ, Bruce KD. Use of 16S RRNA gene profiling by terminal restriction fragment length polymorphism analysis to compare bacterial communities in sputum and mouthwash samples from patients with cystic fibrosis. J Clin Microbiol. 2006;44:2601–2604. doi: 10.1128/JCM.02282-05. [DOI] [PMC free article] [PubMed] [Google Scholar]
- 50.Blau H, Linnane B, Carzino R, Tannenbaum EL, Skoric B, Robinson PJ, Robertson C, Ranganathan SC. Induced sputum compared to bronchoalveolar lavage in young, non-expectorating cystic fibrosis children. J Cyst Fibros. 2014;13:106–110. doi: 10.1016/j.jcf.2013.05.013. [DOI] [PubMed] [Google Scholar]
- 51.Zhao J, Carmody LA, Kalikin LM, Li J, Petrosino JF, Schloss PD, Young VB. LiPuma JJ. Impact of enhanced Staphylococcus DNA extraction on microbial community measures in cystic fibrosis sputum. PLoS One. 2012;7:e33127. doi: 10.1371/journal.pone.0033127. [DOI] [PMC free article] [PubMed] [Google Scholar]