Abstract
Complex congenital heart disease characterized by the underdevelopment of one ventricular chamber (single ventricle (SV) circulation) is normally treated with a three-stage surgical repair. This study aims at developing a multiscale computational framework able to couple a patient-specific three-dimensional finite-element model of the SV to a patient-specific lumped parameter (LP) model of the whole circulation, in a closed-loop fashion. A sequential approach was carried out: (i) cardiocirculatory parameters were estimated by using a fully LP model; (ii) ventricular material parameters and unloaded geometry were identified by means of the stand-alone, three-dimensional model of the SV; and (iii) the three-dimensional model of SV was coupled to the LP model of the circulation, thus closing the loop and creating a multiscale model. Once the patient-specific multiscale model was set using pre-operative clinical data, the virtual surgery was performed, and the post-operative conditions were simulated. This approach allows the analysis of local information on ventricular function as well as global parameters of the cardiovascular system. This methodology is generally applicable to patients suffering from SV disease for surgical planning at different stages of treatment. As an example, a clinical case from stage 1 to stage 2 is considered here.
Keywords: single ventricle heart, multiscale coupling, finite-element method, lumped parameter model, virtual surgery
1. Introduction
The hypoplastic left (or right) heart syndrome (HLHS or HRHS, respectively) is a complex congenital heart disease encompassing a wide range of cardiac anatomical abnormalities and is characterized by the underdevelopment of one ventricular chamber, which is invariably fatal during the first weeks of life without intervention. Normally, a three-stage surgical repair is performed to obtain separated pulmonary and systemic circulations (figure 1) [1,2]. The technique involves subsequent changes in the circulatory layout, up to a final configuration where the venous return passively flows into the lungs without the need for a pumping chamber, and the functional single ventricle (SV) provides the systemic blood flow. The SV heart is subjected to abrupt changes in the working conditions after each surgical stage as well as to an unusually high work that over time might cause ventricular dysfunction.
Figure 1.
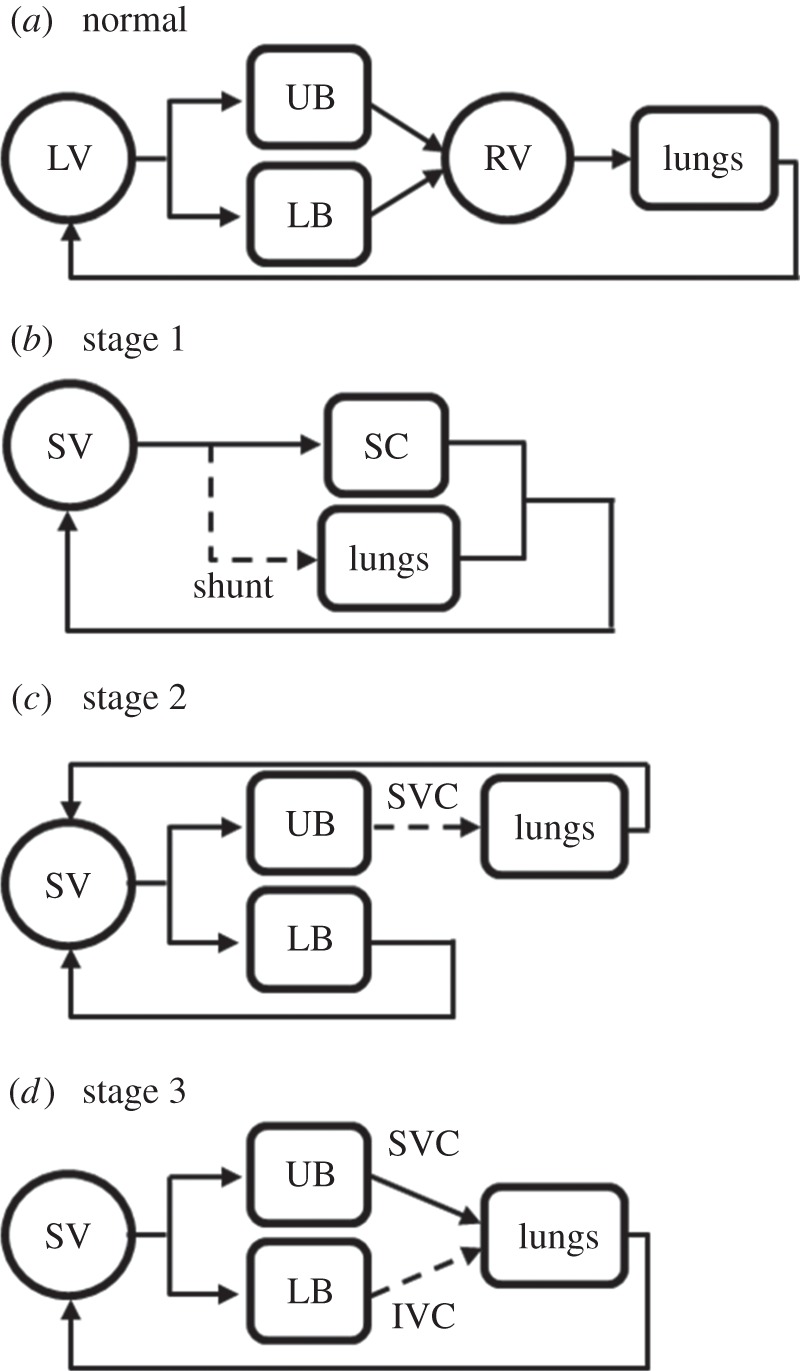
Sketches of normal (a) and pathological circulations (b–d). (b) In parallel Norwood circulation (stage 1), with the interposition of a systemic-to-pulmonary shunt to deliver blood to the lungs; (c) stage 2 circulation with the upper systemic and pulmonary circulations in series; and (d) stage 3 Fontan circulation, with the systemic and pulmonary circulations in series. IVC, inferior vena cava; LB, lower body; LV, left ventricle; RV, right ventricle; SC, systemic circulation; SV, single ventricle; SVC, superior vena cava; UB, upper body.
Over the past three decades, dramatic improvements in the treatment and outcomes for SV diseases have been achieved. Despite major improvements in terms of life expectations, current surgical strategies still remain palliative [3]. Great efforts should be paid to improve the surgical outcomes and consequently the patient quality of life and life expectation.
In this view, patient-specific computational models, able to account for different anatomies and for the associated secondary pathologies, can play an important role to help predict the surgical treatment outcomes. In addition, the improvements in the imaging techniques presently make it easier to build patient-specific models of cardiovascular haemodynamics for both healthy and pathological patients, e.g. the treatment of congenital heart diseases.
In recent years, several models have been proposed in the literature aimed at the evaluation of the surgical planning for congenital heart diseases [4–9]. These models, which describe the vascular area subjected to a surgical treatment in detail (three-dimensional geometries), suffer from a severe limitation owing to the inability to account for the interaction with the rest of the circulation. To overcome this important drawback, multiscale models have been proposed that couple the three-dimensional representation of the surgical site to a lumped parameter (LP) model [10,11] or a one-dimensional model of the circulatory system [12]. An LP model is a dynamic representation of the physics that neglects the spatial variation of parameters and variables, which are assumed to be uniform in each spatial compartment (i.e. zero-dimensional description). Conversely, one-dimensional models include the change of variables along the vessels and account for wave transmission effects within the vasculature. Therefore, an LP model gives rise to a set of ordinary differential equations describing the dynamics in time of the variables in each compartment, whereas one-dimensional models are described by a set of partial differential equations (axial coordinate and time). In the context of cardiovascular system modelling, the LP description is commonly applied to the major components of the system (e.g. cardiac chambers, heart valves and vascular compartments) to evaluate the global distributions of pressure, flow and blood volume.
Patient-specific multiscale models in a closed-loop fashion have been developed to simulate individual haemodynamics changes across those surgeries that significantly modify the circulatory layout [13–16].
Focusing on the detailed description of the SV behaviour, a few computational fluid-dynamic simulations of HLHS patient-specific cases have been recently performed to investigate the efficiency of the filling [17] and to evaluate the reliability of kinetic and viscous energy as clinical markers [18]. The diastolic function in HLHS patient models has been further investigated using personalized ventricular models by means of a fluid–structure analysis [19]. However, clinically measured ventricular inflow and outflow rates were used to prescribe the corresponding velocity boundary conditions in all these works. Hence, such three-dimensional models of SV cannot be applied in surgical planning to investigate the effect of different treatments, because different, unknown boundary conditions have to be prescribed in the post-operative conditions.
A closed-loop approach could solve this issue, because the coupled LP model of the circulation may provide the required new boundary conditions for the SV model.
Modelling SV defects and the change in working conditions owing to the surgical treatment is a challenging task because it requires accounting for different phenomena occurring at different scales. The behaviour of the SV at the organ level is strongly affected by the mechanisms occurring at the tissue level (sarcomere contraction). Moreover, the SV function results from the interaction with the whole circulatory system. Both the above-mentioned interactions call for a multiscale approach. Nevertheless, to the best of our knowledge, a multiscale model of SV cardiovascular system accounting for the three-dimensional anatomy and structure of the ventricle has not been proposed yet.
In this context, the aim of this study is to apply the multiscale computational framework developed by Krishnamurthy et al. [20] to couple, in a closed-loop fashion, a patient-specific three-dimensional finite-element (FE) model of the SV to patient-specific LP models of the pre- and post-operative circulations.
In addition to haemodynamic information (flows and pressures) through the circulatory system, the modelling of the three-dimensional structure of the SV allows the evaluation of local parameters as the myocardial stress and strain distributions, which are fundamental in the evaluation of the performance of the ventricle. Furthermore, global parameters such as pressure–volume (PV) loops and cardiac performance (i.e. cardiac output (CO) and ejection fraction) can also be calculated [21,22].
A key issue in the development of the model is the estimation of both the patient-specific SV properties and the circulatory parameters. To this aim, a sequential approach was carried out in this study. First, the circulatory parameters were estimated by using a closed-loop LP description of both SV and circulation (fully LP model). Then, the SV material parameters and the unloaded reference configuration were identified using the stand-alone three-dimensional FE model of SV. Finally, the fine tuning of these parameters was performed after coupling the three-dimensional model to the LP model of circulation, thus closing the loop. The circulatory parameter identification process was performed using the data clinically acquired before the surgery. Once pre-operative conditions were satisfactorily reproduced, the virtual surgery was performed, and the acute changes in the haemodynamics and the ventricle performance consequent to the surgery were predicted.
2. Material and methods
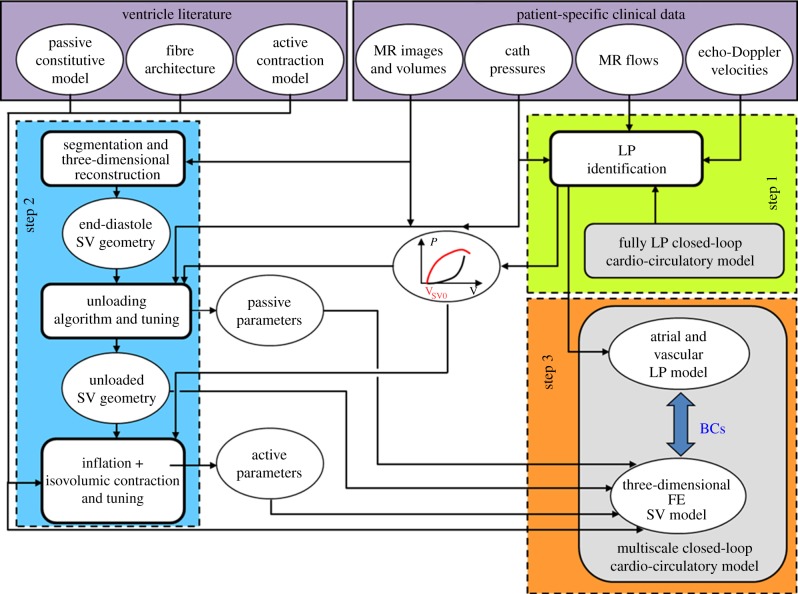
The model presented here relies on a multiscale strategy ranging from the three-dimensional FE model of the SV to the LP model of the circulatory system. The multiscale model comprises a significant number of parameters to be estimated for each patient-specific case, regarding both the material parameters (passive and active) of the myocardium and the resistances, the compliances and the inertances of the LP model. To this aim, and to reduce the computational demand, the sequential approach schematically illustrated in figure 2 was adopted consisting of three main steps. The parameter estimation was carried out by integrating the available clinical data, which were collected before surgery, and the literature information. In this study, the methodology was applied to a clinical case with a hypoplastic right ventricle.
Figure 2.
Workflow of the sequential approach adopted in this study. The parameter estimation of the cardio-circulatory model was performed by means of a fully LP closed-loop model (step 1, green box). The three-dimensional ventricular geometry of the patient was reconstructed from MR images and the myocardial parameters (passive and active models and unloaded geometry) were estimated considering the stand-alone three-dimensional FE model of SV (step 2, blue box). A multiscale closed-loop cardio-circulatory model was created by coupling the LP circulatory model to the three-dimensional FE model (step 3, orange box). Literature information combined with patient-specific clinical data were used during step 1 and step 2 (violet box). (Online version in colour.)
2.1. Clinical pre-operative data
Clinical data for this study were collected at the Medical University of South Carolina (Charleston, SC) after institutional review board approval. Informed consent was obtained from the subject's parents. At the time of data collection, the patient was a three-month-old infant weighing 4.5 kg with a body surface area of 0.26 m2. The baby was born with tricuspid atresia and pulmonary atresia with a severely hypoplastic right heart syndrome, unsuitable for a two ventricle circulation. The functional ventricle was the left one. On the fifth day of life, the patient underwent surgical placement of a right modified Blalock–Taussig shunt with a 4 mm PTFE (polytetrafluoroethylene) graft. His left pulmonary artery was severely stenotic and was augmented with a patch of bovine pericardium.
Clinical data were collected in terms of catheterization-derived pressure tracings, magnetic resonance (MR) flow tracings, MR-derived reconstruction of the SV and echocardiographic Doppler velocity tracings. Clinical measurements were performed prior to the stage 2 procedure. A pre-operative echocardiogram was performed under sedation and followed routine clinical protocols. MR was performed under general anaesthesia, and flow and volume measurements were obtained in different locations. Cardiac catheterization for pre-operative testing was performed under conscious sedation, using an ECG-gated, free-breathing cine-phase contrast velocity-encoded pulse sequence and commercially available cardiac analysis software. Haemodynamic assessment with intracardiac and vascular pressure measurements was obtained using a fluid-filled catheter system.
2.2. Development of the multiscale closed-loop patient-specific model
The patient-specific model was set up following three main steps.
In the first step (step 1, figure 2), the parameter estimation of the cardio-circulatory model was performed by means of a fully LP closed-loop model (figure 3, described in detail in the §2.3.1). The patient-specific parameters of the cardio-circulatory model were obtained through an optimization process described elsewhere [23]. Briefly, a Bayesian estimation of the parameters was performed. Adaptive Markov chain Monte Carlo was employed to obtain the distributions of the model parameters. Then, Nelder–Mead hill-climb optimization was performed from the parameter set that was found to maximize the posterior distribution during the Markov chain Monte Carlo iterations. Optimization was performed to find the patient-specific parameters that best replicated the clinical pre-operatory haemodynamics of the patient in terms of mean, maximum and minimum values of pressures, flows and cardiac volumes. In this phase, the use of a fully LP model to estimate patient-specific circulatory parameters was mandatory to dramatically reduce the computational effort.
Figure 3.
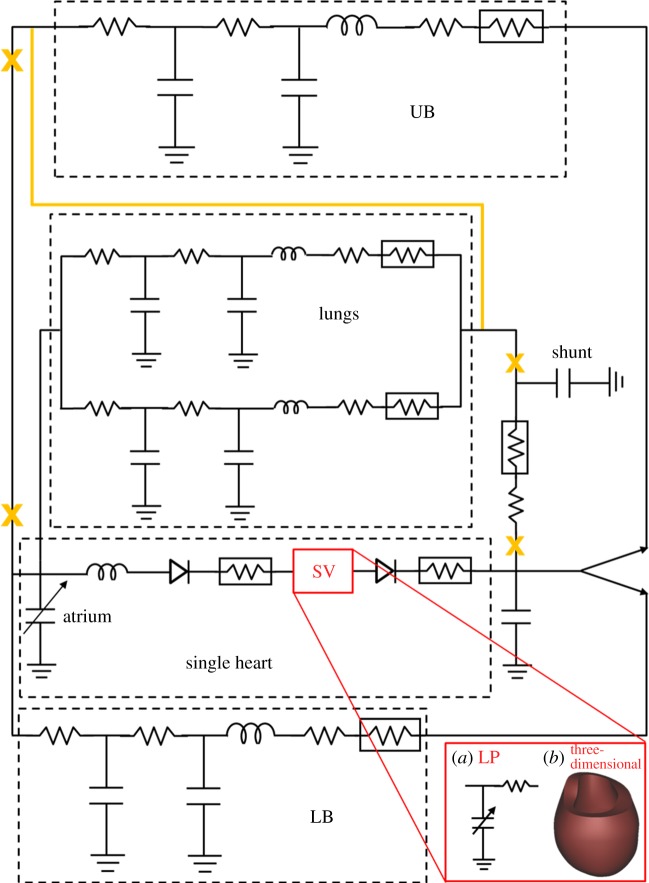
Patient-specific biomechanical model for stage 1 and stage 2. The circulatory layout of stage 1 (continuous black lines) comprised the single heart, the systemic upper body (UB), lower body (LB) and lungs circulations and the shunt. After the stage 2 surgery, the shunt was removed and the UB circulation connected in series to the pulmonary circulation. Changes in the circulatory layout after stage 2 are shown in orange. The single ventricle was modelled as a time-varying elastance in series with a linear resistance for the LP model (red box (a)) to perform parameters identification. To obtain the multiscale model of both stage 1 and stage 2 conditions, the LP model of the SV was replaced by the three-dimensional FE model (red box (b)). (Online version in colour.)
In the second step (step 2, figure 2), the three-dimensional ventricular geometry of the patient was reconstructed from MR images, and the myocardial parameters (passive and active models) were estimated considering the stand-alone three-dimensional FE model of the SV (uncoupled from the circulatory model). First, the unloaded reference state and the myocardial passive properties were identified by means of the iterative method previously developed by Krishnamurthy et al. [20]. Then, the three-dimensional FE model was inflated to three different volumes and isovolumic contractions were simulated, iteratively tuning the active myocardial parameters. Both tuning processes made use, as targets, of the active and passive ventricular elastances obtained from the fully LP optimized model. The tuning strategies are described in §2.3.
Finally (step 3, figure 2), proper haemodynamic boundary conditions were provided to the three-dimensional FE model of SV through its coupling to the LP model of univentricular circulation; a multiscale closed-loop cardio-circulatory model was then created. The results previously obtained from the fully LP model were used as the initial conditions for the multiscale model. At this point, a further fine-tuning of active parameters was carried out to ensure that the multiscale model well replicated the clinical data of the patient.
In both steps 2 and 3, the three-dimensional model was subjected to proper kinematic boundary conditions to prevent displacement and rotation of the base along the long axis.
The optimization process and the fully LP closed-loop circulatory model were carried out in Matlab (The MathWorks, Inc., Natick, MA), whereas the FE simulations were performed using Continuity 6.4 (National Biomedical Computation Resource, University of California, San Diego, CA).
2.3. Components of the multiscale closed-loop patient-specific model
In the following sections, a detailed description of the various components of the LP circulatory model and the three-dimensional FE SV model, composing the multiscale model, is provided.
2.3.1. Circulatory model
Two LP models of the circulation were developed corresponding to stage 1 and stage 2 of Fontan surgical procedures. The cardio-circulatory layout (figure 3) comprised four main blocks to model the single heart, the systemic upper (UB) and lower (LB) body circulations and the lungs. For the sake of simplicity and in the absence of any clinical information, coronary circulation, gravity and respiratory effects were neglected in the present case study.
The single atrium was described as a time-varying elastance which may actively contract according to a sinusoidal activation function. Both the atrioventricular and outflow valves were described by nonlinear diodes to enforce unidirectional flow. Valve inertial effects were directly implemented with an inertance for the atrioventricular valve and included in the downstream arterial parameters for the outflow valve. Valve parameters were calculated as a function of the measured valve area [24].
Each peripheral vascular region was modelled by means of an RLC–R–CR block describing arteries, capillary bed and veins. For stage 1, a resistive block mimicking the systemic-to-pulmonary shunt was added, including linear and nonlinear components accounting for both distributed and localized energy dissipations. Shunt parameters were expressed as functions of the shunt diameter as described in Migliavacca et al. [25]. The shunt model was removed when stage 2 was simulated (see §2.4).
To perform the parameter identification (previously described as step 1 of figure 2), the stage 1 LP circulatory model was coupled with an LP model of the SV (figure 3, red box (a)). This simplified LP model of the SV consisted of a time-varying nonlinear elastance (accounting for the active and passive properties of the ventricle) in series with a resistance mimicking the viscous behaviour of the myocardium [13,16]. The myocardium contraction was ruled by a sinusoidal activation function. The use of an LP of the SV model was mandatory in this step to obtain parameter estimation with a reasonable computational effort. After the circulatory parameters were correctly identified, the LP circulatory network (i.e. atrial and vascular models) was coupled to the three-dimensional FE model of the SV to create the multiscale model (figure 3, red box (b)). Lastly, the LP circulatory layout was changed as illustrated in figure 3 (orange colour) to simulate the post-operative state. For a detailed description of the general equations governing the LP circulatory model, the reader is referred to appendix A.
2.3.2. Three-dimensional finite-element model of the single ventricle
A model of the left ventricular anatomy was reconstructed from MR images of the investigated paediatric patient, suffering by hypoplastic right heart syndrome. The manual segmentation was performed based on 50 slices equally spaced of 1 mm with respect to the ventricular long axis and with a spatial in-plane resolution of 0.25 × 0.25 mm. Because the in vivo MR images were acquired at the end-diastole (ED), the reconstructed geometry was further processed (see §§2.3.3). Indeed, to correctly compute stresses, an unloaded reference state must be identified, defined as the state at which the ventricle cavity pressure, in a passive state, is zero.
The domain discretization of the ED geometry was performed using hexahedral cubic-Hermite FE mesh. Geometries represented by means of Hermite interpolation guarantee C1 continuity on the boundary between adjacent elements, as the degrees of freedom of this mesh are both nodal coordinate values and nodal derivatives. This description yields a smooth description of the shape, which represents a great advantage when dealing with soft tissue simulations.
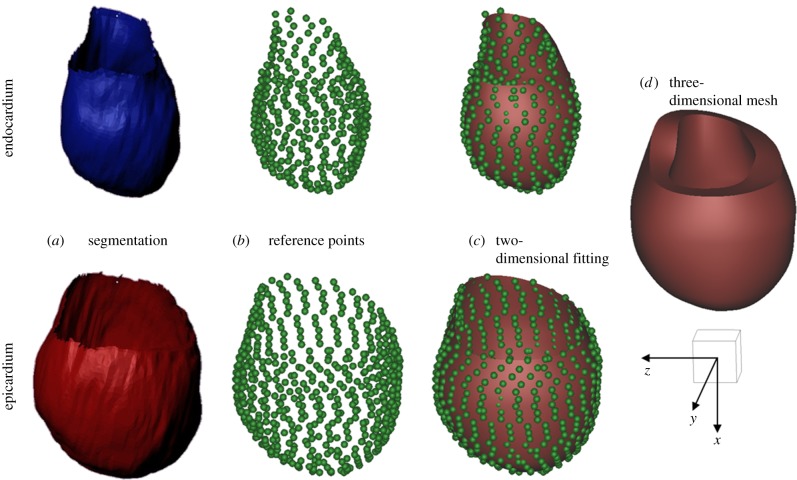
First, the endocardial and epicardial surfaces of the SV at ED were identified and manually segmented (figure 4a). Second, a simplified two-dimensional cubic-Hermite template mesh (80 nodes and 64 elements) was defined in a prolate spheroidal coordinates system consisting of two nested surfaces representing the endocardial and epicardial surfaces. The template was then fitted in the radial coordinate to the reconstructed data (figure 4b,c). For a detailed description of the method the reader is referred to reference [26]. The obtained surface meshes were then converted into three-dimensional hexahedral cubic-Hermite elements in rectangular Cartesian coordinates. In order to better define the transmural fibre orientation gradient, the mesh was refined across the myocardial wall thickness to a final resolution of 120 nodes and 64 elements (figure 4d).
Figure 4.
Scheme of the mesh development: (a) segmentation of the endocardial and epicardial surfaces of the SV at end-diastole; (b) identification of the reference points lying of the endocardial and epicardial surfaces; (c) fitting of the two-dimensional cubic-Hermite template mesh to the reference points; and (d) final three-dimensional mesh of the single ventricle (120 nodes and 64 elements). A scale cube (1 cm3) and the Cartesian coordinate system are shown. (Online version in colour.)
The three-dimensional FE model also included a myofibre and sheet architecture. Fibres were assumed to be tangential to the endocardial and epicardial surfaces, so that the material anisotropy of the ventricular wall was defined by referring to an orthogonal system of local material coordinates, having one axis aligned with the muscle fibre direction. The fibre angle at any point in the model was given by an interpolation of the fibre field parameters defined at the same nodal positions used to define the ventricular geometry. The measured transmural distribution of fibre and sheet angles was approximated using trilinear Lagrange basis functions.
As specific information on the patient-specific fibre orientation was not available, fibre architecture was assumed as in physiological adult ventricles. Because the functional ventricle of the considered patient was the left ventricle, a fibre orientation ranging from −60° at the endocardium to +60° at the epicardium (with respect to the circumferential direction) was assumed [27].
2.3.3. Passive properties and unloaded geometry
The passive material properties of the myocardium were described using the transversely isotropic form of the Holzapfel constitutive model [28]. If the myocardium is described as an incompressible medium with only one family of fibres perfectly aligned along their mean direction, the strain energy function includes two exponential terms, accounting for the isotropic matrix and the anisotropy of the fibres. For a detailed description of the constitutive equation the reader is referred to appendix B. Two material parameters had to be estimated to reproduce a patient-specific behaviour of passive ventricle.
The myocardial passive material parameters were estimated together with the identification of the unloaded geometry. To this aim, an iterative method previously developed by Krishnamurthy et al. [20] was adopted. This unloading algorithm (step 2 in figure 2) was able to estimate the unloaded geometry on the basis of the ED ventricular model, if the ED pressure (measured) and the unloaded volume (assumed) were known, whereas the passive material parameters were iteratively tuned. As the initial guess, the material parameters of the model were chosen based on literature experimental biaxial tests performed on ex vivo canine myocardial tissue [29,30]. Starting from this information, the passive material parameters were manually tuned, until an unloaded geometry that matched the unloaded volume was obtained. This unloaded geometry, when inflated to ED pressure, led to a loaded geometry that well approximated the original ED fitted mesh.
The unloading algorithm was based on the multiplicative decomposition of the deformation gradient tensor, as described in tissue growth modelling [31]. The iterative estimation scheme aimed at finding the unloaded reference geometry that minimized the difference between the measured ED geometry and the computed geometry when the unloaded model was inflated to the measured ED pressure, given nonlinear myocardial material properties. In the first step, the fitted ED model was chosen to be the first guess unloaded state and inflated to the measured ED pressure in the patient. The inverse of the resulting deformation tensor (computed between the inflated geometry and the fitted ED geometry) was then applied to the measured ED geometry to compute a new unloaded geometry. If the associated volume deviated from the assumed unloaded volume (VSV0), the material stiffness was changed (e.g. if the FE model unloaded volume was smaller than the assumed volume, the material stiffness was increased). This sequence was then iterated until a suitable unloaded geometry was obtained with a cavity volume equal to VSV0.
In the work of Krishnamurthy et al. [20], the estimation of the unloaded volume was based on an empirical relation [32], as a function of the ED pressure and volume, which was found to fit the measurements in human adults and animal hearts in healthy and disease conditions. However, this relation could not be applied to paediatric patients because it provided unrealistic results (unloaded volumes always larger than end-systolic volume). Hence, in this work, the unloaded volume resulting from the circulatory layout parameters optimization (step 1) was adopted as VSV0.
Once the unloaded geometry was obtained and the appropriated passive material properties were identified, the ED geometry measured from the MR images was obtained by inflating the unloaded geometry up to the ED pressure.
2.3.4. Active material model
The model proposed by Lumens et al. [33] was adopted to describe the active contractility properties of the myocardium. This phenomenological representation of sarcomere contraction simulates experiments on isolated rat cardiac muscle. For a detailed description of the active model, the reader is referred to appendix B.
Briefly, the sarcomere was modelled as a passive element in parallel with a series combination of a contractile element and an elastic element. The time-dependent law of the contractile element depends on two state variables, i.e. the length of the contractile element and the mechanical activation. The mechanical activation function represents the complex phenomena occurring at the intracellular level, whereas the sarcomere length is obtained from the myofibre strain. The length of the series elastic element and the myofibre force–velocity relation linearly determines the time derivative of the sarcomere length. The time derivative of the mechanical activation separately accounts for the rise and decay of the mechanical activation. The parameters of the myocardium active model to be estimated are the active stress scaling coefficient and the scaling factors of the activation time-function. A suitable patient-specific value for the first parameter was assessed by manual tuning, and use of the active ventricular elastance obtained from the fully LP optimized model (see step 2 in figure 2). Namely, the stand-alone three-dimensional FE model of the SV was inflated up to three different volumes. Isovolumic contractions were simulated, and the ventricular pressure was evaluated at maximum contraction. The active stress scaling coefficient was iteratively tuned until the obtained pressures matched those deduced from the fully LP model. Finally, starting from the activation function obtained from the fully LP optimized model, the scaling factors of the contraction time-function were finely calibrated until the response of the multiscale closed-loop model well reproduced the clinical data.
2.4. Simulation of the surgical procedure
Once the pre-operatory conditions of the clinical case were satisfactory simulated with the multiscale model, a virtual surgery was performed by changing the layout of the LP circulatory model. Figure 3 shows the difference between stage 1 and stage 2 circulatory layouts: the shunt was removed, the UB circulation was disconnected from the atrium and connected to the lungs. In the absence of specific information, the parameters of the circulatory model were assumed to be unchanged from the pre-operative situation, thus simulating an acute change. Similarly, the myocardial properties of the three-dimensional SV model remained unchanged.
Simulations results were represented in the form of global circulatory outputs (both mean values and time tracings) and local effects in the cardiac wall (myofibre stress and strain at different time points of the cardiac cycle).
The predicted post-operative conditions were compared with the pre-operative ones to assess haemodynamic effects of the performed surgery.
3. Results and discussion
3.1. Set-up of the patient-specific pre-operative model
The results of the simulation of the patient pre-operatory conditions after the optimization process are summarized in table 1. Results from the fully LP model and the multiscale model were reported against the pre-operative clinical data. An overall good agreement was obtained for both models in describing the main clinical quantities, with an error lower than 5%. A proper CO indicates a satisfactory description of ventricular–arterial and venous–atrial couplings. Moreover, the correct repartition of flows to the systemic (Qub and Qlb) and pulmonary circulations (Qp) ensures a good modelling of the systemic-to-pulmonary shunt.
Table 1.
Comparison between the clinical data, the results from the fully LP and the multiscale models for stage 1 and those from the multiscale model for stage 2. CO, cardiac output; EDV, end-diastolic volume; mPao, mean aortic pressure; maxPao, maximum aortic pressure; minPao, minimum aortic pressure; mPsa, mean atrial pressure; mPpa, mean pulmonary pressure; maxPsv, maximum single ventricle pressure; mQp, mean pulmonary flow; mQub, mean upper body flow; mQlb, mean lower body flow.
| stage 1 |
stage 2 |
|||
|---|---|---|---|---|
| clinical | fully LP | multiscale | multiscale | |
| CO (ml s−1) | 27.4 | 27.5 | 26.7 | 20.3 |
| EDV (ml) | 28.0 | 27.1 | 28.7 | 26.3 |
| mPao (mmHg) | 52–54 | 55.1 | 53.9 | 74.1 |
| maxPao (mmHg) | 78–84 | 81.9 | 81.5 | 95.8 |
| minPao (mmHg) | 28–32 | 31.2 | 31.7 | 55.5 |
| mPsa (mmHg) | 6–8 | 7.9 | 7.8 | 4.6 |
| mPpa (mmHg) | 16–18 | 17.1 | 16.9 | 14.4 |
| maxPsv (mmHg) | 80–87 | 82.8 | 83.3 | 96.7 |
| mQp (ml s−1) | 12.0 | 12.1 | 11.7 | 12.8 |
| mQub (ml s−1) | 10.0 | 10.2 | 10.1 | 12.8 |
| mQlb (ml s−1) | 5.1 | 5.2 | 4.9 | 7.5 |
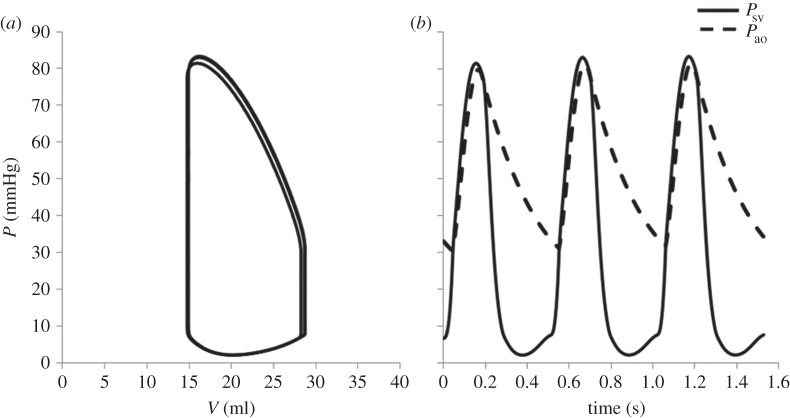
Focusing on the multiscale model results, figure 5 shows the pressure–volume loop (a) and pressure tracings (b) of the single ventricle (Psv) and of the aorta (Pao) for three consecutive cardiac cycles. It is worth observing that a steady behaviour was obtained after only two cycles (difference lower than 1% between subsequent cycles). The use of the initial values provided by the fully LP model allowed us to limit the simulation to a few cardiac cycles, with an effective cost reduction in computation time.
Figure 5.
Haemodynamic results of the stage 1 multiscale model for three consecutive cardiac cycles. (a) Pressure–volume loop; and (b) pressure tracings of the single ventricle (Psv, solid) and the aorta (Pao, dashed).
It is also worth noting that although the active material parameters of the stand-alone three-dimensional SV model were adjusted on the basis of the elastances obtained after the fully LP model optimization, a finer tuning was still required to match the patient behaviour when the multiscale model was used. This was mainly due to the different description of the myocardium contractility, in particular to the effects of the velocity of contraction. Indeed, while the LP model of SV in the fully LP model accounted for a constant viscosity of the myocardium acting when the SV volume changes, the viscous term included in the active model of the three-dimensional model relied on a more complex description based on sarcomere mechanics [33]. However, only a few iterations were needed to obtain a good prediction of the patient pre-operatory behaviour, thus limiting the overall computational cost.
3.2. Simulation of stage 1 to stage 2 surgery
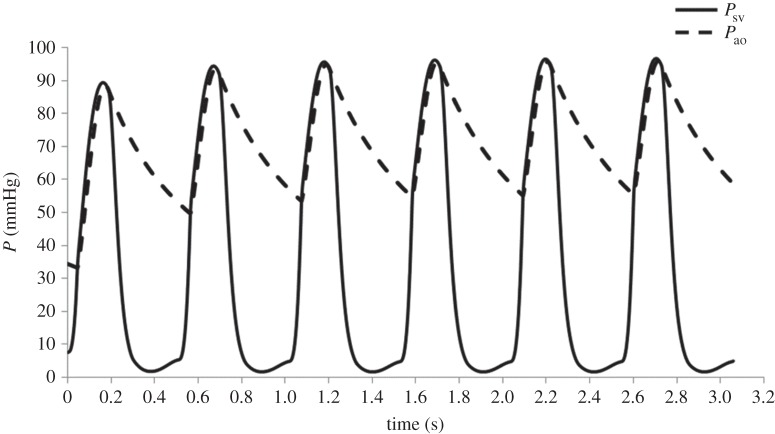
The changes in the circulatory layout, simulating the surgery between stage 1 and stage 2, led to an increase in the afterload and to a decrease of the preload of the SV. Figure 6 shows the pressure tracings (Psv, Pao) of six consecutive cardiac cycles after the circulatory model was changed to simulate the surgery. Simulation of six cardiac cycles was necessary to reach a steady state (difference in pressure lower than 1% between two subsequent cycles).
Figure 6.
Multiscale model pressure tracings of the single ventricle (Psv, solid) and the aorta (Pao, dashed) for six consecutive cardiac cycles after the circulatory layout was changed from stage 1 to stage 2 to simulate the surgical procedure.
Figure 7 shows the pre-operatory and post-operatory pressure–volume loops. As a consequence of the surgery, it is interesting to observe a significant decrease of the stroke volume (from 13.7 to 10.4 ml) with a slight increase in end-systolic volume together with larger decrease of ED volume.
Figure 7.
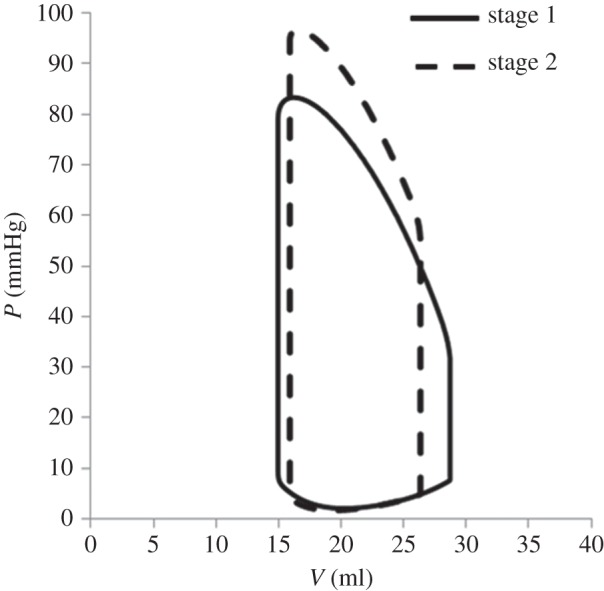
Comparison between the pre-operatory and post-operatory pressure–volume loops obtained from the multiscale model.
The comparison of the multiscale haemodynamic results for stage 1 and stage 2 conditions is reported in table 1 (last two columns). It is worth noting that the post-operative model predictions were not validated, because post-operative clinical data were not available owing to the patient's good and stable condition. A decrease in the CO of about 25%, together with an increase of the ventricular peak pressure (17%), can be noted. Mean aortic pressure increases (from 53.9 to 74.1 mmHg); similar increments also occurred in both systolic and diastolic values. Conversely, the atrial pressure decreased of about 40%. These significant changes were expected with ventricle volume unloading and afterload increasing. In stage 1 circulation, the total resistance was composed of three resistances in parallel: UB and LB systemic vascular resistances and the series of shunt and pulmonary vascular resistances (PVR). After stage 2 surgery, the shunt resistance was removed, whereas the UB is connected in series with the PVR. As a consequence, the total afterload of the heart increased post-operatively. The ventricular unloading represented a beneficial change, because the ventricle operated at a lower ED volume, thus reducing the risk of critical conditions that could lead to sarcomere decompensation.
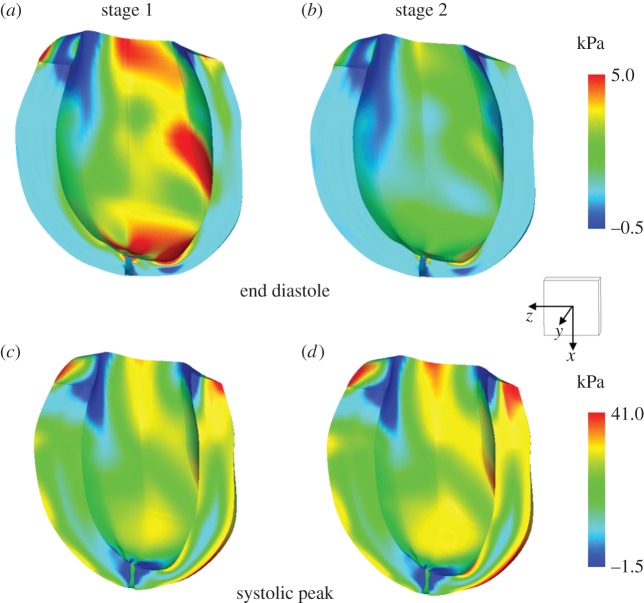
The stress and strain distributions in the myocardial wall were evaluated for both the stage 1 and stage 2 conditions. Figure 8 shows the stress pattern for both the pre-operative and post-operative conditions at ED (upper panels) and at systolic peak (lower panels). Concerning ED, a reduction of the maximum stress in the myocardium was observed from stage 1 (5 kPa) to stage 2 (3.9 kPa) as well as in the overall values. This reduction of myocardial stress was a consequence of the change of the layout of the circulation, which leads to the unloading of the ventricle. As expected, the stress pattern distribution was preserved in the two cases. Indeed, the simulation of the stage 2 surgical procedure represented an acute condition, thus the remodelling process associated with chronic condition was neglected. With respect to the systolic peak, an opposite trend was observed. Indeed, a higher systolic peak pressure was found in stage 2 with respect to stage 1 as shown in figure 7.
Figure 8.
Stress distributions in the fibre direction (kPa) at end-diastole (a,b) and at systolic peak (c,d) for the pre-operatory (stage 1) and post-operatory (stage 2) conditions obtained from the multiscale model. A scale cube (1 cm3) and the Cartesian coordinate system are shown. (Online version in colour.)
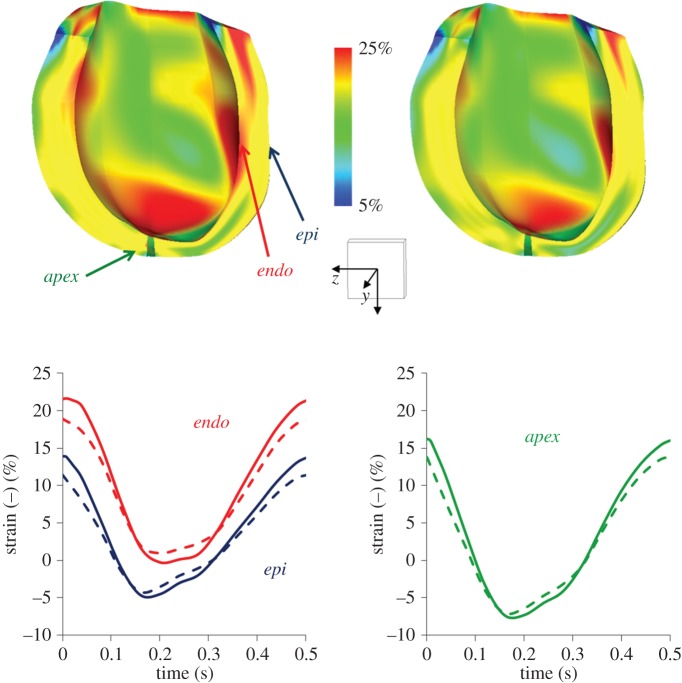
The end-diastolic strains in the fibre direction are depicted in figure 9, at the stage 1 and stage 2 end-diastole. An overall reduction of the fibre strains in the stage 2 was found with respect to stage 1. In stage 1, significant portions of the myocardial wall were subjected to fibre strains ranging from 20% to 25%. These values are known to be rather critical because they are very close to sarcomere decompensation. Both for stage 1 and stage 2 conditions, the time profile of the myocardial strains computed at different locations (points at epicardial and endocardium middle cross section and at the apex) are shown in figure 9. A reduction of maximum strain in stage 2 was observed in all locations. A lower strain variation from ED to end-systole was observed in stage 2 (endocardium: 16%; epicardium: 14.5%; apex: 20.7%) with respect to stage 1 (endocardium: 22%; epicardium: 19%; apex: 23%).
Figure 9.
Strain pattern in the fibre direction for the stage 1 and stage 2 obtained from the multiscale model. The colour map (upper panels) shows the fibre strain at end-diastole. The time profile of the myocardial strains (lower panels) at different locations (points at epicardial (epi) and endocardium (endo) middle cross section and at the apex (apex)) are shown. The solid lines indicate the stage 1 results, whereas the dashed lines refer to stage 2 results. A scale cube (1 cm3) and the Cartesian coordinate system are shown. (Online version in colour.)
3.3. Possible use of the model for clinical support
The multiscale model presented might be useful in the evaluation of the acute post-operative outcomes. Indeed, the surgical procedure leads to an abrupt alteration of the working conditions of the SV which are typically hardly predictable. In addition, the timing of the surgical treatment is critical and based on the clinical experience of the surgeons. In this view, the multiscale model can be used to simulate a number of different surgical scenarios, thus providing important information to assist the surgeon in the decision-making process. Moreover, this information can help customize the post-operative pharmacological treatment.
The systematic application of this methodology to a number of SV patients could provide further insights into material properties and fibre orientation data for this pathology, still lacking in the literature. Indeed, the material parameters and fibre orientation could be calibrated, so that the kinematic outcomes of the multiscale model (i.e. myocardial wall displacement and deformation) reproduce the four-dimensional displacement field of the patient. In addition, the study of the two different groups of SV patients (HLHS and HRHS) could highlight both inter- and intragroup variability, thus improving the understanding of such a complex pathology.
4. Limitations
The proposed computational framework represents a robust tool to couple a patient-specific three-dimensional model of SV and an LP model of the circulatory network. The framework easily enables the simulation of different circulatory models to describe several surgical treatment scenarios. Nevertheless, the model has a number of limitations.
First, the main limitation of this study is that the model results were not validated against clinical data. The model parameters were identified to replicate the pre-operative patient haemodynamic quantities. Concerning the pre-operative state, a validation process will be performed as soon as more detailed clinical data (e.g. four-dimensional displacement field of the myocardium) are available for stage 1 patients. Regarding the post-operative results, no data were collected for the investigated patient, as they would require invasive and unnecessary clinical exams. In addition, the simulations of the surgical treatment were performed assuming unchanged material and circulatory model parameters. However, no quantitative information is presently available to describe possible active changes or adaptations of the cardiovascular system in this kind of paediatric patients.
Second, owing to the lack of patient-specific measurement, a fibre architecture consistent with the literature physiological data was assumed. Fibre orientation in pathological conditions may be significantly different with respect to the physiological case. Moreover, the estimation of the material anisotropy may be incorrect. To this issue, the combination of the three-dimensional cine MR images measurement with the already available clinical data can provide important information. Indeed, the four-dimensional displacement field of the myocardium might be used to validate our assumptions.
5. Conclusion
In this paper, a multiscale approach used to simulate patient-specific biomechanics in the case of SV defect was presented. The modelling process integrated clinical data, including MR imaging, catheterization and echocardiography, to develop a patient-specific model able to account for the main features of the patient physiology. Our approach involved distinct steps: optimization of patient-specific parameters of both the three-dimensional SV and the LP circulatory model, creation of the multiscale pre-operative model and modification of the circulatory layout for post-operative simulations.
The methodology proposed was then applied to model a single patient-specific stage 2 surgery. Nevertheless, the methodology is generally applicable to further patient-specific cases suffering from both hypoplastic left heart syndrome and hypoplastic right heart syndrome. Virtual surgical planning at different stages of the treatment can also be easily simulated by changing the layout of the circulatory model.
Acknowledgements
The authors acknowledge the use of the optimization code granted by Dr Daniele Schiavazzi from University of California, San Diego, CA, USA and Dr Alessia Baretta from Politecnico di Milano. The authors thank Dr Chiara Corsini from Politecnico di Milano for the useful discussions during the preparation of the manuscript.
Appendix A. Equations of the circulatory models
The general equations used in the LP description of the circulation are presented here.
All the circulatory blocks (UB and LB circulations, right and left pulmonary circulations) were described by means of RLC–R–CR blocks. The following equations (one algebraic and two differential) were used to describe the blood pressure and volume.
| A 1 |
| A 2 |
| A 3 |
In the equations, R, C and L refer, respectively, to the generic resistance, compliance and inertance of each vascular block. The terms Pup, Pdw, Qup and Qdw represent the generic pressures (P) and volumes (Q) upstream and downstream from each component.
The aortic valve was described by means of diode with nonlinear resistance Kao. The pressure drop across the valve was calculated based on
| A 4 |
where Psv is the SV pressure, Pao and Qao represent the pressure downstream and the flow across the valve. Rmyo is a term accounting for the viscous behaviour of the myocardium and Kao in the nonlinear resistance of the valve.
The flow across the valve was then ruled by the following equations
 |
A 5 |
The atrioventricular valve was modelled as a diode with nonlinear resistance in series with an inertance. The pressure drop across the valve is
| A 6 |
where Psa is the pressure in the single atrium, Lav and Kav are the atrioventricular inertance and nonlinear resistance and Qav is the atrioventricular flow.
The flow across the valve was defined as follows
 |
A 7 |
Single-atrium and single-ventricle were described by means of time-varying elastances accounting for the active and the passive behaviour of the myocardium. The pressure generated by a generic chamber was defined as
 |
A 8 |
where ch = sv, sa indicates the single-ventricle and the single-atrium. The viscous term Rmyo was considered only for the ventricle. Ventricular active pressure–volume relationship was considered nonlinear, whereas a linear relation was considered for the atrium. Both atrial and ventricular passive pressure–volume relationships were described with a nonlinear relation.
The following equations were used
| A 9 |
| A 10 |
| A 11 |
| A 12 |
where Vsv0 and Vsa0 are the unstressed volumes of each cardiac chamber (i.e. the volume at zero pressure), a, b, csv and dsv are model parameters specific to the single-ventricle, whereas Csa, csa and dsa are model parameters specific to the single atrium.
The term Ach(t) in equation A 8 ranges from 0 during diastole and 1 at the end of systole. It describes the excitation–relaxation pattern of the sarcomeres and is defined as
 |
A 13 |
 |
A 14 |
where ts and tsa are atrial and ventricular systole durations.
Model parameters for the patient-specific case are available upon request to the authors.
Appendix B. Models of passive and active mechanics
The equations modelling the passive and active mechanics are described here.
The transversely isotropic form of the constitutive model developed by Holzapfel & Ogden [28] was assumed to model the passive properties of the resting myocardium. In this model, the anisotropy in the fibre and cross-fibre directions of the myocardium has been accounted using separate exponential terms with different exponents. Equation (B 1) gives the equation for the strain energy
| B 1 |
where a, b, af, bf are material constants, the a parameters having dimension of stress, whereas the b parameters are dimensionless. I1 is the first invariant of the right Cauchy–Green strain tensor (isotropic term), I4f are the components of the right Cauchy–Green strain tensor in the fibre direction (transversely isotropic term).
The active model from Lumens et al. [33] was used to model the active behaviour of the myocardial fibres. In this model, the sarcomere has been modelled as a passive element in parallel with a series of a contractile element and an elastic element. The active stress (σf,act) added to the Piola–Kirchoff stress tensor to account for the contribution of fibre contraction, was defined as
| B 2 |
where sact is a factor scaling the active myofibre stress, C the mechanical activation, Lsc the contractile element length, Lsc0 the contractile element length with zero load, Lsc the sarcomere length and Lsc,iso the length of isometrically stressed elastic element. The active stress depends on two state variables (i.e. the sarcomere length Lsc and the mechanical activation C). The time derivative of Lsc can be written as
| B 3 |
The time derivative of C is
| B 4 |
where τR and τD are scaling rise and decay time, respectively, t and Crest represent time and diastolic resting level of activation, respectively, and CL, FR and T are functions describing the increase of activation with the sarcomere length, the rise of mechanical activation and the decrease of activation duration with decrease of sarcomere length, respectively.
Contributor Information
Collaborators: Modeling of Congenital Hearts Alliance (MOCHA) Group, Andrew Taylor, Alessandro Giardini, Sachin Khambadkone, Silvia Schievano, Marc de Leval, T. -Y. Hsia, Edward Bove, Adam Dorfman, G. Hamilton Baker, Anthony Hlavacek, Francesco Migliavacca, Giancarlo Pennati, Gabriele Dubini, Alison Marsden, Jeffrey Feinstein, Irene Vignon-Clementel, Richard Figliola, and John McGregor
Funding statement
This study was supported by a grant from the Fondation Leducq, Paris, France. The authors gratefully acknowledge use of the software Continuity 6.4 granted by the National Biomedical Computation Resource (NIH grant no. P41 GM103426).
References
- 1.de Leval MR, Deanfield JE. 2010. Four decades of Fontan palliation. Nat. Rev. Cardiol. 7, 520–527. ( 10.1038/nrcardio.2010.99) [DOI] [PubMed] [Google Scholar]
- 2.Algra SO, Breur JMPJ, Evens FCM, de Roo F, Schoof PH, Haas F. 2011. Improving surgical outcome following the Norwood procedure. Neth. Heart J. 19, 369–372. ( 10.1007/s12471-011-0171-8) [DOI] [PMC free article] [PubMed] [Google Scholar]
- 3.Feinstein JA, et al. 2012. Hypoplastic left heart syndrome: current considerations and expectations. J. Am. Coll. Cardiol. 59, 1–42. ( 10.1016/j.jacc.2011.09.022.) [DOI] [PMC free article] [PubMed] [Google Scholar]
- 4.De Zélicourt DA, Pekkan K, Parks J, Kanter K, Fogel M, Yoganathan AP. 2006. Flow study of an extracardiac connection with persistent left superior vena cava. J. Thorac. Cardiovasc. Surg. 131, 785–791. ( 10.1016/j.jtcvs.2005.11.031) [DOI] [PubMed] [Google Scholar]
- 5.Pekkan K, Whited B, Kanter K, Sharma S, De Zélicourt DA, Sundareswaran K, Frakes D, Rossignac J, Yoganathan AP. 2008. Patient-specific surgical planning and hemodynamic computational fluid dynamics optimization through free-form haptic anatomy editing tool (SURGEM). Med. Biol. Eng. Comput. 46, 1139–1152. ( 10.1007/s11517-008-0377-0) [DOI] [PubMed] [Google Scholar]
- 6.Haggerty CM, De Zelicourt DA, Sundareswaran KS, Pekkan K, Whited B, Rossignac JR, Fogel MA, Yoganathan AP. 2009. Hemodynamic assessment of virtual surgery options for a failing Fontan using lumped parameter simulation. Comput. Cardiol. 36, 389–392. [Google Scholar]
- 7.Marsden AL, Bernstein AJ, Reddy VM, Shadden SC, Spilker RL, Chan FP, Taylor CA, Feinstein JA. 2009. Evaluation of a novel Y-shaped extracardiac Fontan baffle using computational fluid dynamics. J. Thorac. Cardiovasc. Surg. 137, 394–403. ( 10.1016/j.jtcvs.2008.06.043) [DOI] [PubMed] [Google Scholar]
- 8.Pekkan K, Dasi LP, De Zélicourt DA, Sundareswaran KS, Fogel MA, Kanter KR, Yoganathan AP. 2009. Hemodynamic performance of stage-2 univentricular reconstruction: Glenn vs. Hemi-fontan templates. Ann. Biomed. Eng. 37, 50–63. ( 10.1007/s10439-008-9591-z) [DOI] [PMC free article] [PubMed] [Google Scholar]
- 9.Vignon-Clementel IE, Marsden AL, Feinstein JA. 2010. A primer on computational simulation in congenital heart disease for the clinician. Prog. Pediatr. Cardiol. 30, 3–13. ( 10.1016/j.ppedcard.2010.09.002) [DOI] [Google Scholar]
- 10.Laganà K, Dubini G, Migliavacca F, Pietrabissa R, Pennati G, Veneziani A, Quarteroni A. 2002. Multiscale modelling as a tool to prescribe realistic boundary conditions for the study of surgical procedures. Biorheology 39, 359–364. [PubMed] [Google Scholar]
- 11.Vignon-Clementel IE, Figueroa CA, Jansen KE, Taylor CA. 2010. Outflow boundary conditions for 3D simulations of non-periodic blood flow and pressure fields in deformable arteries. Comput. Methods Biomech. Biomed. Eng. 13, 625–640. ( 10.1080/10255840903413565) [DOI] [PubMed] [Google Scholar]
- 12.Vignon-Clementel IE, Figueroa AC, Jansen KE, Taylor CA. 2006. Outflow boundary conditions for three-dimensional finite element modeling of blood flow and pressure in arteries. Comput. Methods Appl. Mech. Eng. 195, 3776–3796. ( 10.1016/j.cma.2005.04.014) [DOI] [Google Scholar]
- 13.Baretta A, et al. 2011. Virtual surgeries in patients with congenital heart disease: a multiscale modelling test case. Phil. Trans. R. Soc. A 369, 4316–4330. ( 10.1098/rsta.2011.0130) [DOI] [PubMed] [Google Scholar]
- 14.Baretta A, Corsini C, Marsden AL, Vignon-Clementel IE, Hsia TY, Dubini G, Migliavacca F, Pennati G. 2012. Respiratory effects on hemodynamics in patient-specific CFD models of the Fontan circulation under exercise conditions. Eur. J. Mech. B Fluids 35, 61–69. ( 10.1016/j.euromechflu.2012.01.012) [DOI] [Google Scholar]
- 15.Kung E, et al. 2013. Predictive modeling of the virtual Hemi-Fontan operation for second stage single ventricle palliation: two patient-specific cases. J. Biomech. 46, 423–429. ( 10.1016/j.jbiomech.2012.10.023) [DOI] [PubMed] [Google Scholar]
- 16.Corsini C, et al. 2014. An integrated approach to patient-specific predictive modeling for single ventricle heart palliation. Comput. Methods Biomech. Biomed. Eng. 17, 1572–1589. ( 10.1080/10255842.2012.758254) [DOI] [PMC free article] [PubMed] [Google Scholar]
- 17.de Vecchi A, Nordsletten DA, Remme EW, Bellsham-Revell H, Greil G, Simpson JM, Razavi R, Smith NP. 2012. Inflow typology and ventricular geometry determine efficiency of filling in the hypoplastic left heart. Ann. Thorac. Surg. 94, 1562–1569. ( 10.1016/j.athoracsur.2012.05.122) [DOI] [PubMed] [Google Scholar]
- 18.de Vecchi A, Gomez A, Pushparajah K, Schaeffter T, Nordsletten DA, Simpson JM, Penney GP, Smith NP. 2014. Towards a fast and efficient approach for modelling the patient-specific ventricular haemodynamics. Prog. Biophys. Mol. Biol. 116, 3–10. ( 10.1016/j.pbiomolbio.2014.08.010). [DOI] [PubMed] [Google Scholar]
- 19.de Vecchi A, Nordsletten DA, Razavi R, Greil G, Smith NP. 2013. Patient specific fluid–structure ventricular modelling for integrated cardiac care. Med. Biol. Eng. Comput. 51, 1261–1270. ( 10.1007/s11517-012-1030-5) [DOI] [PubMed] [Google Scholar]
- 20.Krishnamurthy A, et al. 2013. Patient-specific models of cardiac biomechanics. J. Comput. Phys. 244, 4–21. ( 10.1016/j.jcp.2012.09.015) [DOI] [PMC free article] [PubMed] [Google Scholar]
- 21.Kerckhoffs RCP, McCulloch AD, Omens JH, Mulligan LJ. 2009. Effects of biventricular pacing and scar size in a computational model of the failing heart with left bundle branch block. Med. Image Anal. 13, 362–369. ( 10.1016/j.media.2008.06.013) [DOI] [PMC free article] [PubMed] [Google Scholar]
- 22.Aguado-Sierra A, et al. 2011. Patient-specific modeling of dyssynchronous heart failure: a case study. Prog. Biophys. Mol. Biol. 107, 147–155. ( 10.1016/j.pbiomolbio.2011.06.014) [DOI] [PMC free article] [PubMed] [Google Scholar]
- 23.Baretta A. 2014. Patient-specific modeling of the cardiovascular system for surgical planning of single-ventricle defects. PhD thesis, Politecnico di Milano, Italy. [Google Scholar]
- 24.Yellin EL, Peskin C, Yoran C. 1981. Mechanisms of mitral valve motion during diastole. Am. J. Physiol. Heart Circ. Physiol. 10, 389–400. [DOI] [PubMed] [Google Scholar]
- 25.Migliavacca F, Pennati G, Dubini G, Fumero R, Pietrabissa R, Urcelay G, Bove EL, Hsia TY, de Leval MR. 2001. Modeling of the Norwood circulation: effects of shunt size, vascular resistances, and heart rate. Am. J. Physiol. Heart Circ. Physiol. 280, 2076–2086. [DOI] [PubMed] [Google Scholar]
- 26.Nielsen PMF, Le Grice IJ, Smaill BH, Hunter PJ. 1991. Mathematical model of geometry and fibrous structure of the heart. Am. J. Physiol. Heart Circ. Physiol. 260, 1365–1378. [DOI] [PubMed] [Google Scholar]
- 27.Streeter DD, Jr, Spotnitz HM, Patel DP, Ross J, Jr, Sonnenblick EH. 1969. Fiber orientation in the canine left ventricle during diastole and systole. Circ. Res. 24, 339–347. ( 10.1161/01.RES.24.3.339) [DOI] [PubMed] [Google Scholar]
- 28.Holzapfel GA, Ogden RW. 2009. Constitutive modelling of passive myocardium: a structurally based framework for material characterization. Phil. Trans. R. Soc. A 367, 3445–3475. ( 10.1098/rsta.2009.0091) [DOI] [PubMed] [Google Scholar]
- 29.Yin FCP, Strumpf RK, Chew PH, Zeger SL. 1987. Quantification of the mechanical properties of noncontracting canine myocardium under simultaneous biaxial loading. J. Biomech. 20, 577–589. ( 10.1016/0021-9290(87)90279-X) [DOI] [PubMed] [Google Scholar]
- 30.Dokos S, Smaill B, Young A, LeGrice I. 2002. Shear properties of passive ventricular myocardium. Am. J. Physiol. Heart Circ. Physiol. 283, 2650 ( 10.1152/ajpheart.00111.2002) [DOI] [PubMed] [Google Scholar]
- 31.Rodriguez EK. 1994. Stress-dependent finite growth in soft elastic tissues. J. Biomech. 27, 455–467. ( 10.1016/0021-9290(94)90021-3) [DOI] [PubMed] [Google Scholar]
- 32.Klotz S, Hay I, Dickstein ML, Yi G-H, Wang J, Maurer MS, Burkhoff D. 2006. Single-beat estimation of end-diastolic pressure–volume relationship: a novel method with potential for noninvasive application. Am. J. Physiol. Heart Circ. Physiol. 291, 403–412. ( 10.1152/ajpheart.01240.2005) [DOI] [PubMed] [Google Scholar]
- 33.Lumens J, Delhaas T, Kirn B, Arts T. 2009. Three-wall segment (TriSeg) model describing mechanics and hemodynamics of ventricular interaction. Ann. Biomed. Eng. 37, 2234–2255. ( 10.1007/s10439-009-9774-2) [DOI] [PMC free article] [PubMed] [Google Scholar]


