

Abstract
Projected impacts of climate change on vector-borne disease dynamics must consider many variables relevant to hosts, vectors and pathogens, including how altered environmental characteristics might affect the spatial distributions of vector species. However, many predictive models for vector distributions consider their habitat requirements to be fixed over relevant time-scales, when they may actually be capable of rapid evolutionary change and even adaptation. We examine the genetic signature of a spatial expansion by an invasive vector into locations with novel temperature conditions compared to its native range as a proxy for how existing vector populations may respond to temporally changing habitat. Specifically, we compare invasions into different climate ranges and characterize the importance of selection from the invaded habitat. We demonstrate that vector species can exhibit evolutionary responses (altered allelic frequencies) to a temperature gradient in as little as 7–10 years even in the presence of high gene flow, and further, that this response varies depending on the strength of selection. We interpret these findings in the context of climate change predictions for vector populations and emphasize the importance of incorporating vector evolution into models of future vector-borne disease dynamics.
Keywords: rapid evolution, Aedes, climate change, metapopulation, temperature, natural selection
1. Introduction
Studies of climate change have explored many of the ways in which the mean values and the expected variance around those means for environmental characteristics (such as temperature or humidity) will drastically affect the suitability of portions of current home ranges for many species [1]. Climate-driven changes are likely to have a multitude of effects on species distributions, including the loss of existing habitat, opportunities to colonize newly suitable areas and changes in patch size due to fragmentation [2]. These contractions, expansions and alterations in habitat suitability will have profound potential impacts not only on single species, but also on community-level processes and ecosystem function [3]. For example, transmission of vector-borne pathogens requires a ‘perfect trifecta’ of available hosts, competent vectors and a sufficiently prevalent parasite or pathogen. As a result, climate change will impact transmission directly by affecting the occurrence of any of these three components, or more subtly by changing the timing or nature of their interaction [4]. Predicting the response of vector-borne diseases to climate change therefore requires, among other things, a data-driven understanding of how vector populations are likely to be affected.
Many aspects of this understanding have begun to be assembled (many in this special issue), including projections of climate change itself, the ways in which these changes are likely to affect vector populations and host availability, and how this altered population ecology will affect ongoing transmission dynamics and disease risk [5,6]. Although a few models have begun to incorporate evolutionary effects (e.g. [7]), a very common assumption of these explorations is that climate-driven impacts to habitat will affect vector ecology on a faster timescale than they might impact vector evolution, even given their often very short generation time. If false, however, this assumption could drastically compromise our ability to forecast future vector habitat ranges. Sternberg & Thomas [8] considered the potential for local adaptation to modulate vector responses to climate change in an elegant thought experiment; however, actual studies involving climate change and its impact on vector species are difficult to conduct and interpret for a variety of reasons. For example, the extremely long-term datasets required to track climatic change and its response on species are difficult to obtain and to control for confounding factors, and even more difficult to replicate. The stochastic nature of demographic processes at small population sizes, such as extinction and colonization, are further challenges. Additionally, there is a need to study both changes in mean and changes in fluctuations about the mean as potentially separate factors [9]. While certainly still possible, these factors do complicate purposeful investigation into just the evolutionary dynamics of a vector species as a result of climate change, even before the effects of adaptation could be considered on altered disease dynamics.
Although climate-driven evolution may be difficult to study for all the aforementioned reasons, there are available proxies that can provide us with sufficiently analogous circumstances to begin to explore disease vector evolution caused by climate change. A few species that vector diseases have been notoriously successful at invasive expansion of their habitat range on a global scale (i.e. the yellow fever mosquito, Aedes aegypti, that vectors not only yellow fever virus but also dengue and chikungunya viruses [10]; the Culex pipiens complex, vectors of lymphatic filariasis and arboviruses such as West Nile and Rift Valley viruses [11]; the Asian tiger mosquito, Aedes albopictus, important vector of dengue and chikungunya viruses [12]). Often exotic vectors expand into areas with similar climate conditions to those in the native range and this is a basic tool that can be used to forecast their expansion [13]. However, vector species that have established in areas with environmental characteristics significantly different from those in their native range allow us to examine the evolution of these populations as a proxy for how a species might respond to altered environmental conditions in its own native range [14]. These insights will provide us with crucial information for the estimation of climate impacts on vector evolution, such as the timescales required for an evolutionary response (i.e. we will know for how long the ‘no evolution’ assumption made in most predictive models will be valid). The use of empirical results from invasion biology of vectors will also help us to incorporate metapopulation dynamics into predictions of climate change impacts on vector populations. As selective pressures from climate change are unlikely to be uniform across patches, we must consider ongoing dispersal between and among patches with varying strengths of selection (or no selection), dynamics similar to the expansion of an invasive species into a heterogeneous environment.
To begin to evaluate the likely evolutionary outcomes from biological invasions into new regions and novel habitats, we discuss three main influential factors: (i) the genetic diversity of the source populations, (ii) the direction and intensity of selective pressure from the novel environment, and (iii) the frequency of reinvasion. Clearly for unidirectional selection, as the frequency of reinvasion increases, the impact of selective pressures on the diversity of the invasive population should decrease (though only proportionally to the diversity of the initial source population) (figure 1). Similarly, as the intensity of selection increases, the diversity of genes under active selection remaining in the new population should (at least initially) decrease. Although future mutations can cause a rebound in the diversity of the alleles represented, they should reveal a mean phenotype more suited to the novel selective pressure than that of the source population.
Figure 1.

Conceptual example of the impact of repeated invasion events from a single source population with a diversity of represented alleles on the allelic frequency over time in the newly established population. In this example, unidirectional selection acts consistently over time on the observed alleles in the population. The alleles that are decreased or eliminated by selective pressure can be reintroduced by subsequent reinvasion events, whereas those that are increased by selective pressure can be either reinforced or diluted by the subsequent injection of alleles from the source population during reinvasion events. When the observed alleles are not under active selection (e.g. neutral genetic markers, as is standard in population genetic studies), alteration in observed diversity of allelic representation (i.e. genetic diversity) can be used as a proxy by which to understand the actions of selection on latent phenotypes. (Online version in colour.)
If individuals from the same initial source population invade new regions with sufficiently different selective pressures, we would expect the resulting populations to diverge in average phenotype over time. However, following the same logic as above, if there is sufficient gene flow among the regions, this may act as repeated reintroduction, but now from additional ‘source’ populations that differ in allelic frequency and therefore alter the expected trajectories for both the diversity of alleles represented and their mean phenotype in each patch. As this connected-patch scenario is more likely as climate change affects habitat ranges, our analogous factors to the three discussed for biological invasion to cases of climate-influenced habitat change become slightly more nuanced (adding one additional potential factor) to now include: (i) the current genetic diversity on which selection can act in each patch/population, (ii) the viable mutation rate in each patch/population, (iii) the strength and direction of selective pressure in each patch/population (including patches with no discernable climate-related selective pressure), and (iv) the frequency of movement among patches/populations. These factors paint a sufficiently complex picture that we do not propose that any one set of studies will allow us to identify even which factors are most important for any particular pairing of species and climate-related selective pressure. The directions of influence and interaction among these factors have been studied independently, including the impact of gene flow among distinct populations on the effects of selection (cf. [15]), and the potential impact of initial phenotypic diversity/plasticity in climate-determined fitness on population adaptation (cf. [16]), but have not been incorporated into a unified framework for understanding likely evolutionary responses to climate change. By studying examples from vector invasions into novel environments, we can at least begin to understand how frequently, and to what allelic extent, the standard ‘no-evolution’ assumption may be violated and cause critical compromise to the accuracy of predictions of the impact of climate change on vector-borne disease dynamics.
One such example is the species Aedes japonicus japonicus, a mosquito that has recently expanded into a different climate. This species is native to northern Japan and the Korean peninsula [17,18]. During the harsh winters in this part of the world, Ae. j. japonicus survives as diapausing eggs that hatch soon after the warmer spring temperatures arrive. Aedes j. japonicus is highly sensitive to high temperatures and does better at relatively low temperatures (less than 20°C) as evidenced by colonization, life-history and competition studies [19–21]. Its recent expansion into temperate North America and Europe [22–25] was unexpected but not surprising. It was very surprising, however, that this species also established populations in the island of Hawaii and is spreading into the southeastern USA [26,27] where it is consistently much warmer. Aedes j. japonicus has been implicated as a competent vector of several diseases in laboratory studies, including chikungunya and dengue viruses [28], eastern equine encephalitis [29], Japanese encephalitis [30], La Crosse virus [31], Rift Valley fever [32], St. Louis encephalitis [33] and West Nile virus [34,35], and because it feeds on both humans and non-human mammals [36] may act as a bridge vector to humans of these and other diseases.
Further, Ae. j. japonicus is a good representative of other disease-vectoring mosquitoes and their potential for evolutionary responses to climate change. It shares traits with Ae. albopictus and Ae. aegypti, such as feeding heavily on humans, laying eggs with delayed hatch in small artificial containers, allowing them to be transported easily, and significantly, like most poikilothermic arthropods, similar temperature-dependent population dynamics [37]. Aedes albopictus and Ae. aegypti are primary vectors of dengue and chikungunya [38,39], two emerging arboviruses, and thus critical species for modelling the response of vectors to climate change. In addition to sharing important life-history traits with other vector species, Ae. j. japonicus is an outstanding model system because we have detailed data on the genetics of its expansion outside its native range [40–44]. This expansion is very recent but already extensive in continental USA, Europe and Hawaii, and occurred at a time when many mosquito surveillance programmes were already ‘on alert’ monitoring the expansion of Ae. albopictus giving us timely knowledge of its arrival in each subsequent location. Specimens for genetic analysis were often collected shortly after its detection in many of the new locations, in some cases allowing detailed spatial genetic studies that have given us the ability to observe both how invasive populations differ from their source population in native environments [40] and how the invasive populations change over space [41,42] and time [42] as they spread through different climate-related environmental conditions in the new regions invaded [43,44].
Here, we consider two areas in the Ae. j. japonicus' expanded range: Hawaii, the largest island in the Hawaiian archipelago, and Virginia, a state in the US mainland, both with a strong spatial gradient in temperature (elevation) that can be used as a proxy for the temporal gradient predicted to occur with climate change. While Sternberg & Thomas [8] provide a wonderful conceptual framework for how evolutionary responses to climate-driven alterations in habitat suitability could impact vector populations, they rely on evidence from non-vector species that such effects may occur at timescales relevant to predictions of disease dynamics. Here, we present (to the best of our knowledge) the first empirical evidence of vector evolution in response to changes in habitat temperature and discuss the timescales and strength of selection required to propel evolutionary change in vectors. We document rates of evolution in response to temperature-related pressures and infer timescales and orders of potential effect for disease-important features of ecological vector success that include evolutionary responses. Further, we propose that these types of effects will be critical in projecting long-term impacts to vector-borne disease dynamics under scenarios of climate change.
2. Material and methods
Established populations of Ae. j. japonicus were first detected outside its native range in New Jersey and New York, two US states, in 1998 [22]. Aedes j. japonicus has now become established in at least 20 US states and three Canadian provinces in eastern North America. The species' current range spans from Minnesota through Quebec and Newfoundland in the north all the way to Georgia in the south [18]. Established populations of Ae. j. japonicus were also detected in the western US states of Washington and Oregon in 2002 [23] and, as mentioned, in Hawaii in 2003 [26]. In Europe infestations of this species were intercepted and destroyed in northern France in 2001 but established populations were detected in Belgium in 2002 [25]. Currently, Ae. j. japonicus has multiple expansion foci in Germany, Switzerland and on both sides of the border between Austria and Slovenia [41].
As mentioned, we have examined native populations of Ae. j. japonicus from Japan and Korea and exotic populations in the USA and Europe using variation at seven existing microsatellite loci [45] as well as at nad4, a mitochondrial locus ([40–44]; DM Fonseca 2015, unpublished data). Both these types of DNA loci are highly variable and provide useful and somewhat independent information on demographic history [46]. We found evidence of multiple separate introductions to the USA and to Europe that often mixed and expanded [41,42,47].
Although we often refer to the published studies and previous analyses, for this study we are focusing on a detailed examination of the effects of temperature on the allelic diversity of Ae. j. japonicus in Hawaii and Virginia. Genetic patterns in these two locations have not previously been compared to each other, nor have they been evaluated in the context of predicting species responses to climate change. Specifically, we examined (i) specimens from Hawaii collected in 2010 and 2011, 7 years after their first detection in 2003, and sampled from populations across a gradient of elevations on the flanks of Hawaii's volcanoes; and (ii) specimens from Virginia collected 10 years after its first detection in 2002 [48] and sampled from populations near and at sea level and high in the Appalachian range. For comparison, we also examined 13 specimens from Hawaii collected in 2004 at sea level in the location where Ae. j. japonicus was first detected in Hawaii, as well as 30 specimens each from the Japanese cities of Kyoto and Tokyo, in its native range. All specimens were collected as larvae, preserved in more than 70% EtOH and later genomic DNA was extracted and analysed according to established protocols [42,45]. Further details on collection methodologies, sample sizes and genetic analysis procedures can be obtained from Egizi & Fonseca [43] for Hawaii, and Egizi et al. [44] for Virginia.
Temperature data were obtained from the closest weather station to each larval collection location. ‘Closest’ is here defined to include two criteria: (i) the station closest to the GPS coordinates of the location and (ii) the station closest in elevation to the sampled location. Because elevation is likely to have a greater influence on temperature than latitude and longitude (at the spatial scale under consideration), for some sampling sites a weather station was chosen that was slightly more distant based on GPS coordinates but closer in elevation (and therefore closer to the actual temperature of the site). Climate normals, including minimum annual temperature, mean annual temperature and maximum annual temperature, were obtained from the NOAA National Climatic Data Center Mapping Tool (http://gis.ncdc.noaa.gov/map/viewer/) for the period on record (1981–2010) in Virginia. However, due to a scarcity of appropriately located weather stations in Hawaii using the NOAA tool, we obtained temperatures for Hawaii from www.weatherbase.com. Number of years on record for the Weatherbase stations in Hawaii varied from 18 to 62, with a mean ± s.d. of 43.25 ± 17.26. We compared minimum, maximum and mean annual temperatures between the highest and lowest elevation site in both Virginia and Hawaii to determine potential differences in selection pressures. Additionally, we compared the difference between the minimum and maximum temperature between Hawaii and Virginia to get a sense of seasonal variability differences between the locations.
We calculated allelic richness (AR) in the program FSTAT 1.2 [49] and standardized to the lowest population size using rarefaction [50]. Correlations between temperature and allelic richness were calculated and tested for significance using the rcorr() command in the Hmisc package in R [51]. We chose Spearman's ρ, a non-parametric method, due to the genetic variables failing to meet criteria of normality despite transformation. FST (a measure of pairwise genetic distance) was also calculated in FSTAT [49] to compare genetic structure within and between the coastal/sea level and mountain populations in Virginia. We then tested for an association between FST values and temperature (using the difference in degrees Celsius between average annual temperature values for each population pair) in a Mantel test using FSTAT 1.2 [49]. In a subsequent partial Mantel test, we calculated the correlation between temperature and FST while controlling for the effect of geographical distance on FST (i.e. the expectation that populations at a greater geographical distance from each other will differ due to reduced gene flow) to disentangle the separate effects of geographical isolation and temperature.
3. Results and discussion
Populations within the native range of Ae. j. japonicus (Japan) showed a higher diversity of alleles compared with Hawaiian populations (figure 2) indicating a loss of alleles during the invasion process. Further allelic comparisons between populations experiencing low versus high temperatures within Hawaii showed the loss of additional rare alleles in high-temperature populations, indicating genetic bottlenecks beyond initial founder effects (figure 2).
Figure 2.

Differences in allelic frequency patterns between Japan and Hawaiian populations observed 7 years post-establishment. Frames on the left are from Japan, centre frames are from low temperature (high elevation) Hawaiian populations and frames on the right are from high-temperature (low elevation) Hawaiian populations. Each row represents a different microsatellite locus (neutral genetic marker). Stars denote alleles that are very low frequency (less than 0.01) but present. Note the reduced overall diversity in Hawaii relative to Japan and the further loss of several rare alleles in high-temperature populations (e.g. 173 and 186 at locus OJ100) suggesting temperature-related bottlenecks.
Importantly, both Hawaii and Virginia populations of Ae. j. japonicus showed clear genetic differences related to temperature after a relatively short period of time: 7 years in the former, and at most 10 years in the latter. In Hawaii, allelic richness (genetic diversity) was strongly negatively correlated with temperature (r = −0.90, p = 0.001, figure 3a). Modern day populations at cooler temperatures have maintained much of the genetic diversity present in the original expansion, whereas populations experiencing high temperatures have subsequently lost genetic diversity (figure 3a). It is therefore likely that Ae. j. japonicus has undergone genetic change in high-temperature populations, though whether this change is a result solely of genetic drift or is selection-driven is still unknown. Genetic patterns in Virginia are different than in Hawaii although the link to temperature remains evident. Temperature is not correlated with genetic diversity here (r = −0.2, p > 0.05) but there is a significant relationship between genetic distance (FST) and difference in temperature (r = 0.66, p < 0.001, figure 3b), meaning populations that experience different temperatures are genetically different from each other. This effect persists when controlling for the effect of geographical distance (r = 0.33, p = 0.006), indicating that temperature has an effect on the genetic structure of populations that is above and beyond the effect of geographical isolation.
Figure 3.
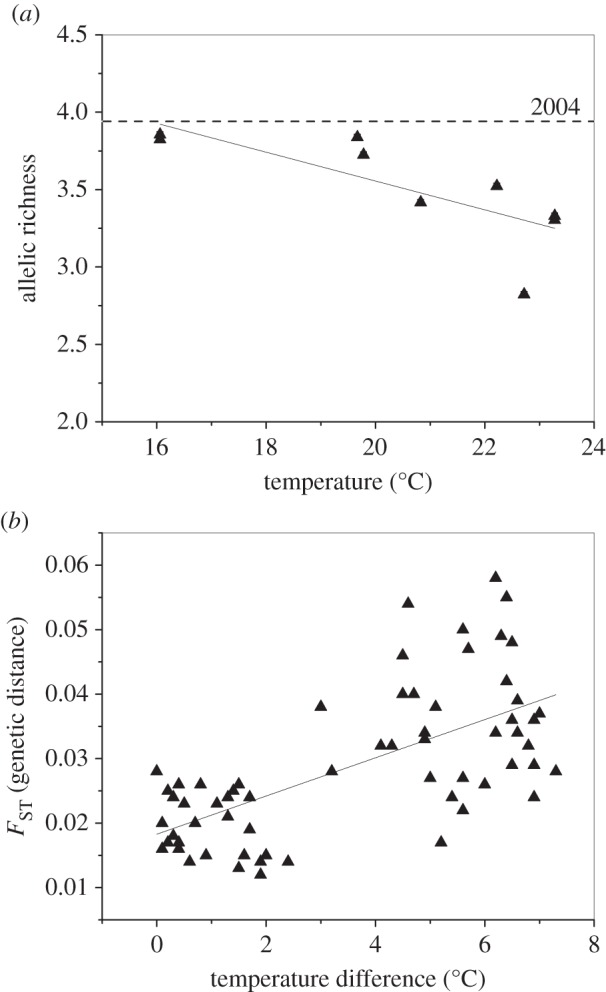
(a) Relationship between standardized allelic richness and average annual temperature for invasive Ae. j. japonicus populations in Hawaii, USA. Dashed horizontal line indicates the level of genetic diversity present in 2004 Hawaiian samples (closest to the founding population). (b) Relationship between pairwise FST (genetic distance) and pairwise difference in average annual temperature for invasive Ae. j. japonicus populations in Virginia, USA (these are uncorrected for geographical distance).
Although temperature-related genetic differences were observed in both Hawaii and Virginia, the nature of the differences (whether in allelic diversity or genetic distance) varied between the states. This could be the result of their distinct climates and/or topographies: states north of Virginia have thriving populations of Ae. j. japonicus, whereas in Hawaii Ae. j. japonicus is still restricted to a single island (Hawaii) and of course the archipelago is isolated in the Pacific Ocean. Consequently, the potential gene flow from other populations in the mainland USA is likely much higher in Virginia than in Hawaii, which would compensate for losses in genetic diversity (figure 1). Additionally, the temperature gradient in Hawaii is steeper than in Virginia (table 1) resulting in a potentially stronger selection pressure, and Virginia has greater annual fluctuation in temperature (table 1) including cold winters that might exert stabilizing selection. Therefore, Ae. j. japonicus experiences a more temporally consistent selection pressure in Hawaii than in Virginia, as well as possibly a greater number of generations per year, both factors that could increase the speed of evolutionary change.
Table 1.
Comparison of temperature data from weather stations closest to the highest and lowest elevation sites in Hawaii versus Virginia. Max–min is the difference between the average annual maximum and minimum temperatures for that site, and |high–low diff.| is the absolute value of the difference between the highest and lowest elevation sites for each temperature measurement. Annual minimum temperature (minT), annual average temperature (avgT) and annual maximum temperature (maxT) are all in degrees Celsius, as are their differences (max–min). Elevation is in metres. As discussed in the text, differences in the strength of temperature selection pressures between Hawaii and Virginia sites likely contributed to the different genetic patterns observed.
| station | elevation | minT | avgT | maxT | max–min | |
|---|---|---|---|---|---|---|
| Hawaii | ||||||
| highest | Volcano | 1158.24 | 11.5 | 16.06 | 20.67 | 9.17 |
| lowest | Hilo | 10.97 | 19.33 | 23.38 | 27.17 | 7.84 |
| |high–low diff.| | 1147.27 | 7.83 | 7.32 | 6.5 | ||
| Virginia | ||||||
| highest | Floyd | 800.1 | 4.44 | 10.83 | 17.17 | 12.73 |
| lowest | North | 3 | 9.22 | 14.44 | 19.72 | 10.5 |
| |high–low diff.| | 797.1 | 4.78 | 3.61 | 2.55 | ||
These results also confirm the importance of the predictive factors discussed earlier (summarized in figure 1) and the ways in which they might influence vector evolution: (i) Initial genetic diversity in introduced populations was already low relative to native populations due to the founder event. Despite this relatively depauperate diversity, we were able to see a change in gene frequencies very rapidly; therefore vectors in their native ranges or with much greater diversity from admixture of multiple sources might have an even greater flexibility to adapt to changes in climate. (ii) We saw more obvious genetic differences in Hawaii in a shorter amount of time, and this may relate to the potentially stronger selection pressure experienced there compared to Virginia. It might therefore be predicted that areas with less seasonal variation in temperature or more extreme temperature increases will be able to produce faster change. (iii) In Virginia, there is continued reintroduction of propagules from outside adjacent populations, whereas the Hawaiian population overall remains isolated, and this difference has likely also contributed to differences in rates and outcomes of evolutionary processes between the two locations. In the context of climate change, this means that rates of vector movement between and among habitat patches (both previously suitable and newly available) need to be considered since they will influence evolutionary potential. Critically, because major vector species like Aedes mosquitoes rely heavily on humans for longer distance transport [10,52], the movement rates of humans will have a large effect on vector movement and therefore in turn, vector overlap with hosts/pathogens (required for disease transmission) and vector evolution.
We found a system with established populations of a cold-adapted disease vector outside the predicted range based on its known distribution prior to expansion. Further, we found significant genetic differences among populations of an invasive mosquito in both Hawaii and Virginia that were correlated with temperature. Our results, therefore, provide evidence that the ‘no evolution’ assumption made by the vast majority of models exploring the likely influences of climate change on vector-borne disease dynamics is unlikely to be universally accurate.
4. Implications for studying the impacts of climate change to vector-borne disease dynamics
By studying how invasive vector populations have responded to novel environmental conditions in their newly invaded ranges, we have shown that evolutionary change can be detected in under a decade. These observed differences are beyond those expected to occur due to genetic drift in geographically separated populations. Other studies of Aedes mosquitoes have found that exotic populations in different locations become dissimilar even when they came from genetically identical source populations [53,54]. Importantly, the populations we studied developed differences despite remaining relatively close-by, i.e. with significant gene flow, indicating that processes beyond genetic drift are likely in effect.
The effects we observed have probably occurred more rapidly than might be expected with climate change, however, since these vectors were introduced into environments with pre-existing climate differences. As climate change models predict gradual habitat change, this means that the intensity of selective pressure from climate-driven environmental change will start slowly and increase over time, possibly slowing the likely evolutionary response. Still, since most models of infectious disease dynamics focus on timescales ranging from 10 to 100 years (as reviewed in [55,56], among many others), these results clearly show that exclusion of evolutionary impacts may compromise the ability of these models to make accurate predictions.
It should be noted that, while we have shown significant evidence of rapid evolutionary response to novel temperature environments in a disease vector, these studies do not imply that these changes are adaptive. We have no evidence at this point that the average population fitness in the novel environments is, in fact, improved by the altered allelic representation. But true adaptation is actually ancillary to the main concern of our work. Even if it should be shown later that the trait differences provide no benefits to surviving novel environmental conditions, it is clear that the novel environments themselves were the driving pressure for at least some of the population's evolution. And for vector species, any changes in the genome have the potential to yield a novel set of many disease-important phenotypes (either because they are linked to a trait under selection or increased in prevalence due to drift). These phenotypes may include vector competence, vector biting rate, preferred host species for feeding, developmental phenology, or any of a whole suite of other disease-dynamic-important traits. Finally, while we do not present evidence of adaptation in our study, rapid adaptive evolution of vectors has been demonstrated in response to other selective agents such as day length [57], insecticide applications [58,59] and interspecific mating [60], indicating that adaptation to temperature is feasible.
In this way, human disease dynamics may easily be significantly affected by vector evolution via either population- or community-level ecological or epidemiological alteration in vector phenotypes. While the most immediate evolutionary responses to climate change will likely be apparent in vector ecology, it is important that we do not discount the potential for parasites and pathogens (that have themselves evolved in response to climate) to exert new selective pressures on the vector. We hypothesize that the greatest potential for direct selection on epidemiological phenotypes may come from scenarios in which there are direct fitness consequences to the vector for being either susceptible or resistant to the parasite/pathogen (e.g. [61]), and/or cases in which climate change alters the diversity of available hosts for the disease in question (potentially driving them towards increased human bloodfeeding) [62]. (This is not to suggest that such scenarios will not also experience ecologically driven selective pressures or altered outcomes from resulting vector evolution, merely that these may be cases in which the epidemiological factors would act as the more intense pressure.)
From studying the evolutionary response to invasion into novel environments, as we have just done, we can begin to translate these findings into the likely impacts of climate change. The diversity of the population under selection as climate change alters habitat is clearly analogous to our initially invading population. The intensity of selective pressure will, as already discussed, be more complicated than in the case of invading stable-but-different novel environments and, in fact, will interact inextricably with the rates of movement among patches. Climate change-driven alterations in existing habitat ranges may vary significantly, even over relatively short distances (cf. [63]). Non-uniformity in alteration can lead to new variation in habitat quality within a single region or may even cause fragmentation, making one previous patch into many smaller new ones, each with their own environmental conditions. Complicating matters even further, the new patch characteristics may apply different suites of selective pressures that are not linearly driven by climate change (i.e. small changes from the initial mean are likely to impact the population less than equally small changes towards new extremes).
The temporal nature of the changes, including both trends in the mean and variability around that mean, may cause fluctuating habitat connectivity and metapopulation dynamics that do not translate to a simple linear spatial shift of habitat patches. Connections themselves are unlikely to be well characterized as simply existing or not during the gradual impacts of climate change; rates of successful movement among patches are also likely to be affected. Critically, these rates of movement may not be due entirely to the normal suite of ecological factors. As a direct example from our invasion scenario, much of the movement of mosquitoes in the study area was anthropogenic. As climate change is predicted to significantly alter patterns in human travel for a variety of direct climatological (e.g. flooding; cf. [64,65]) or indirect (e.g. socioeconomic; cf. [66,67]) impacts in many regions of specific concern for vector-borne diseases, it may be critically important to explicitly examine how climate-altered human movement patterns will likely alter the movement of disease vectors. Where invasion biology discusses frequency of reinvasion, climate-driven evolution should consider ongoing connection to habitat that remains (as yet) mostly unaltered by climate change, as this will have a large effect on evolutionary trajectories of vectors.
5. Conclusion
Alterations in the habitat of disease vectors caused by climate change are likely to impact not just vector ecology but vector evolution. Our studies provide empirical evidence for the first time in a disease vector that the evolutionary impact of climate change may happen very rapidly. This clearly violates the standard set of assumptions in the large and growing body of literature exploring the possible impacts of climate change on human disease dynamics. Vector evolution in response to climate change is highly likely to yield either targeted adaptation and/or diffuse evolutionary changes in ecologically and epidemiologically relevant phenotypes in ways that may critically compromise the insights and conclusions drawn from studies that fail to include it. We strongly recommend that all quantitative or conceptual models that try to predict the impacts of climate change on disease dynamics for vector-borne diseases should explicitly include the possibility for climate-driven vector evolution.
Acknowledgements
We thank the editors of this issue for all of their effort in organizing this special session and the Working Group on Climate Change and Vector-borne Diseases, without whose members these ideas would not have come together.
Data accessibility
Data available from the Dryad Digital Repository: http://dx.doi.org/10.5061/dryad.sd3b0.
Authors' contributions
A.E., D.F. and N.F. collaborated equally in the conception and design of the study, and helped draft the manuscript. A.E. collected and analysed data on Hawaiian and Virginia populations. D.F. collected and analysed data on Japan populations. All authors gave final approval for publication.
Funding statement
We thank NIMBioS for funds to support the Working Group on Climate Change and Vector-borne Diseases. This work was also funded in part by NE-1043 Multistate funds to N.H.F. and D.M.F.
Conflict of interests
We declare no competing interests.
References
- 1.Pereira HM, et al. 2010. Scenarios for global biodiversity in the 21st century. Science 330, 1496–1501. ( 10.1126/science.1196624) [DOI] [PubMed] [Google Scholar]
- 2.Garcia RA, Araújo MB, Burgess ND, Foden WB, Gutsche A, Rahbek C, Cabeza M. 2014. Matching species traits to projected threats and opportunities from climate change. J. Biogeogr. 41, 724–735. ( 10.1111/jbi.12257) [DOI] [PMC free article] [PubMed] [Google Scholar]
- 3.Lavergne S, Mouquet N, Thuiller W, Ronce O. 2010. Biodiversity and climate change: integrating evolutionary and ecological responses of species and communities. Annu. Rev. Ecol. Evol. Syst. 41, 321–350. ( 10.1146/annurev-ecolsys-102209-144628) [DOI] [Google Scholar]
- 4.Altizer S, Ostfeld RS, Johnson PTJ, Kutz S, Harvell CD. 2013. Climate change and infectious diseases: from evidence to a predictive framework. Science 341, 514–519. ( 10.1126/science.1239401) [DOI] [PubMed] [Google Scholar]
- 5.Githeko AK, Lindsay SW, Confalonieri UE, Patz JA. 2000. Climate change and vector-borne diseases: a regional analysis. Bull. World Health Organ. 78, 1136–1147. [PMC free article] [PubMed] [Google Scholar]
- 6.Gage KL, Burkot TR, Eisen RJ, Hayes EB. 2008. Climate and vectorborne diseases. Am. J. Prev. Med. 35, 436–450. ( 10.1016/j.amepre.2008.08.030) [DOI] [PubMed] [Google Scholar]
- 7.Kearney M, Porter WP, Williams C, Ritchie S, Hoffmann AA. 2009. Integrating biophysical models and evolutionary theory to predict climatic impacts on species’ ranges: the dengue mosquito Aedes aegypti in Australia. Funct. Ecol. 23, 528–538. ( 10.1111/j.1365-2435.2008.01538.x) [DOI] [Google Scholar]
- 8.Sternberg ED, Thomas MB. 2014. Local adaptation to temperature and the implications for vector-borne diseases. Trends Parasitol. 30, 115–122. ( 10.1016/j.pt.2013.12.010) [DOI] [PubMed] [Google Scholar]
- 9.Vasseur DA, DeLong JP, Gilbert B, Greig HS, Harley CDG, McCann KS, Savage V, Tunney TD, O'Connor MI. 2014. Increased temperature variation poses a greater risk to species than climate warming. Proc. R. Soc. B 281, 20132612 ( 10.1098/rspb.2013.2612) [DOI] [PMC free article] [PubMed] [Google Scholar]
- 10.Powell JR, Tabachnick WJ. 2013. History of domestication and spread of Aedes aegypti: a review. Mem. Inst. Oswaldo Cruz 108, 11–17. ( 10.1590/0074-0276130395) [DOI] [PMC free article] [PubMed] [Google Scholar]
- 11.Farajollahi A, Fonseca DM, Kramer LD, Marm Kilpatrick A. 2011. ‘Bird biting’ mosquitoes and human disease: a review of the role of Culex pipiens complex mosquitoes in epidemiology. Infect. Genet. Evol. 11, 1577–1585. ( 10.1016/j.meegid.2011.08.013) [DOI] [PMC free article] [PubMed] [Google Scholar]
- 12.Rochlin I, Ninivaggi DV, Hutchinson ML, Farajollahi A. 2013. Climate change and range expansion of the Asian tiger mosquito (Aedes albopictus) in Northeastern USA: implications for public health practitioners. PLoS ONE 8, e60874 ( 10.1371/journal.pone.0060874) [DOI] [PMC free article] [PubMed] [Google Scholar]
- 13.Benedict MQ, Levine RS, Hawley WA, Lounibos LP. 2007. Spread of the tiger: global risk of invasion by the mosquito Aedes albopictus. Vector Borne Zoonotic Dis. 7, 76–85. ( 10.1089/vbz.2006.0562) [DOI] [PMC free article] [PubMed] [Google Scholar]
- 14.Moran EV, Alexander JM. 2014. Evolutionary responses to global change lessons from invasive species. Ecol. Lett. 17, 637–649. ( 10.1111/ele.12262) [DOI] [PubMed] [Google Scholar]
- 15.Slatkin M. 1987. Gene flow and the geographic structure of natural populations. Science 236, 787–792. ( 10.1126/science.3576198) [DOI] [PubMed] [Google Scholar]
- 16.Lande R. 2009. Adaptation to an extraordinary environment by evolution of phenotypic plasticity and genetic assimilation. J. Evol. Biol. 22, 1435–1446. ( 10.1111/j.1420-9101.2009.01754.x) [DOI] [PubMed] [Google Scholar]
- 17.Tanaka K, Mizusawa K, Saugstad ES. 1979. A revision of the adult and larval mosquitoes of Japan (including the Ryukyu Archipelago and the Ogasawara islands) and Korea (Diptera:Culicidae). Contrib. Am. Entomol. Inst. 16, 1–987. [Google Scholar]
- 18.Kaufman MG, Fonseca DM. 2014. Invasion biology of Aedes japonicus japonicus (Diptera: Culicidae). Annu. Rev. Entomol. 59, 31–49. ( 10.1146/annurev-ento-011613-162012) [DOI] [PMC free article] [PubMed] [Google Scholar]
- 19.Egizi A, Morin PJ, Fonseca DM. 2014. Unraveling microbe-mediated interactions between mosquito larvae in a laboratory microcosm. Aquat. Ecol. 48, 179–189. ( 10.1007/s10452-014-9474-3) [DOI] [Google Scholar]
- 20.Scott JJ. 2003. The ecology of the exotic mosquito Ochlerotatus (Finlay) japonicus japonicus (Theobald 1901) (Diptera: Culicidae) and an examination of its role in the West Nile virus cycle in New Jersey. New Brunswick, NJ: Rutgers University. [Google Scholar]
- 21.Williges E, Farajollahi A, Scott JJ, McCuiston LJ, Crans WJ, Gaugler R. 2008. Laboratory colonization of Aedes japonicus japonicus. J. Am. Mosq. Control Assoc. 24, 591–593. ( 10.2987/5714.1) [DOI] [PubMed] [Google Scholar]
- 22.Peyton EL, Campbell SR, Candeletti TM, Romanowski M, Crans WJ. 1999. Aedes (Finlaya) japonicus japonicus (Theobald), a new introduction into the United States. J. Am. Mosq. Control Assoc. 15, 238–241. [PubMed] [Google Scholar]
- 23.Roppo MR, Lilja JL, Maloney FA, Sames WJ. 2004. First occurrence of Ochlerotatus japonicus in the state of Washington. J. Am. Mosq. Control Assoc. 20, 83–84. [PubMed] [Google Scholar]
- 24.Thielman A, Hunter FF. 2006. Establishment of Ochlerotatus japonicus (Diptera: Culicidae) in Ontario, Canada. J. Med. Entomol. 43, 138–142. ( 10.1603/0022-2585(2006)043[0138:EOOJDC]2.0.CO;2) [DOI] [PubMed] [Google Scholar]
- 25.Schaffner F, Kaufmann C, Hegglin D, Mathis A. 2009. The invasive mosquito Aedes japonicus in Central Europe. Med. Vet. Entomol. 23, 448–451. ( 10.1111/j.1365-2915.2009.00825.x) [DOI] [PubMed] [Google Scholar]
- 26.Larish LB, Savage HM. 2005. Introduction and establishment of Aedes (Finlaya) japonicus japonicus (Theobald) on the island of Hawaii: implications for arbovirus transmission. J. Am. Mosq. Control Assoc. 21, 318–321. ( 10.2987/8756-971X(2005)21[318:IAEOAF]2.0.CO;2) [DOI] [PubMed] [Google Scholar]
- 27.Reeves WK, Korecki JA. 2004. Ochlerotatus japonicus japonicus (Theobald) (Diptera: Culicidae), a new invasive mosquito for Georgia and South Carolina. Proc. Entomol. Soc. Washington 106, 233–234. [Google Scholar]
- 28.Schaffner F, Vazeille M, Kaufmann C, Failloux A-B, Mathis A. 2011. Vector competence of Aedes japonicus for chikungunya and dengue viruses. Eur. Mosq. Bull. 29, 141–142. [Google Scholar]
- 29.Sardelis MR, Dohm DJ, Pagac B, Andre RG, Turell MJ. 2002. Experimental transmission of eastern equine encephalitis virus by Ochlerotatus j. japonicus (Diptera: Culicidae). J. Med. Entomol. 39, 480–484. ( 10.1603/0022-2585-39.3.480) [DOI] [PubMed] [Google Scholar]
- 30.Takashima I, Rosen L. 1989. Horizontal and vertical transmission of Japanese encephalitis virus by Aedes japonicus (Diptera: Culicidae). J. Med. Entomol. 26, 454–458. [DOI] [PubMed] [Google Scholar]
- 31.Sardelis MR, Turell MJ, Andre RG. 2002. Laboratory transmission of La Crosse virus by Ochlerotatus j. japonicus (Diptera: Culicidae). J. Med. Entomol. 39, 635–639. ( 10.1603/0022-2585-39.4.635) [DOI] [PubMed] [Google Scholar]
- 32.Turell MJ, Byrd BD, Harrison BA. 2013. Potential for populations of Aedes j. japonicus to transmit Rift Valley fever virus in the USA. J. Am. Mosq. Control Assoc. 29, 133–137. ( 10.2987/12-6316r.1) [DOI] [PubMed] [Google Scholar]
- 33.Sardelis MR, Turell MJ, Andre RG. 2003. Experimental transmission of St. Louis encephalitis virus by Ochlerotatus j. japonicus. J. Am. Mosq. Control Assoc. 19, 159–162. [PubMed] [Google Scholar]
- 34.Turell MJ, O'Guinn ML, Dohm DJ, Jones JW. 2001. Vector competence of North American mosquitoes (Diptera: Culicidae) for West Nile virus. J. Med. Entomol. 38, 130–134. ( 10.1603/0022-2585-38.2.130) [DOI] [PubMed] [Google Scholar]
- 35.Turell MJ, Sardelis MR, Dohm DJ, O'guinn ML. 2001. Potential North American vectors of West Nile virus. Ann. NY Acad. Sci. 951, 317–324. ( 10.1111/j.1749-6632.2001.tb02707.x) [DOI] [PubMed] [Google Scholar]
- 36.Molaei G, Farajollahi A, Scott JJ, Gaugler R, Andreadis TG. 2009. Human bloodfeeding by the recently introduced mosquito, Aedes japonicus japonicus, and public health implications. J. Am. Mosq. Control Assoc. 25, 210–214. ( 10.2987/09-0012.1) [DOI] [PubMed] [Google Scholar]
- 37.Brady OJ, et al. 2013. Modelling adult Aedes aegypti and Aedes albopictus survival at different temperatures in laboratory and field settings. Parasite Vectors 6, 351 ( 10.1186/1756-3305-6-351) [DOI] [PMC free article] [PubMed] [Google Scholar]
- 38.Paupy C, Ollomo B, Kamgang B, Moutailler S, Rousset D, Demanou M, Hervé JP, Leroy E, Simard F. 2010. Comparative role of Aedes albopictus and Aedes aegypti in the emergence of Dengue and Chikungunya in central Africa. Vector Borne Zoonotic Dis. 10, 259–266. ( 10.1089/vbz.2009.0005) [DOI] [PubMed] [Google Scholar]
- 39.Lambrechts L, Scott TW, Gubler DJ. 2010. Consequences of the expanding global distribution of Aedes albopictus for dengue virus transmission. PLoS Neglected Trop. Dis. 4, e646 ( 10.1371/journal.pntd.0000646) [DOI] [PMC free article] [PubMed] [Google Scholar]
- 40.Fonseca DM, et al. 2001. Aedes (Finlaya) japonicus (Diptera: Culicidae), a newly recognized mosquito in the United States: analyses of genetic variation in the United States and putative source populations. J. Med. Entomol. 38, 135–146. ( 10.1603/0022-2585-38.2.135) [DOI] [PubMed] [Google Scholar]
- 41.Zielke DE, Werner D, Schaffner F, Kampen H, Fonseca DM. 2014. Unexpected patterns of admixture in German populations of Aedes japonicus japonicus (Diptera: Culicidae) underscore the importance of human intervention. PLoS ONE 9, e99093 ( 10.1371/journal.pone.0099093) [DOI] [PMC free article] [PubMed] [Google Scholar]
- 42.Fonseca DM, Widdel AK, Hutchinson M, Spichiger SE, Kramer LD. 2010. Fine-scale spatial and temporal population genetics of Aedes japonicus, a new US mosquito, reveal multiple introductions. Mol. Ecol. 19, 1559–1572. ( 10.1111/j.1365-294X.2010.04576.x) [DOI] [PubMed] [Google Scholar]
- 43.Egizi A, Fonseca DM. In press. Ecological limits can obscure expansion history: patterns of genetic diversity in a temperate mosquito in Hawaii. Biol. Invasions. ( 10.1007/s10530-014-0710-5) [DOI]
- 44.Egizi A. 2014. Ecological and evolutionary drivers of invasion success in a mosquito. Doctoral dissertation, Rutgers University, New Brunswick.
- 45.Widdel AK, McCuiston LJ, Crans WJ, Kramer LD, Fonseca DM. 2005. Finding needles in the haystack: single copy microsatellite loci for Aedes japonicus (Diptera: Culicidae). Am. J. Trop. Med. Hyg. 73, 744–748. [PubMed] [Google Scholar]
- 46.Sunnucks P. 2000. Efficient genetic markers for population biology. Trends Ecol. Evol. 15, 199–203. ( 10.1016/S0169-5347(00)01825-5) [DOI] [PubMed] [Google Scholar]
- 47.Huber K, et al. 2014. Distribution and genetic structure of Aedes japonicus japonicus populations (Diptera: Culicidae) in Germany. Parasitol. Res. 113, 3201–3210. ( 10.1007/s00436-014-4000-z) [DOI] [PubMed] [Google Scholar]
- 48.Harrison BA, Whitt PB, Cope SE, Payne GR, Rankin SE, Bohn LJ, Stell FM, Neely CJ. 2002. Mosquitoes (Diptera: Culicidae) collected near the great dismal swamp: new state records, notes on certain species, and a revised checklist for Virginia. Proc. Entomol. Soc. Washington 104, 655–662. [Google Scholar]
- 49.Goudet J. 1995. FSTAT (version 1.2): a computer program to calculate F-statistics. J. Hered. 86, 485–486. [Google Scholar]
- 50.Leberg PL. 2002. Estimating allelic richness: effects of sample size and bottlenecks. Mol. Ecol. 11, 2445–2449. ( 10.1046/j.1365-294X.2002.01612.x) [DOI] [PubMed] [Google Scholar]
- 51.R Core Team 2013. R: a language and environment for statistical computing. Vienna, Austria: R Foundation for Statistical Computing. [Google Scholar]
- 52.Moore AJ, Brodie ED, Wolf JB. 1997. Interacting phenotypes and the evolutionary process: 1. Direct and indirect genetic effects of social interactions. Evolution 51, 1352–1362. ( 10.2307/2411187) [DOI] [PubMed] [Google Scholar]
- 53.Brown JE, et al. 2011. Worldwide patterns of genetic differentiation imply multiple ‘domestications’ of Aedes aegypti, a major vector of human diseases. Proc. R. Soc. B 278, 2446–2454. ( 10.1098/rspb.2010.2469) [DOI] [PMC free article] [PubMed] [Google Scholar]
- 54.Brown JE, Evans BR, Zheng W, Obas V, Barrera-Martinez L, Egizi A, Zhao H, Caccone A, Powell JR. 2014. Human impacts have shaped historical and recent evolution in Aedes aegypti, the dengue and yellow fever mosquito. Evolution 68, 514–525. ( 10.1111/evo.12281) [DOI] [PMC free article] [PubMed] [Google Scholar]
- 55.Mills JN, Gage KL, Khan AS. 2010. Potential influence of climate change on vector-borne and zoonotic diseases: a review and proposed research plan. Environ. Health Perspect. 118, 1507–1514. ( 10.1289/ehp.0901389) [DOI] [PMC free article] [PubMed] [Google Scholar]
- 56.Reiner RC, et al. 2013. A systematic review of mathematical models of mosquito-borne pathogen transmission: 1970–2010. J. R. Soc. Interface 10, 20120921 ( 10.1098/rsif.2012.0921) [DOI] [PMC free article] [PubMed] [Google Scholar]
- 57.Urbanski J, Mogi M, O'Donnell D, DeCotiis M, Toma T, Armbruster P. 2012. Rapid adaptive evolution of photoperiodic response during invasion and range expansion across a climatic gradient. Am. Nat. 179, 490–500. ( 10.1086/664709) [DOI] [PubMed] [Google Scholar]
- 58.Gatton ML, et al. 2013. The importance of mosquito behavioural adaptations to malaria control in Africa. Evolution 67, 1218–1230. ( 10.1111/evo.12063) [DOI] [PMC free article] [PubMed] [Google Scholar]
- 59.Raymond M, Chevillon C, Guillemaud T, Lenormand T, Pasteur N. 1998. An overview of the evolution of overproduced esterases in the mosquito Culex pipiens. Phil. Trans. R. Soc. Lond. B 353, 1707–1711. ( 10.1098/rstb.1998.0322) [DOI] [PMC free article] [PubMed] [Google Scholar]
- 60.Bargielowski I, Lounibos LP. 2014. Rapid evolution of reduced receptivity to interspecific mating in the dengue vector Aedes aegypti in response to satyrization by invasive Aedes albopictus. Evol. Ecol. 28, 193–203. ( 10.1007/s10682-013-9669-4) [DOI] [PMC free article] [PubMed] [Google Scholar]
- 61.Ciota AT, Styer LM, Meola MA, Kramer LD. 2011. The costs of infection and resistance as determinants of West Nile virus susceptibility in Culex mosquitoes. BMC Ecol. 11, 23 ( 10.1186/1472-6785-11-23) [DOI] [PMC free article] [PubMed] [Google Scholar]
- 62.Lyimo IN, Ferguson HM. 2009. Ecological and evolutionary determinants of host species choice in mosquito vectors. Trends Parasitol. 25, 189–196. ( 10.1016/j.pt.2009.01.005) [DOI] [PubMed] [Google Scholar]
- 63.Opdam P, Wascher D. 2004. Climate change meets habitat fragmentation: linking landscape and biogeographical scale levels in research and conservation. Biol. Conserv. 117, 285–297. ( 10.1016/j.biocon.2003.12.008) [DOI] [Google Scholar]
- 64.McGranahan G, Balk D, Anderson B. 2007. The rising tide: assessing the risks of climate change and human settlements in low elevation coastal zones. Environ. Urbanization 19, 17–37. ( 10.1177/0956247807076960) [DOI] [Google Scholar]
- 65.Ciscar J-C, et al. 2011. Physical and economic consequences of climate change in Europe. Proc. Natl Acad. Sci. USA 108, 2678–2683. ( 10.1073/pnas.1011612108) [DOI] [PMC free article] [PubMed] [Google Scholar]
- 66.Kriegler E, O'Neill BC, Hallegatte S, Kram T, Lempert RJ, Moss RH, Wilbanks T. 2012. The need for and use of socio-economic scenarios for climate change analysis: a new approach based on shared socio-economic pathways. Glob. Environ. Change 22, 807–822. ( 10.1016/j.gloenvcha.2012.05.005) [DOI] [Google Scholar]
- 67.O'Neill BC, Kriegler E, Riahi K, Ebi KL, Hallegatte S, Carter TR, Mathur R, van Vuuren DP. 2014. A new scenario framework for climate change research: the concept of shared socioeconomic pathways. Clim. Change 122, 387–400. ( 10.1007/s10584-013-0905-2) [DOI] [Google Scholar]
Associated Data
This section collects any data citations, data availability statements, or supplementary materials included in this article.
Data Availability Statement
Data available from the Dryad Digital Repository: http://dx.doi.org/10.5061/dryad.sd3b0.