Significance
Most recent analyses of the environmental impact of natural gas have focused on production, with very sparse information on emissions from distribution and end use. This study quantifies the full seasonal cycle of methane emissions and the fractional contribution of natural gas for the urbanized region centered on Boston. Emissions from natural gas are found to be two to three times larger than predicted by existing inventory methodologies and industry reports. Our findings suggest that natural-gas–consuming regions may be larger sources of methane to the atmosphere than is currently estimated and represent areas of significant resource loss.
Keywords: natural gas distribution, greenhouse gas emissions, cities, methane
Abstract
Methane emissions from natural gas delivery and end use must be quantified to evaluate the environmental impacts of natural gas and to develop and assess the efficacy of emission reduction strategies. We report natural gas emission rates for 1 y in the urban region of Boston, using a comprehensive atmospheric measurement and modeling framework. Continuous methane observations from four stations are combined with a high-resolution transport model to quantify the regional average emission flux, 18.5 ± 3.7 (95% confidence interval) g CH4⋅m−2⋅y−1. Simultaneous observations of atmospheric ethane, compared with the ethane-to-methane ratio in the pipeline gas delivered to the region, demonstrate that natural gas accounted for ∼60–100% of methane emissions, depending on season. Using government statistics and geospatial data on natural gas use, we find the average fractional loss rate to the atmosphere from all downstream components of the natural gas system, including transmission, distribution, and end use, was 2.7 ± 0.6% in the Boston urban region, with little seasonal variability. This fraction is notably higher than the 1.1% implied by the most closely comparable emission inventory.
Atmospheric methane (CH4) is an important greenhouse gas (1) and major contributor to elevated surface ozone concentrations worldwide (2). Current atmospheric CH4 concentrations are 2.5 times greater than preindustrial levels due to anthropogenic emissions from both biological and fossil fuel sources. The growth rate of CH4 in the atmosphere slowed beginning in the mid-1980s and plateaued in the mid-2000s, but growth has resumed since 2007. The factors responsible for the observed global increase and interannual trends, and the spatiotemporal distribution of sources, remain uncertain (3).
Losses of natural gas (NG) to the atmosphere are a significant component of anthropogenic CH4 emissions (3), with important implications for resource use efficiency, worker and public safety, air pollution, and human health (4), and for the climate impact of NG as a large and growing source of energy. A major focus area of the US Climate Action Plan is reduction of CH4 emissions (5), but implementation requires identification of dominant source types, locations, and magnitudes. A recent review and synthesis of CH4 emission measurements in North America, spanning scales of individual components to the continent, found that inventory methods consistently underestimate CH4 emissions, that fossil fuels are likely responsible for a large portion of the underestimate, and that significant fugitive emissions may be occurring from all segments of the NG system (6).
The present study quantifies CH4 fluxes from NG in the urbanized region centered on Boston. Elevated CH4 concentrations in urban environments have been documented around the world for decades (7) (SI Appendix, Table S1) and attributed to a variety of anthropogenic source types. Recent studies of urbanized regions in California, using diverse atmospheric observing and modeling approaches, consistently found that CH4 emission rates were larger than those estimated by regional bottom-up inventories (8–12). In Boston, elevated CH4 concentrations have been observed at street level and attributed to >3,000 NG pipeline leaks from antiquated infrastructure (13), but associated CH4 emission rates were not quantitatively assessed.
In this study, we combine four key quantities in an atmosphere-based analytical framework: (i) atmospheric CH4 enhancements above background (ΔCH4) were determined from measurements at a network of continuous monitoring stations, inside and upwind of the urban core (Fig. 1), for 12 mo in 2012–2013; (ii) the NG fraction of the observed ΔCH4 was quantified for cool and warm seasons by measuring atmospheric ethane (C2H6), a tracer of thermogenic CH4, and comparing ratios of C2H6 and CH4 in the atmosphere and in the pipeline gas flowing through the region; (iii) total CH4 emissions were derived from an atmospheric transport model, which quantitatively links surface fluxes with observed ΔCH4 using assimilated meteorology; and (iv) the fraction of delivered NG lost to the atmosphere was estimated by comparing CH4 emissions to spatially explicit data on NG consumption. The result encompasses NG losses from the entire urbanized region, including emissions from NG transmission, storage, distribution, end use, and liquefied NG importation.
Fig. 1.
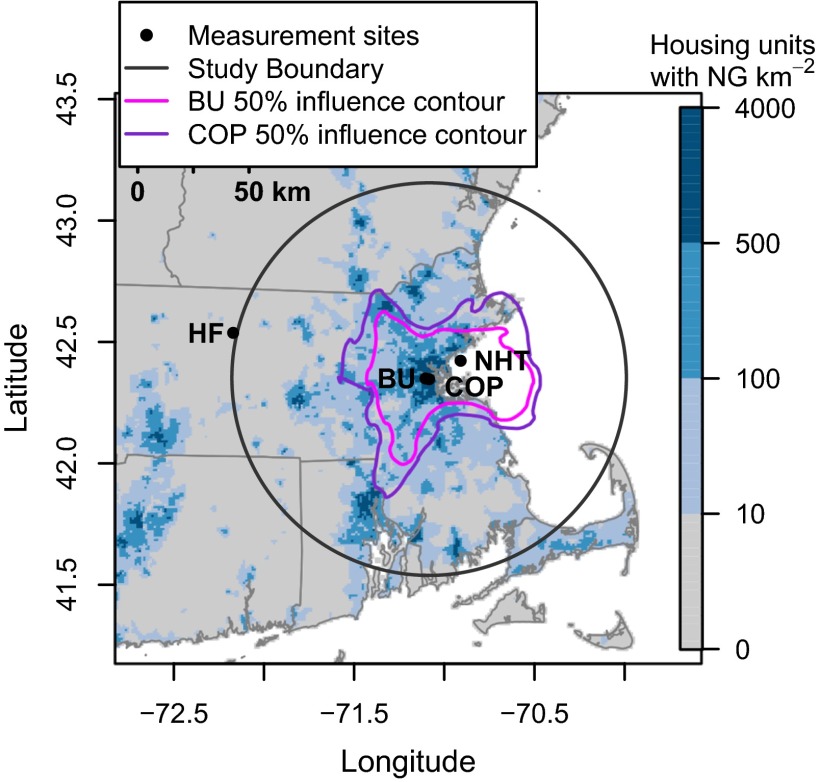
Location of two city [Boston University (BU), 29-m height; Copley Square (COP), 215-m height] and two peripheral [Harvard Forest (HF); Nahant (NHT)] measurement stations (black points) in Boston, and the surrounding area, overlaid on a map of the number of housing units with NG per square kilometer (14). The 90-km radius circle delineates the ∼18,000-km2 land area for which CH4 emissions and the NG loss rate were calculated. The magenta and purple contours enclose 50% of the average footprint (sensitivity area) of the BU and COP afternoon measurements, respectively. The two city sites are difficult to distinguish at this scale because the horizontal distance between them is ∼2 km. The influence area is ∼80% larger for COP than BU because the former station is higher. See SI Appendix, Table S2, for additional measurement site location information.
Methane Concentrations in the Boston Atmosphere
Atmospheric CH4 concentrations were measured continuously from September 2012 through August 2013 at two locations near the urban center [Boston University (BU) and Copley Square (COP)] and two locations outside of Boston [Harvard Forest (HF) and Nahant (NHT)] (Fig. 1 and SI Appendix, Table S2 and section S1). Background concentrations in air flowing into the city were estimated by randomly sampling from a range (5th to 35th) of lower percentiles of CH4 measurements from two upwind stations (HF or NHT, depending on the direction of simulated air trajectories; SI Appendix, section S3.1), averaged over a 48-h moving window, to capture synoptic-scale variability and remove possible influences of small nearby sources (SI Appendix, section S3.3). Values of ΔCH4 were calculated by subtracting background from urban concentrations. Hourly average ΔCH4 data were aggregated into daily afternoon (11–16 h EST, 16--21 h UTC) means to remove autocovariance and focus the analysis on periods of well-mixed atmospheric conditions.
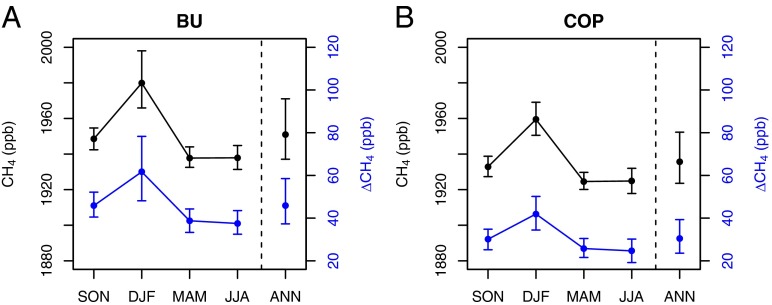
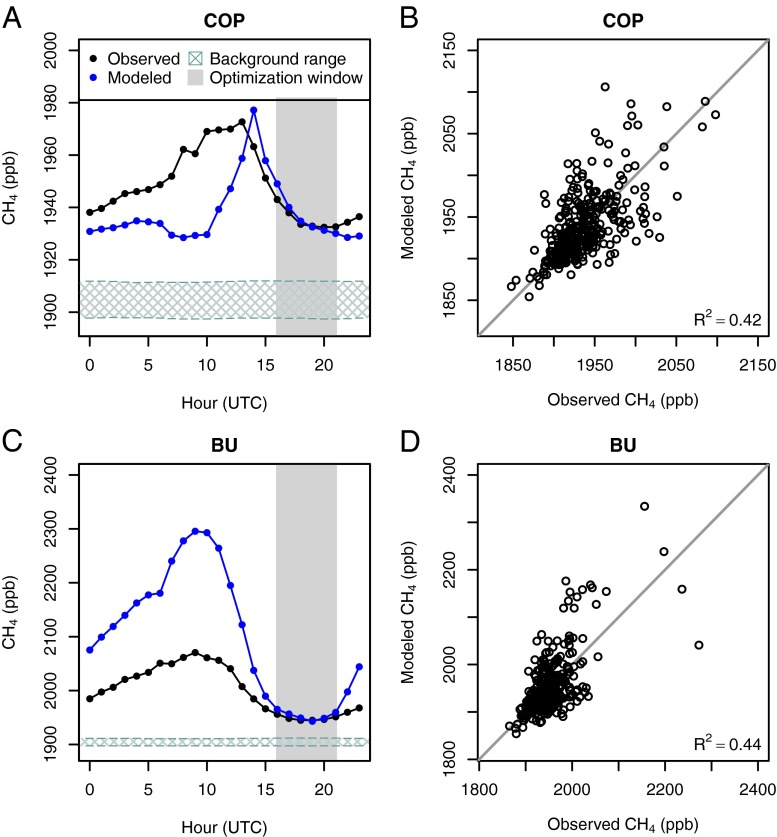
Methane concentrations in Boston were consistently elevated over background (Fig. 2 and SI Appendix, Figs. S1 and S2) and followed a distinct daily pattern (Fig. 3 A and C, and SI Appendix, Fig. S16), associated with growth and decay of the planetary boundary layer. Concentrations fluctuated over short timescales (SI Appendix, Fig. S1) due to small-scale atmospheric circulations and heterogeneous sources in the urban environment. Methane concentrations were higher in winter than the other seasons at both sites, but ΔCH4 varied less with season (Fig. 2). The average annual afternoon values of ΔCH4 at BU and COP were 45.9 (37.3, 58.5) ppb and 30.5 (23.6, 39.3) ppb, respectively (Fig. 2), reflecting different sampling altitudes (30 and 215 m, respectively; SI Appendix, Table S2). All errors reported throughout the paper are 95% confidence intervals. Uncertainties in ΔCH4 (Fig. 2) were calculated through a bootstrap analysis that included background concentrations and afternoon hourly, daily, and seasonally averaged CH4 measurements (SI Appendix, section S3.3).
Fig. 2.
Average (±95% confidence intervals) afternoon (11–16 h EST) CH4 (black; left y axis) and ΔCH4 (blue; right y axis) by season and for the whole year at (A) BU and (B) COP.
Fig. 3.
Observed and optimized modeled CH4 at (A and B) COP and (C and D) BU for 1 y. (A and C) Observed, modeled, and background CH4 concentrations averaged by hour of the day. The horizontal hatched area shows the average range of possible background concentrations, derived from 5th to 35th percentiles of the background station data. The gray vertical shaded area indicates the afternoon model optimization period, 11–16 h EST (16-21 h UTC). (B and D) Modeled versus observed daily average afternoon CH4 concentrations. The gray line is the one-to-one line.
Contribution of NG to Elevated CH4 Concentrations
To quantify the fraction of the observed ΔCH4 that was due to NG emissions, we compared ratios of C2H6 and CH4 measured in the atmosphere and NG pipelines serving the region. Ethane is a significant component of NG, whereas microbial CH4 sources, such as landfills, sewage, and wetlands, produce little or no C2H6 (15). Because Boston has no geologic CH4 seeps, no oil and gas production or refining, and low rates of biomass burning, there are no known significant sources of C2H6 in the region other than NG.
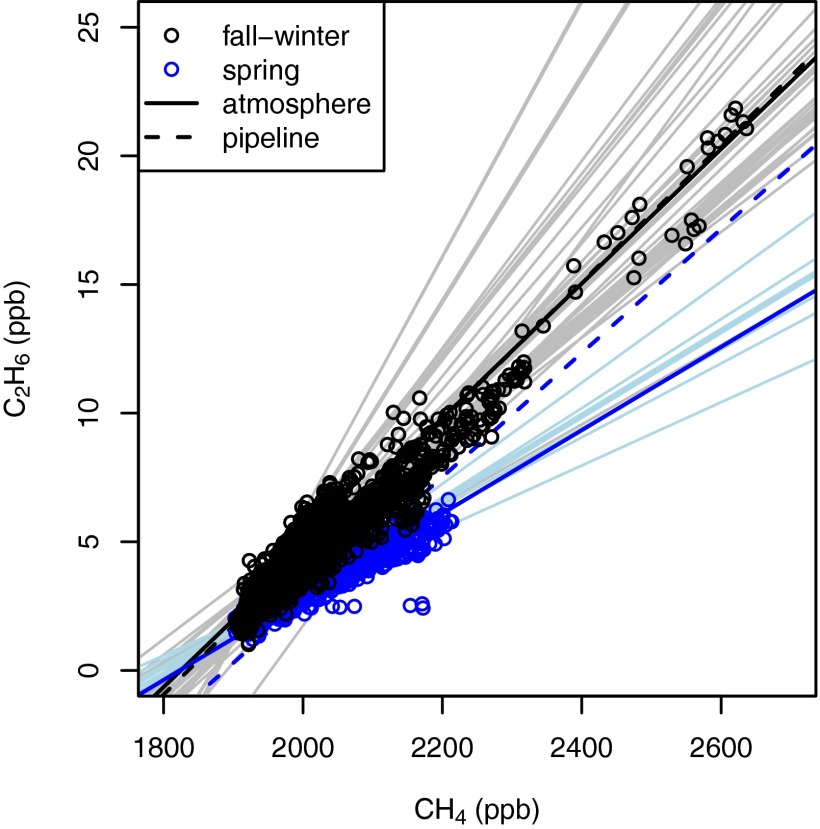
Ethane concentrations were measured with a laser spectrometer (15) at BU for 3 mo in the fall and winter of 2012–13 and 1 mo in the late spring of 2014 (SI Appendix, Fig. S6). Covariances between atmospheric C2H6 and CH4 observations were determined from the daily slopes of a linear model that minimizes χ2 (16) of 5-min median afternoon data (Fig. 4 and SI Appendix, section S2.1). The median of the daily slopes of atmospheric C2H6 versus CH4 was 2.6 (2.5, 2.8) % during the cool season and 1.6 (1.4, 1.7) % during the warm season, obtained from days with a coefficient of determination (R2) > 0.75 (∼50% of the days).
Fig. 4.
Five-minute median atmospheric C2H6 and CH4 measurement points at BU in fall and winter of 2012–2013 (black) and spring of 2014 (blue), χ2 optimization lines fit to each day (light lines), average fit lines for both seasons from all days with R2 > 0.75 (bold solid lines), and lines with slopes of pipeline C2H6/CH4 (dashed lines).
The average C2H6 and CH4 ratio in the NG flowing into the region during the two atmospheric measurement periods was 2.7 ± 0.0% in the fall and winter of 2012–2013 and 2.4 ± 0.1% in the spring of 2014, determined from hourly gas quality data from the three main pipelines that serve the region (17, 18) (SI Appendix, Figs. S7 and S8, and section S2.2). The quotient of the C2H6 and CH4 ratios in the atmosphere and pipeline demonstrates that NG contributed 98 (92, 105) and 67 (59, 72) % of the ΔCH4 in Boston in the cool and warm seasons, respectively. This result is insensitive to assumptions about the relative contribution of the three pipelines that supply the region and to the filtering criteria for the atmospheric data (SI Appendix, section S2.3).
Methane and Natural Gas Emissions in Greater Boston
Methane enhancements were modeled at BU and COP with the Stochastic Time-Inverted Lagrangian Transport (STILT) model (19), coupled to the Weather Research and Forecasting (WRF) meso-scale meteorological model run at 1-km2 grid resolution (WRF-STILT; ref. 20; SI Appendix, section S3.1). WRF-STILT generates footprints (with units ΔCH4 per unit surface flux), which represent the sensitivity of each measurement point in space and time to upwind surface fluxes. Both urban measurement sites were sensitive to emissions from the greater Boston region, with COP sensitive to a larger area than BU due to its higher altitude (Fig. 1 and SI Appendix, Table S2).
A spatially resolved prior model of CH4 emissions was constructed for the study region (SI Appendix, section S3.2.2, Fig. S12, and Table S4) and combined with WRF-STILT footprints to generate a set of simulated ΔCH4 values for each hour at each measurement station. The emission inventory was scaled for each season to equalize mean afternoon (11–16 h EST) modeled and observed ΔCH4, providing optimized CH4 emission rates for the region. Detailed methods and results for the model framework, including details on the emissions error quantification and results from alternative methodological approaches, are given in SI Appendix, sections S3 and S4. Observation-model comparisons are shown in Fig. 3 and SI Appendix, Figs. S13 and S14.
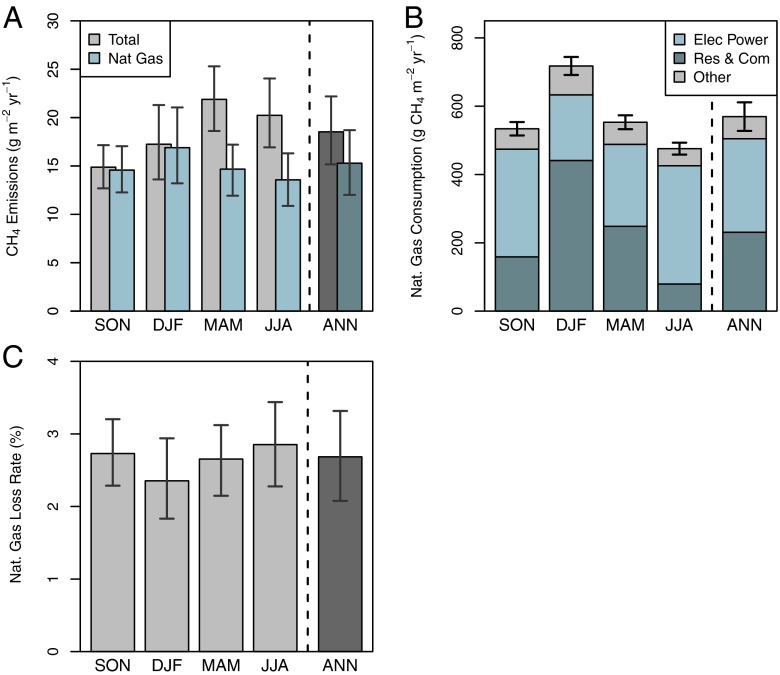
The mean annual optimized emission rate for the study area was 18.5 ± 3.7 g CH4⋅m−2⋅y−1 from all sources (Fig. 5A). Seasonal variations of total CH4 emissions were modest, with fluxes in spring and summer marginally higher than in fall at the 95% confidence level (Fig. 5A). The weak seasonality of observed ΔCH4 (Fig. 2) and the CH4 flux rate is consistent with the finding that most of the emissions are from thermogenic gas, rather than biological processes, which would likely depend more strongly on season (21, 22). When data from each urban site are analyzed independently, CH4 emission results are not significantly different (SI Appendix, Fig. S4), despite the large differences in ΔCH4 (Fig. 2) and modeled footprints (Fig. 1) between the two sites. This result provides strong support for the observation-model framework, which is further strengthened by the robustness of the emission result to adoption of different model frameworks (SI Appendix, sections S4.2–S4.3).
Fig. 5.
Seasonal and annual average (±95% confidence intervals) (A) optimized CH4 emissions in total and from NG, (B) NG consumption by sector, and (C) NG loss rates, derived from CH4 concentration observations from the BU and COP sites together. (B) Consumption categories are electric power, residential and commercial, and other, which is comprised of industrial, vehicle fuel, and pipeline and distribution use (SI Appendix, section 3.2.1).
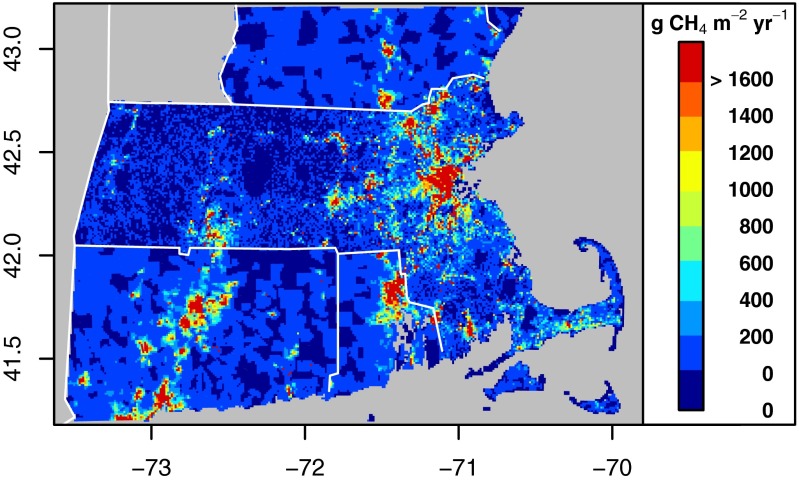
To assess the fraction of delivered NG emitted to the atmosphere, we constructed a spatially explicit estimate of NG consumption in the region (Fig. 6 and SI Appendix, section S3.2.1). Fractional loss rates for the region were obtained by multiplying optimized emissions by the fractional contribution of NG to the atmospheric signal, as indicated by the ethane tracer data, and dividing by the mean NG consumption in the region (Fig. 5 A and B). The inferred mean annual NG loss rate in the study area was 2.7 ± 0.6% of the total delivered gas in 2012–2013, with little seasonal dependence (Fig. 5C). Uncertainties in the average loss rates were calculated by summing in quadrature the relative errors for the average emissions, atmospheric NG fraction, and NG consumption terms (SI Appendix, section S3.2.1).
Fig. 6.
Reconstructed geographical distribution of NG consumption, in units of CH4 mass flux, during September 2012 through August 2013 for the four states included in the study region (SI Appendix, section S3.2.1).
The modest seasonality of the inferred NG loss rate (Fig. 5C) is driven by the small seasonal variability in total NG consumption (Fig. 5B). Our analysis makes no assumptions about the relative contribution to emissions of specific NG-consuming sectors or emission processes (SI Appendix, section S3.2.1), which could individually have very different loss rates than the aggregate estimate generated by this study. Our finding that the regional average NG emission rate was seasonally invariant may indicate that it does not strongly depend on the seasonally varying components of the NG system, or could result from multiple compensating processes.
Comparison with Atmospheric Studies and Inventories
Two recent studies in Los Angeles covering ∼2 mo provide the only previous atmosphere-based (“top-down”) estimates of emissions from NG in an urban area, 1–2% (0.7–3% when accounting for the error ranges) of total NG consumed in the basin (10, 11). However, attribution of CH4 emissions to pipeline gas in Los Angeles is complicated by the presence of current and abandoned oil and gas wells, refinery operations, and natural CH4 seeps, in addition to NG consumption. Other studies have estimated total CH4 emission fluxes from a number of urban areas around the world (SI Appendix, Table S1), using atmospheric data-model frameworks of varying sophistication, but have not quantitatively attributed fluxes to NG. Our value for total CH4 emissions in Boston is at the low end of the overall range of fluxes reported for other urban areas (SI Appendix, Table S1), suggesting that total CH4 emission rates in Boston are not anomalous.
The US greenhouse gas (GHG) inventory (23) attributes 3,302 Gg of CH4 emissions to NG transmission, storage, and distribution in 2012, equal to ∼0.7% of the NG delivered to consumers (24). The key input data for NG distribution systems in the national inventory are emissions factors developed from industry measurements (25) and activity data on miles of pipeline by material and counts of metering and regulating stations, customer meters, and pipeline maintenance events and mishaps (23). Emissions of NG in our study area are equal to ∼8% of US emissions attributed to distribution, transport, and storage, and ∼23% of national emissions from distribution alone, a notably higher fraction than the ∼3% of US residential and commercial gas consumed in the study region. More detailed comparison of our results for the Boston urban region to the US GHG inventory is not possible because the inventory is not spatially disaggregated.
Massachusetts has compiled a state GHG inventory (26) (SI Appendix, Table S4) using the same methods as the national inventory with state-level data, where available, and reports CH4 emissions from NG systems equal to ∼1.1% of NG consumed in the state. The larger loss fraction implied by the Massachusetts (∼1.1%) versus the national (∼0.7%) inventory is likely due to larger proportions of cast iron and bare steel pipelines (27), which have higher emission factors (23). Because most (68%) of our study region lies in Massachusetts, and most (88%) of the NG delivered in Massachusetts is consumed in the region, this value approximates the result that would be obtained by downscaling the national inventory to the study region. Our result for the NG loss fraction is approximately two to three times larger than that implied by the state inventory (although no uncertainty range is reported for the latter).
NG companies also report their GHG emissions and NG losses to public agencies. Methane emission and NG delivery data reported to both the US Environmental Protection Agency (28) and Massachusetts GHG Reporting Programs (29) show NG loss rates of 0.4–1.6% among individual NG distribution companies in Massachusetts in 2012 and 2013, with an average of 0.6%, weighted by delivered NG volumes. Data reported to the US Energy Information Administration (30) for “losses from leaks, damage, accidents, migration and/or blow down” indicate loss rates of 0–1.1%, with a weighted average of 0.4%, among Massachusetts NG distribution companies in 2012 and 2013.
Policy analyses of NG distribution emissions (31, 32) sometimes use reported quantities of “lost and unaccounted-for” (LAUF) gas, an accounting term and cost-recovery mechanism reported by utilities to public utility commissions. LAUF fractions reported by individual distribution companies in Massachusetts in 2012 and 2013 were 0–4.6%, with a weighted average of 2.7% (33). However, LAUF encompasses leaks, metering and accounting inaccuracies, and theft (34), and hence the relationship between LAUF and NG emissions is unknown.
Deficiencies in Existing Estimates
Several possible reasons may explain why existing methodologies predict lower CH4 emissions from NG than we observe in the Boston urban region.
i) Not all emission sources are inventoried. The US and Massachusetts inventories (23, 26) do not include NG losses occurring downstream of customer meters, neither at large industrial facilities, nor in residential and commercial settings.
ii) Leak surveys are not comprehensive. Leak surveys (e.g., refs. 13 and 35) are based on detection of discrete, highly elevated atmospheric signals, expressed at accessible locations. Numerous small leaks can occur without posing a safety hazard while still contributing significantly to the total CH4 source, and would require sensitive and accurate measurements for detection and quantification. Some NG leaks may be emerging in locations that are difficult to access (e.g., indoors, on private property, through sewers or subway tunnels) with conventional surveys.
iii) Sampling protocols used to calculate emission factors have significant limitations. Due to practical constraints, NG emission factors are calculated from very small samples relative to the population they are intended to represent, and measurements are obtained from short-duration, nonrepeated campaigns in a limited number of locations (25). These limitations can lead to undersampling of infrequent, high-emission events (6). Measurement of emissions from individual components requires access to restricted, privately owned facilities, which could lead to sample bias (6), whether intentional or not. Inaccurate device and activity counts (6), and incomplete understanding of controlling variables, may lead to inappropriate extrapolation of emission factors in space and time. Data collected through new reporting requirements (36) may help address some of these limitations for particular devices and processes.
These issues arise from our fundamental lack of knowledge about the specific sources and processes responsible for the discrepancies found in this and other studies (6), and about the requirements for designing and testing a statistically rigorous accounting of emissions from the NG supply chain. Both high-emission events and diffuse low-emission sources need to be sampled continuously or repeatedly to gain understanding of the true distribution of NG emissions. In addition to emission data, improved quantification of the fractional NG loss rate requires the compilation and availability of more rigorous, standardized, and detailed data on NG flows. Datasets should be spatially explicit to facilitate collation of disparate datasets and analysis of specific areas. Closer cooperation in data sharing and synthesis and wide data dissemination are needed to better constrain CH4 emissions from NG and to provide the information needed to reduce those emissions.
Significance of Natural Gas Emissions
This study used 1 y of atmospheric CH4 measurements from a network of observing stations, a high-resolution modeling framework, atmospheric measurements of C2H6, a tracer for NG emissions, and statistics on NG composition and consumption to quantify the NG emission rate for the Boston urban area as 2.7 ± 0.6% (95% confidence interval) of consumed NG, approximately two to three times higher than that given by the most applicable (state) GHG inventory. The total volume of emitted gas in the study area over 1 y was ∼15 billion standard cubic feet (scf), valued conservatively at ∼$90 million [using 2012 and 2013 Massachusetts city gate prices (37)], equal to ∼6 scf⋅person−1⋅d−1 [using the study area population of ∼7.2 million (38)].
The US President’s Methane Strategy (5) for reducing downstream NG emissions describes state and utility programs to accelerate infrastructure replacement, but offers no new federal initiatives for the distribution sector (39). A new Massachusetts law (40) is intended to improve the classification, reporting, and repair of NG leaks. The current study provides an example of a measurement-model framework that can be used to evaluate the effectiveness of programs aimed at reducing NG distribution emissions. More detailed measurements and accounting, following a more rigorous statistical design, are needed to fully characterize and prioritize the components, geographic areas, and supply chain sectors that are contributing the most emissions. The full environmental benefits of using NG in place of other fossil fuels will only be realized through active measures to decrease direct losses to the atmosphere, including in receiving areas such as the Boston urbanized region.
Supplementary Material
Acknowledgments
We thank Bruce Daube, Jasna Pittman, Bill Munger, Maryann Sargent, Elaine Gottlieb, Rachel Chang, Greg Santoni, Roisin Commane, Ben Lee, Brittain Briber, Ryan McGovern, and Tara Yacovitch, for help with the measurements; Jennifer Hegarty, Marikate Mountain, John Henderson, and the late Janusz Eluszkiewicz for their contributions to the WRF-STILT modeling; Conor Gately, Xiaojing Tang, and Robert Kaufmann for assisting with the customized emission inventory; George McNaughton, Deborah Warren, Brian Swett, and Joel Sparks for providing access to measurement sites; Robert Harriss, Steven Hamburg, Brian Lamb, Thomas Ferrara, Peter Huybers, Melissa Weitz, Mark de Figueiredo, Bill Irving, Sue Fleck, and Thomas Rogers, for helpful discussion; and the Barr Foundation for lending spectrometers. Funding for this study was provided by the TomKat Charitable Trust via the Harvard School of Engineering and Applied Science Dean’s Innovation Fund, Boston University College of the Arts and Sciences, the National Science Foundation through Major Research Instrumentation Award 1337512 and Collaborative Research Awards 1265614, 1302902, and 0948819; the National Aeronautics and Space Administration through the Earth and Space Science Graduate Research Fellowship NNX14AK87H, Interdisciplinary Science Award NNX12AM82G, Carbon Monitoring System Award NNH13CK02C, and Carbon Cycle Science Award NNX11AG47G; and Environmental Defense Fund (EDF) Award 0146-10100. Funding for EDF’s methane research series was provided by Fiona and Stan Druckenmiller, the Heising–Simons Foundation, Bill and Susan Oberndorf, Betsy and Sam Reeves, the Robertson Foundation, the Alfred P. Sloan Foundation, the TomKat Charitable Trust, and The Walton Family Foundation.
Footnotes
The authors declare no conflict of interest.
This article is a PNAS Direct Submission.
Data deposition: Archival datasets are available through the Boston Regional Atmospheric Measurement Network Dataverse at dx.doi.org/10.7910/DVN/28530.
This article contains supporting information online at www.pnas.org/lookup/suppl/doi:10.1073/pnas.1416261112/-/DCSupplemental.
References
- 1.Myhre G, et al. Anthropogenic and natural radiative forcing. In: Stocker TF, et al., editors. Climate Change 2013: The Physical Science Basis. Contribution of Working Group I to the Fifth Assessment Report of the Intergovernmental Panel on Climate Change. Cambridge Univ Press; Cambridge, UK: 2013. pp. 659–740. [Google Scholar]
- 2.Fiore AM, Jacob DJ, Field BD, Streets DG, Fernandes SD. Linking ozone pollution and climate change: The case for controlling methane. Geophys Res Lett. 2002;29(19):25-1–25-4. [Google Scholar]
- 3.Ciais P, et al. Carbon and other biogeochemical cycles. In: Stocker TF, et al., editors. Climate Change 2013: The Physical Science Basis. Contribution of Working Group I to the Fifth Assessment Report of the Intergovernmental Panel on Climate Change. Cambridge Univ Press; Cambridge, UK: 2013. pp. 465–570. [Google Scholar]
- 4.West JJ, Fiore AM, Horowitz LW, Mauzerall DL. Global health benefits of mitigating ozone pollution with methane emission controls. Proc Natl Acad Sci USA. 2006;103(11):3988–3993. doi: 10.1073/pnas.0600201103. [DOI] [PMC free article] [PubMed] [Google Scholar]
- 5.The White House 2014 Climate Action Plan: Strategy to Reduce Methane Emissions. Available at www.whitehouse.gov/sites/default/files/strategy_to_reduce_methane_emissions_2014-03-28_final.pdf. Accessed March 28, 2014.
- 6.Brandt AR, et al. Energy and environment. Methane leaks from North American natural gas systems. Science. 2014;343(6172):733–735. doi: 10.1126/science.1247045. [DOI] [PubMed] [Google Scholar]
- 7.Blake DR, Woo VH, Tyler SC, Rowland FS. Methane concentrations and source strengths in urban locations. Geophys Res Lett. 1984;11(12):1211–1214. [Google Scholar]
- 8.Wunch D, Wennberg PO, Toon GC, Keppel-Aleks G, Yavin YG. Emissions of greenhouse gases from a North American megacity. Geophys Res Lett. 2009;36:L15810. [Google Scholar]
- 9.Hsu YK, et al. Methane emissions inventory verification in southern California. Atmos Environ. 2010;44:1–7. [Google Scholar]
- 10.Wennberg PO, et al. On the sources of methane to the Los Angeles atmosphere. Environ Sci Technol. 2012;46(17):9282–9289. doi: 10.1021/es301138y. [DOI] [PubMed] [Google Scholar]
- 11.Peischl J, et al. Quantifying sources of methane using light alkanes in the Los Angeles basin, California. J Geophys Res Atmos. 2013;118:1–17. [Google Scholar]
- 12.Santoni GW. 2013. Fluxes of atmospheric methane using novel instruments, field measurements, and inverse modeling. PhD thesis (Harvard University, Cambridge, MA)
- 13.Phillips NG, et al. Mapping urban pipeline leaks: Methane leaks across Boston. Environ Pollut. 2013;173:1–4. doi: 10.1016/j.envpol.2012.11.003. [DOI] [PubMed] [Google Scholar]
- 14.US Census Bureau 2012 2010 American Community Survey 5-Year Estimates. Available at www.census.gov. Accessed September 30, 2013.
- 15.Yacovitch TI, et al. Demonstration of an ethane spectrometer for methane source identification. Environ Sci Technol. 2014;48(14):8028–8034. doi: 10.1021/es501475q. [DOI] [PubMed] [Google Scholar]
- 16.Press WH, Teukolsky SA, Vetterling WT, Flannery BP. Numerical Recipes in FORTRAN: The Art of Scientific Computing. 2nd Ed. Cambridge Univ Press; New York: 2002. Modeling of data. Chap 15. [Google Scholar]
- 17. Algonquin Gas Transmission, LLC (2014) Link System Informational Postings, Gas Quality, Hourly Chromatograph Postings (Spectra Energy, Houston TX). Available at infopost.spectraenergy.com/infopost. Accessed July 9, 2014.
- 18. Tennessee Gas Pipeline Company, LLC (2014) Informational Postings, Gas Quality, Hourly Gas Quality Data (Kinder Morgan, Houston, TX). Available at webapps.elpaso.com/PortalUI/DefaultKM.aspx?TSP=TGPD. Accessed November 28, 2012 through July 9, 2014.
- 19.Lin JC, et al. A near-field tool or simulating the upstream influence of atmospheric observations: The Stochastic Time-Inverted Lagrangian Transport (STILT) model. J Geophys Res. 2003;108:4493–4510. [Google Scholar]
- 20.Nehrkorn T, et al. Coupled weather research and forecasting-stochastic time-inverted Lagrangian transport (WRF-STILT) model. Meteorol Atmos Phys. 2010;107:51–64. [Google Scholar]
- 21.Van Hulzen JB, Segers R, van Bodegom PM, Leffelaar PA. Temperature effects on soil methane production: An explanation for observed variability. Soil Biol Biochem. 1999;31(14):1919–1926. [Google Scholar]
- 22.Spokas K, Bogner J, Chanton J. 2011. A process-based inventory model for landfill CH4 emissions inclusive of seasonal soil microclimate and CH4 oxidation. J Geophys Res Biogeosci 116:G04017.
- 23.US Environmental Protection Agency 2014 Inventory of U.S. Greenhouse Gas Emissions and Sinks: 1990–2012, EPA-430-R-14-003. Available at www.epa.gov/climatechange/ghgemissions/usinventoryreport.html. Accessed June 1, 2014. [PubMed]
- 24. US Energy Information Administration (2014) Natural Gas Consumption by End Use. Available at www.eia.gov/dnav/ng/ng_cons_sum_dcu_nus_a.htm. Accessed December 26, 2014.
- 25.US Environmental Protection Agency/Gas Research Institute 1996. Methane Emissions from the Natural Gas Industry, eds Harrison M, Shires T, Wessels J, Cowgill R (Radian International LLC for National Risk Management Research Laboratory, Research Triangle Park, NC)
- 26.Massachusetts Department of Environmental Protection 2014 Massachusetts Annual Greenhouse Gas Emissions Inventory: 1990 through 2011, with Partial 2012 Data. Available at www.mass.gov/eea/docs/dep/air/climate/maghginv.xls. Accessed December 27, 2014.
- 27. US Department of Transportation, Pipeline Hazardous Materials Safety Administration, Pipeline Replacement Updates. Available at opsweb.phmsa.dot.gov/pipeline_replacement. Accessed December 27, 2014.
- 28.US Environmental Protection Agency 2014 2012 and 2013 Greenhouse Gas Emissions from Large Facilities. Available at ghgdata.epa.gov/ghgp. Accessed December 26, 2014. [PubMed]
- 29.Massachusetts Department of Environmental Protection 2014 MassDEP GHG Reporting Program Summary Report and Facility List, Emissions Year 2012 and 2013. Available at www.mass.gov/eea/agencies/massdep/climate-energy/climate/approvals/ma-greenhouse-gas-emissions-reporting-program.html. Accessed December 26, 2014.
- 30. US Energy Information Administration (2014) Natural Gas Annual Respondent Query System, Annual Report on Natural and Supplemental Gas Supply and Disposition. Available at www.eia.gov/cfapps/ngqs/ngqs.cfm?f_report=RP1. Accessed December 26, 2014.
- 31.Markey EJ. 2013 America Pays for Gas Leaks. A Report Prepared for Senator Markey by the House Natural Resources Committee Democratic Staff and Senator Markey’s Staff. Available at www.markey.senate.gov/documents/markey_lost_gas_report.pdf. Accessed August 7, 2013.
- 32.Cleveland S. 2012 Into Thin Air (Conservation Law Foundation). Available at www.clf.org/static/natural-gas-leaks/WhitePaper_Final_lowres.pdf. Accessed February 28, 2013.
- 33.Pipeline and Hazardous Materials Safety Administration 2013 Distribution Annual Data. Available at www.phmsa.dot.gov/staticfiles/PHMSA/DownloadableFiles/Pipeline2data/annual_gas_distribution_2013.zip. Accessed December 27, 2014.
- 34.Costello K. 2013. Lost and Unaccounted-for Gas: Practices of State Utility Commissions (National Regulatory Research Institute, Silver Spring, MD) Report No. 13-16.
- 35. US Code of Federal Regulations, Title 49, Subtitle B, Chapter 1, Subchapter D, Part 192, Section 192.723, Distribution systems: Leakage surveys. Available at www.gpo.gov/fdsys/pkg/CFR-2013-title49-vol3/xml/CFR-2013-title49-vol3-sec192-723.xml.
- 36.US Environmental Protection Agency 2014 Greenhouse Gas Reporting Program, Subpart W, Petroleum and Natural Gas Systems Subpart W Rulemaking Resources. Available at www.epa.gov/ghgreporting/reporters/subpart/w-regdocs.html. Accessed December 27, 2014. [PubMed]
- 37. US Energy Information Administration (2014) Natural Gas Prices. Available at www.eia.gov/dnav/ng/ng_pri_sum_dcu_nus_a.htm. Accessed December 27, 2014.
- 38.US Census Bureau 2012 2010 Decennial Census. Available at www.census.gov. Accessed June 25, 2014.
- 39.US Environmental Protection Agency, Office of Inspector General 2014 Improvements Needed in EPA Efforts to Address Methane Emissions From Natural Gas Distribution Pipelines, Report No. 14-P-0324. Available at www.epa.gov/oig/reports/2014/20140729-14-P-0325.pdf. Accessed July 28, 2014.
- 40.Massachusetts Laws 2014 An Act Relative to Natural Gas Leaks. Available at malegislature.gov/Laws/SessionLaws/Acts/2014/Chapter149. Accessed June 27, 2014.
Associated Data
This section collects any data citations, data availability statements, or supplementary materials included in this article.


