Significance
It is widely accepted that the structure of a biological system limits the range of possible novel phenotypes accessible by mutation. Here we show that it is not only the phenotype that determines this evolvability, but also the dynamics of how that phenotype is built during development. We perform theoretical analysis on a group of simple gene regulatory circuits that have recently been shown to fall into a handful of distinct dynamical mechanisms all producing the same phenotype: interpreting a morphogen gradient into a single-domain of gene expression. We find that the dynamical mechanisms underlying each circuit impose strong constraints on its evolvability, as hypothesized in a more general context by John Maynard Smith in the 1980s.
Keywords: dynamical mechanism, phenotypic innovation, genotype–phenotype maps, developmental constraints, evolvability
Abstract
To what extent does the dynamical mechanism producing a specific biological phenotype bias the ability to evolve into novel phenotypes? We use the interpretation of a morphogen gradient into a single stripe of gene expression as a model phenotype. Although there are thousands of three-gene circuit topologies that can robustly develop a stripe of gene expression, the vast majority of these circuits use one of just six fundamentally different dynamical mechanisms. Here we explore the potential for gene circuits that use each of these six mechanisms to evolve novel phenotypes such as multiple stripes, inverted stripes, and gradients of gene expression. Through a comprehensive and systematic analysis, we find that circuits that use alternative mechanisms differ in the likelihood of reaching novel phenotypes through mutation. We characterize the phenotypic transitions and identify key ingredients of the evolutionary potential, such as sensitive interactions and phenotypic hubs. Finally, we provide an intuitive understanding on how the modular design of a particular mechanism favors the access to novel phenotypes. Our work illustrates how the dynamical mechanism by which an organism develops constrains how it can evolve. It is striking that these dynamical mechanisms and their impact on evolvability can be observed even for such an apparently simple patterning task, performed by just three-node circuits.
Evolution occurs through mutations on existing genotypes, potentially transforming the original phenotype or trait into a novel one, with latent beneficial consequences. It is a fundamental problem in biology to understand the relationship between a genotype and the associated phenotypes accessible through mutations, in other words, its evolvability. From the many definitions of evolvability (1, 2), we refer here to the ability of genotypes to access novel phenotypes, irrespective of the subsequent process of natural selection.
To understand how a phenotype evolves we need to consider that a huge number of distinct genotypes can achieve that same phenotype. For example, hundreds of distinct RNA sequences fold in the same secondary structure (3), as do proteins in their 3D structure (4). Similarly, distinct gene regulatory architectures can produce the same gene expression pattern (5, 6) or temporal behavior (7, 8). However, among these genotypes, some are more evolvable than others. The existing studies have targeted two key drivers of evolvability: a genotype’s design and a genotype’s location within a neutral space.
A first class of studies focuses on a circuit’s general architectural features, such as feed-back or feed-forward loops, revealing that these distinct families of designs or motifs differ in their evolvability (9, 10). The second class of studies centers not on single designs but on the whole collection of genotypes capable of producing the same phenotype. These genotypes with a common phenotype form a region in genotype space termed a neutral space or neutral network (3), as mutations within this region produce no change in the phenotype.
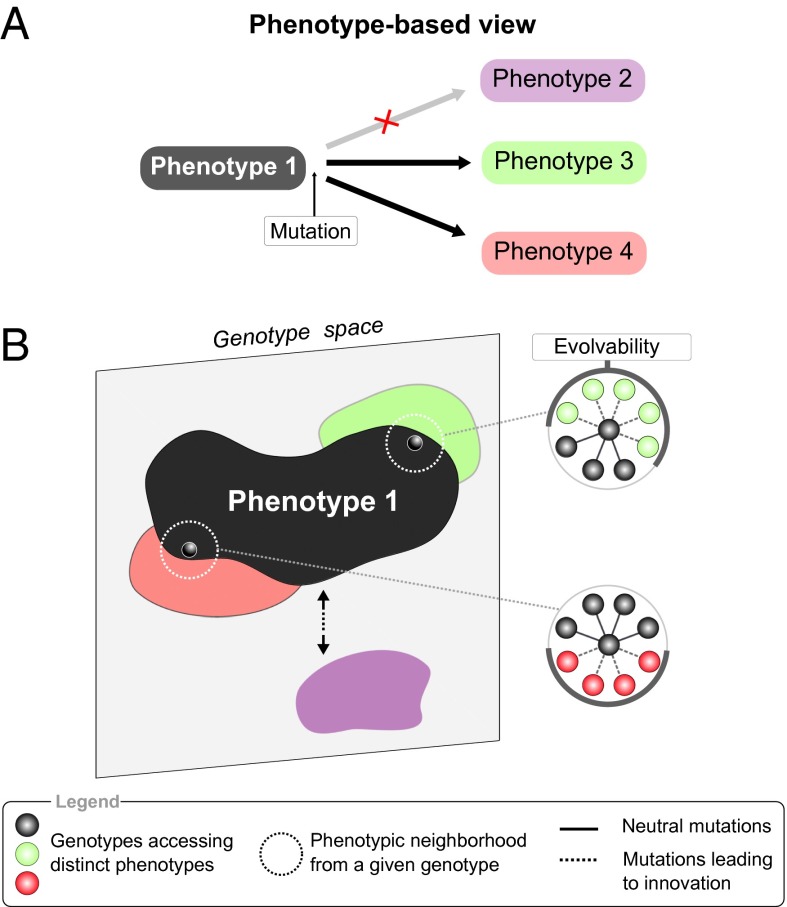
As revealed by many studies, the existence of neutral spaces has two major consequences to the evolutionary process. First, these neutral spaces often appear as fully connected and dense regions (11–13). Therefore, although genotypes internal to the neutral space are highly robust to mutations (i.e., not evolvable), only genotypes close to the edges of the neutral space might access novel phenotypes. From this perspective, neutral mutations and thus the process of neutral drift can generate cryptic genetic variation (14) by moving a species closer to the edges of the neutral space into a more evolvable state (12, 15). Second, different positions in genotype space give access to distinct novel phenotypes. Large neutral spaces percolate through genotype space, providing access to a diversity of novel phenotypes from different genotypes (11–13). In a nutshell, the accessible innovations are critically determined by a genotype’s position in genotype space (16) (Fig. 1).
Fig. 1.
Phenotype-based view on evolvability. (A) Evolvability accounts for the accessible novel phenotypes, whereas developmental constraints imply that certain hypothetical forms are not possible: phenotype 2 (purple) is not available by gradual mutation. (B) Innovations accessible from a given genotype constitute its phenotypic neighborhood. The arrangement and diversity of this neighborhood is a measure of the genotype’s evolvability (16). Genotype space is high dimensional, but we schematically represent it here in 2D for illustrative purposes.
Although the abovementioned features of genotype-phenotype maps have been much studied, another important aspect of the system has thus far been neglected. None of the existing studies addressed the impact of the underlying dynamical mechanism of a gene circuit on its evolvability. By mechanism, we mean the causal dynamics responsible for the trajectory of the system (i.e., the spatiotemporal course of gene expression) resulting in the final phenotype. In addition to the increasing awareness that dynamics itself is a decisive property of gene circuits (17), several specific observations led us to hypothesize that dynamics does impact on evolvability.
First, to achieve a given biological function, a gene circuit uses one of few fundamental solutions referred to as dynamical mechanisms (5–7, 18–20). More specifically, circuits with the same underlying dynamical mechanism share a common arrangement of phase portraits (20, 21). Second, Cotterell and Sharpe (6) revealed that, for a simple patterning function, it is not possible to smoothly and functionally transition from one mechanism to another. That is, in contrast to the common view (11–13), this particular neutral space does not form a single fully connected region when the underlying mechanism is taken into account. Instead, the neutral space for the simple patterning function studied by Cotterell and Sharpe (6) breaks up into scattered islands of genotypes characterized by distinct underlying mechanisms. These observations suggest that evolvability may be constrained specifically by the dynamical mechanism of the gene circuit. As neutral spaces can be broken up into a discrete collection of separated islands, the process of neutral drift may be limited to these mechanism-specific regions.
To assess the impact of dynamical mechanisms, we chose to study circuits that control spatial (multicellular) gene expression patterns. It is well established in developmental biology that the spatial organization of gene expression orchestrates cell differentiation. Their diversification causes evolution of both modest morphological traits, such as novel pigmentation patterns (22), and major evolutionary breakthroughs, such as new body structures (23). Here we chose to address the interpretation of a morphogen gradient by a field of cells into different cell fates (5–7, 18, 24–27) (Fig. 2A), a critical patterning event in embryo’s morphogenesis (28). We build on the work of Cotterell and Sharpe (6), who extracted six fundamental mechanisms for this patterning task: Bistable, Incoherent feed-forward, Mutual Inhibition, Overlapping Domains, Classical, and Frozen Oscillator (Fig. 2B and SI Appendix, Fig. S1).
Fig. 2.
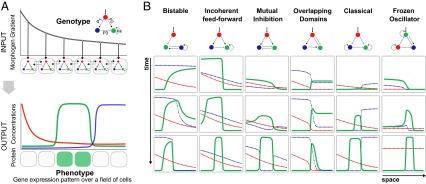
Alternative mechanisms to achieve a single phenotype. (A) Within the French Flag conceptual framework, a preestablished fixed concentration gradient (input) is interpreted by a one-dimensional row of cells into different cell fates through a threshold-dependent mechanism. Additionally, cells communicate to one another through diffusive gene products (dashed arrows). We exhaustively enumerate all possible three-gene circuit topologies and sample large numbers of genotypes (i.e., parameter values; SI Appendix, Methods). Solutions of our search are genotypes able to interpret the morphogen gradient into a band of gene expression (6). Similar exhaustive approaches have being adopted for exploring a variety of biological functions, such as temporal behaviors (7, 25) or other spatial patterning functions (5, 18). (B) A stripe-forming circuit uses one of six distinct mechanisms (6), each mechanism uses a distinct gene expression dynamics in space and time to reach the same phenotype. Importantly, Mutual Inhibition (bicoid-hunchback-knirps), Incoherent feed-forward (caudal-knirps-giant), and Classical (hunchback-krüppel-knirps) are involved in Drosophila anterior-posterior patterning (26), whereas Incoherent feed-forward controls the mesoderm inducer Xenopus Brachyury (27).
For the current study, we analyzed each of these six mechanisms independently and obtained a mechanism-specific measure of evolvability. We found that, indeed, the likelihood of accessing distinct phenotypic innovations is different for each dynamical mechanism, despite the fact that they all produce the same phenotype. Our analysis uncovers key features of the mechanistic neutral spaces and provides useful insight into how phenotypic transitions and thus innovations occur.
Results
Evolvability: Defined and Measured.
Numerous studies concerning evolvability of gene regulatory circuits use Boolean models to describe the state of a single cell. In contrast, we describe a multicellular tissue using a continuous gene regulatory model (both the variables and the regulatory function are continuous). We consider a genotype as a particular wiring design (“topology”) plus a given set of continuous parameter values for the strengths of gene interactions. The required phenotype is a stripe-like expression pattern of one of the constituent genes (Fig. 2A). This continuous model approach directly impacts the mutational possibilities. Unlike Boolean models, a mutation in the strength of a single interaction can occur without a change in the underlying topology representing, for example, a slight modification in the binding affinity of a transcription factor (e.g., a mutation in the sequence of a cis-regulatory region; SI Appendix, Discussion) (29, 30).
We explore the genotype space around a given genotype in an exhaustive and systematic manner by mutating all its gene interactions (SI Appendix, Fig. S2A). The value of gene interactions is increased or decreased by a percentage that we refer to as mutation strength (SI Appendix, Methods). For any given mutation, three phenotypic outcomes are possible: phenotypic innovation, phenotypic maintenance, or phenotypic loss (null or oscillatory phenotype) (SI Appendix, Fig. S2B). The relation between oscillatory phenotypes and stable patterns is an interesting question (SI Appendix, Discussion), but is not the main focus of this study. We measure evolvability as the proportion of genotypes within a mechanism that reach phenotypic innovation when subject to mutations. In other words, evolvability accounts for the likelihood of a genotype with specific dynamics to drift into a novel and stable phenotype.
Evolutionary Potential Is Mechanism Dependent.
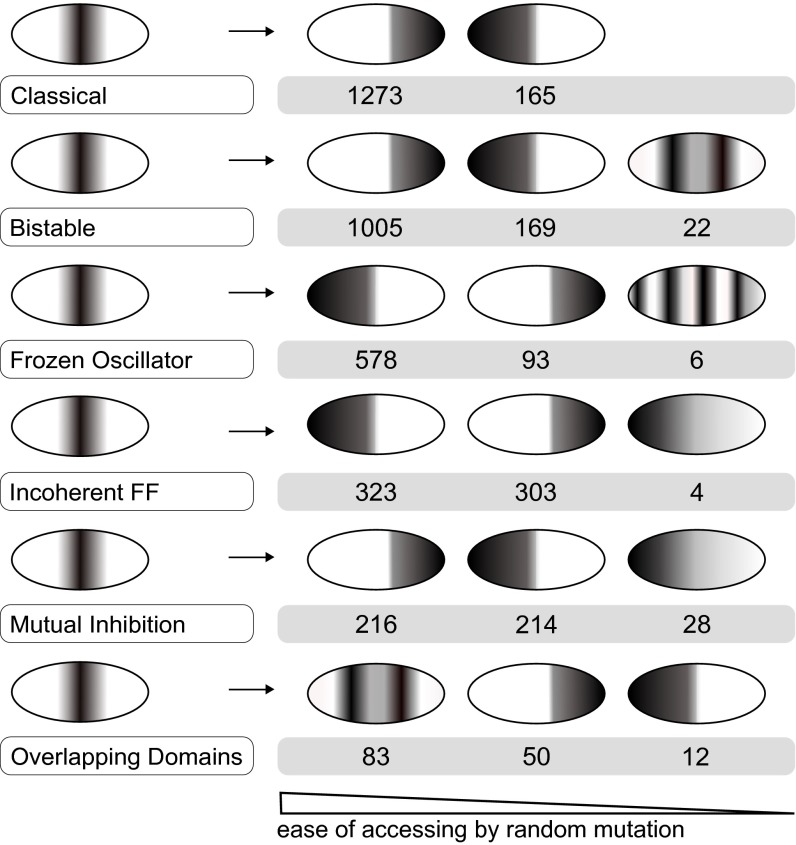
By establishing simple patterning criteria (SI Appendix, Methods), we classify novel phenotypes into seven pattern groups. An example of this type of pattern-change in a real system is shown in SI Appendix, Discussion. First, we separately monitor the evolvability of the six distinct mechanisms at a mutation strength of ±50% (Fig. 3). We found that circuits using distinct mechanisms for stripe formation differ substantially in the likelihood of reaching novel phenotypes. For each mechanism, Fig. 3 shows the range of novel phenotypes occurring at a frequency above 1/10,000. It is clear that some mechanisms have a much higher chance of evolving a novel phenotype than others. For example, mutations to Classical (top) have 10 times higher chance of producing a novel phenotype than mutations to Overlapping Domains (bottom). Additionally, the actual novel phenotypes that can be easily reached are different for each of the six mechanisms.
Fig. 3.
Differences in evolvability: schematics of novel phenotypes. Evolutionary potential is shown as the number of mutations out of 10,000 that permit access to distinct novel phenotypes. Values correspond to 50% mutation strength. Phenotypes accessible with a frequency below 1/10,000 (0.01% chance to be accessed through random mutation) are not considered. The accessibility to Gradient, Double Peak, and Multiple Stripes phenotypes is mechanism dependent.
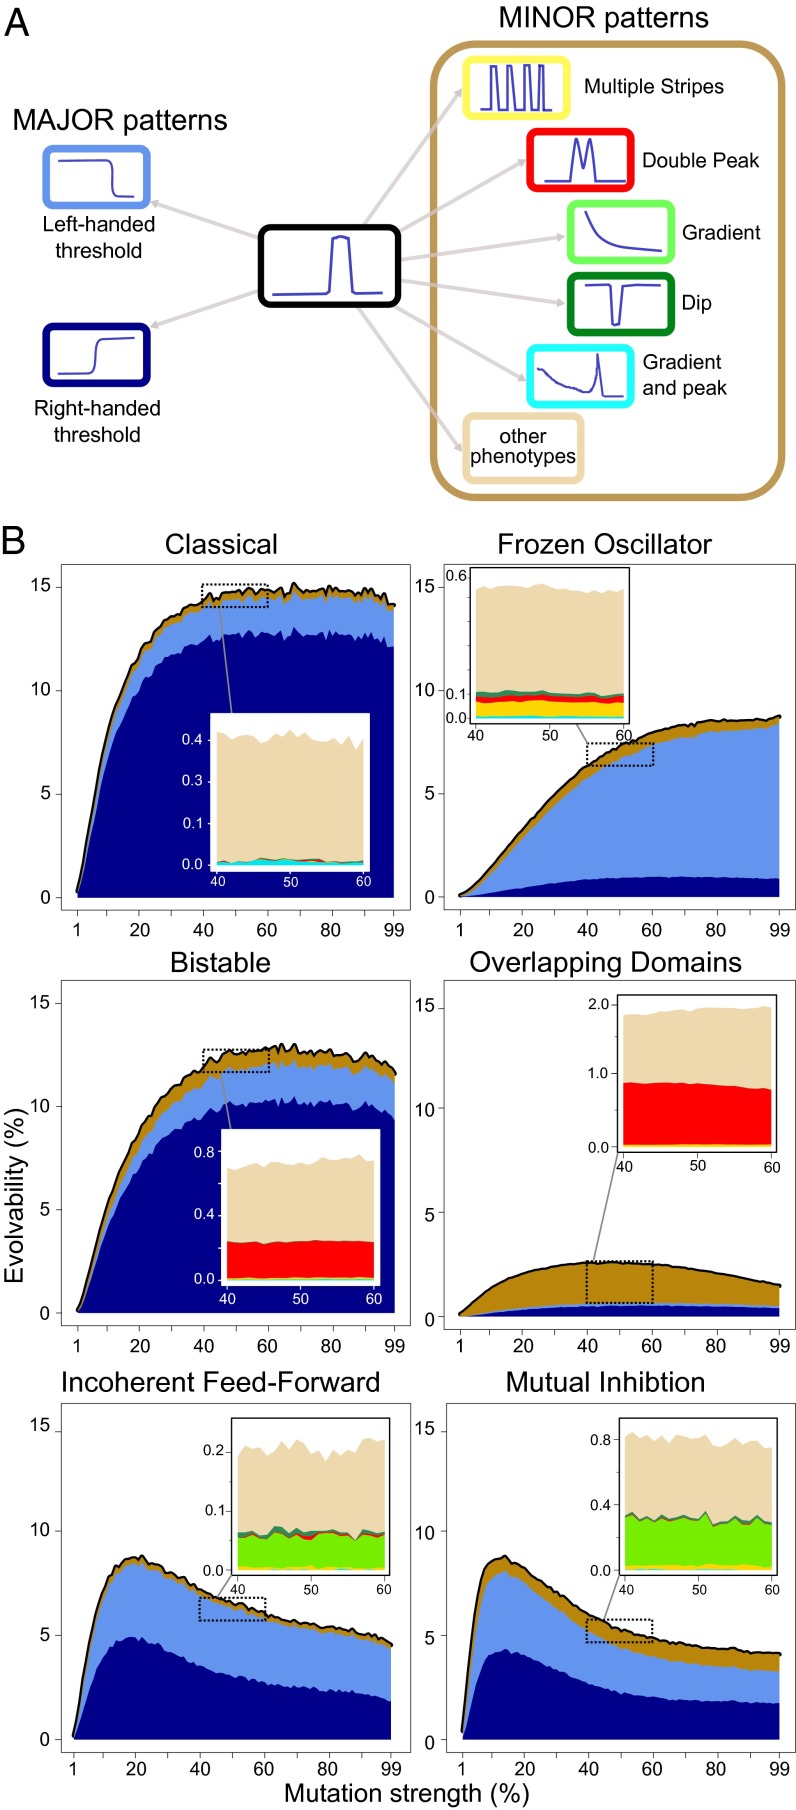
Next, we explored how the evolvability of each mechanism changes as the mutation strength is varied. Fig. 4 shows that the six mechanisms clearly have different evolvability profiles. For all mechanisms, the percentage of novel phenotypes initially increases as the mutational strength is raised. However, beyond a mutational strength of 20%, two mechanisms start to decrease again, Incoherent feed-forward and Mutual Inhibition, whereas other mechanisms continue a slower increase until saturating around 50% (Classical and Bistable). These differences can be considered a reflection of the geometry of local phenotype space, i.e., the distance, shape, and extension of novel neutral spaces adjacent to the original mechanism (SI Appendix, Fig. S3).
Fig. 4.
Dynamical mechanism influences evolvability. (A) Phenotype space is segmented into eight phenotypes: the stripe expression and seven novel gene expression patterns. They cover 90% of observed phenotypes accessible from the stripe phenotype. The remaining unclassified 10% largely represent rare hybrids of the seven groups mentioned (e.g., gradient plus threshold). (B) Evolvability as a function of mutation strength. Black line depicts whole evolvability profile, whereas the specific fractions of novel phenotypes appear in stacked area charts (zooms of the minor patterns in upper windows).
We classify novel patterns as major or minor according to how common they are, i.e., their accessibility by random mutation (Fig. 4A). We remark that major patterns are highly accessible from all mechanisms, whereas minor patterns are more restricted to specific mechanisms (Fig. 4B). Understanding the stripe-forming process of each mechanism can offer an intuitive explanation of these differences in accessibility. Indeed, the stripe phenotype is created through the establishment of a left and a right expression boundary, being the superposition of these two patterns. Any mutation that disrupts the establishment of one boundary leads to the complementary phenotype. This explains why the major patterns of right and left-handed thresholds are easily accessible, as they constitute a functional loss of one of the two modules. By contrast, a single mutation that simultaneously disrupts the establishment of both boundaries, leading for example to the gradient phenotype, is less likely to occur.
Regarding phenotypic novelty, the modular design of Frozen Oscillator explains why it is the mechanism from which the multiple stripes pattern is most readily accessible. Indeed, Frozen Oscillator consists of two modules: the negative feedback loop formed by the green and blue genes (Fig. 2B) forms an oscillator that is repressed by the red gene acting to freeze these oscillations. A stripe corresponds to a single frozen oscillation. Hence, mutations modifying the frequency of oscillations can produce more than a single oscillation and therefore lead to a periodic pattern such as multiple stripes.
In brief, consistent with our hypothesis on a mechanism-based view, the likelihood of accessing distinct innovations (i.e., the evolvability) varies for each mechanism. This conclusion does not depend on the details of the model such as the regulatory function or the size of the field of cells (SI Appendix, Discussion). Furthermore, we provide intuitive understanding of why particular phenotypic innovations are more probable from certain mechanisms. To describe the nature of transitions between phenotypes, we now focus on the level of single genotypes.
Distinct Mechanisms Show Distinct Phenotypic Neighborhoods.
To illustrate how the original phenotype is transformed into a novel phenotype, we use phenotype-transition diagrams to visualize transitions between patterns (Fig. 5) (these are not phase portraits; SI Appendix, Discussion). These diagrams exhaustively depict the phenotypic neighborhood from a given genotype. Because individual genotypes reside in a high-dimensional genotype space (i.e., the number of gene interactions determines the dimension), we construct all possible 2D sections through this genotype space. A section is created by choosing two gene interactions and allowing their value to vary while the rest of interactions are fixed (SI Appendix, Fig. S4). In this manner, the phenotypic neighborhood from a given genotype is composed of neutral spaces depicted as continuous colored zones. These phenotype-transition diagrams make it clear and understandable why for certain gene circuits, many parameter changes lead to novel phenotypes (SI Appendix, Fig. S5A), whereas for others, very few parameters changes are innovative (SI Appendix, Fig. S5B). By predicting the phenotypic outcome of a circuit subject to perturbation, these diagrams point out which specific gene interaction needs to be mutated, and with which intensity, in order for the circuit to produce a given novel phenotype. As a case study, Fig. 5 shows two characteristic sections from genotypes belonging to Frozen Oscillator and Bistable mechanisms.
Fig. 5.
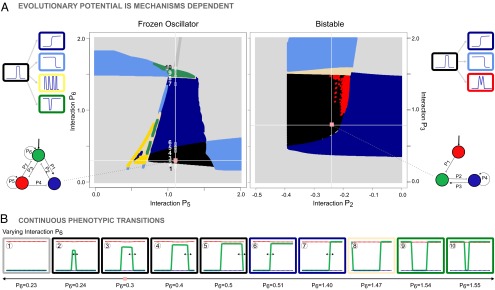
Characteristic phenotypic neighborhoods of two mechanisms. (A) Phenotype-transition diagrams from two original genotypes with underlying Frozen Oscillator and Bistable mechanisms and interaction strengths – = {4; −1; −0.08; −8; 1.1; 0.3; −0.25} and – = {−2.65; −0.24;0.79; 0.39}, respectively. Each point in the section corresponds to a particular genotype that is assigned a color corresponding to its resulting phenotype. Understanding particular concepts that are recurrent in studies of robustness and evolvability is intuitive using this type of visualization. The parameter robustness of an interaction is visually inferred and corresponds to the width of the black zone along the corresponding axis, for example, [0.7–1.5] range for interaction of the genotype with Bistable mechanism. In addition, the distance along the axis from the original genotype to the nearest novel phenotype provides a measure of the mutation strength needed to switch phenotype. (B) Evaluating the resulting phenotype while varying interaction 6 shows transitions between phenotypes are continuous. Particularly, frames 2–7 suggest interaction 6 governs the position of the right boundary of the stripe (black arrows).
Phenotypic Transitions Are Continuous.
Phenotype-transition diagrams show that drifting from one phenotype to another does not require a transient loss of phenotype. In Fig. 5B, we illustrate the continuity of phenotypic transitions by smoothly changing particular interactions in a genotype. Some of the transitions reveal the role of particular gene interactions in pattern formation. For example, the strength of interaction controls the shift of the stripe’s right boundary (Fig. 5B, frames 2–7), whereas the strength of both and interactions controls the shift of the stripe’s left boundary (SI Appendix, Fig. S6).
We observe that allows a switch from the stripe phenotype to left-handed threshold and multiple stripes patterns, whereas allows access to the right-handed threshold phenotype and then to the dip phenotype. These particular interactions, which can be tuned to access more than one novel phenotype, behave as sensitive interactions.
Mechanisms Differ in the Proportion of Phenotypic Hubs.
Phenotype-transition diagrams reveal the richness of phenotypes around specific regions of genotype space. Indeed, certain genotypes can access a high diversity of innovations when different gene interactions are mutated (SI Appendix, Fig. S7). Whereas Fig. 4 showed the likelihood to transition into novel phenotypes, an alternative measure of evolvability is the number of accessible distinct phenotypes per genotype: phenotypic diversity. We observe that its spectrum is quite wide (0–6), as certain genotypes can access no novel phenotype, whereas others connect the stripe phenotype to more than one novel phenotype (SI Appendix, Fig. S8). We refer to the genotypes that can reach a high diversity of distinct innovations as phenotypic hubs (phenotypic diversity ≥ 3). In this alternative measure, mechanisms show distinct proportions of phenotypic hubs, with certain mechanisms showing a sevenfold higher proportion of hubs than others (Frozen Oscillator compared with Classical).
Discussion
To summarize, we measured the evolvability of gene circuits that use alternative dynamical mechanisms to convert a morphogen gradient into a single stripe of gene expression. For each mechanism, we explored the landscape of accessible novel phenotypes and found that the evolutionary potential clearly varies between alternative mechanisms.
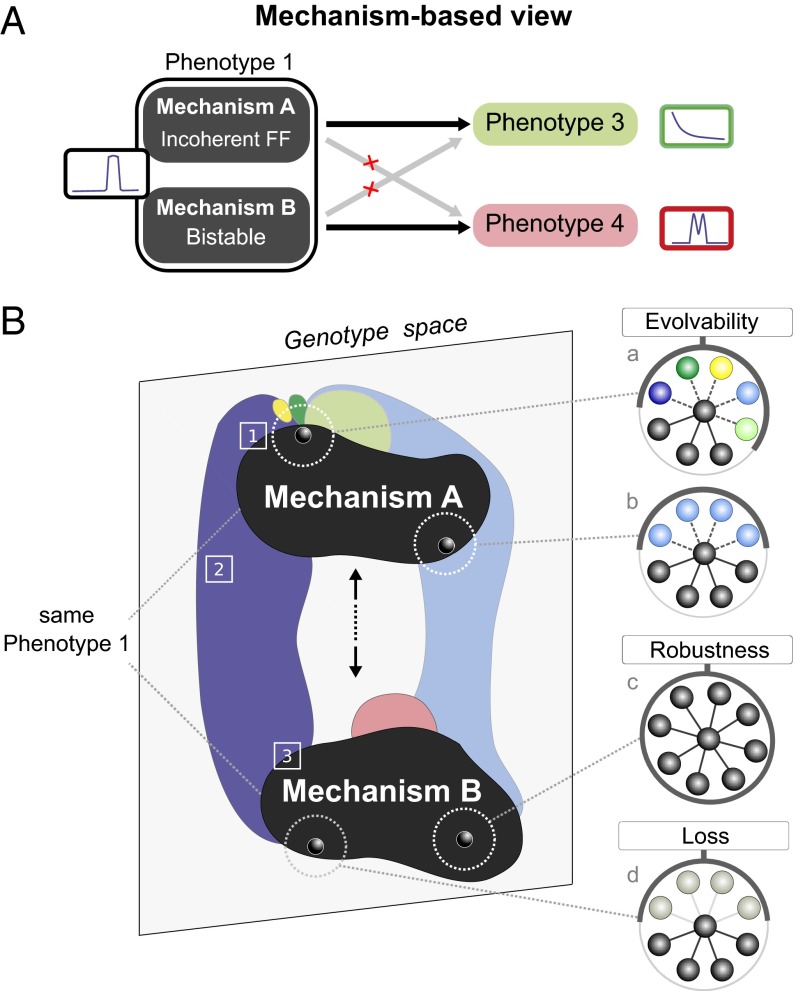
Many previous studies emphasized that the majority of successful genotypes are grouped together into a unique and connected neutral region of genotype space. Our mechanism-based view makes an important distinction. By using a biologically realistic model, with continuous variables, parameters, and regulatory functions, our neutral region within genotype space is broken up into separate islands, which represent distinct dynamical mechanisms (SI Appendix, Fig. S1). As a consequence, genotypes can neutrally drift only within the region of their dynamical mechanism and therefore access only the phenotypes adjacent to this region (Fig. 6). In other words, neutral drift, which is considered to have a key role in evolution, is strongly restricted by genotype’s dynamics.
Fig. 6.
Mechanism-based view on evolvability. (A) Distinct mechanisms to achieve a common phenotype have access to distinct phenotypes: the Gradient phenotype appears exclusively accessible from mechanism A (Bistable or Overlapping Domains) as is Double Peak from mechanism B (Incoherent feed-forward or Mutual Inhibition). (B) Main features of genotype space: existence of phenotypic hubs [1], ubiquitously accessible phenotypes [2], and continuous phenotypic transitions [3]. Four phenotypic neighborhoods are shown as representative cases of either potentially evolvable genotypes (found close to the edge of the neutral space: a, b, and d) or completely robust genotypes (internal: c).
A distinctive feature of the current study stands out in the general context of genotype-phenotype studies. Because our emphasis is on evolution of novel phenotypes, we chose to make our phenotypic categories represent qualitatively distinct patterns. A small quantitative shift in an expression pattern (e.g., 2% wider stripe) could theoretically have functional (selectable) consequences, but we do not consider it a novel phenotype for this study. This choice differs from the approaches taken in previous studies. For example, in studies of the relationship between RNA sequence and secondary structure, the phenotype space for an RNA molecule of N bases is considered to have approximately distinct phenotypes (31), even though many of these are only tiny alterations in secondary structure. This approach has led to the finding of perpetual innovation: the concept that the number of accessible novel structures is roughly constant irrespective of the molecule’s position in its neutral space (31). Here, in contrast to the vastness of RNA phenotype space, our definition of phenotypes reduces the diversity of the phenotype space itself and therefore impacts on the measure of evolvability. We consider this definition to be more appropriate for the question of phenotypic novelty.
From the broad perspective of developmental biology, the concept of evolvability (1) focuses on the generation of novel phenotypes (i.e., a potential), whereas the concept of developmental constraints (32) refers to restrictions on the production of certain phenotypes (i.e., a limitation) (33). Independent of the context, both evolvability and developmental constraints describe the available novelties. Our results show that the dynamics of gene circuits itself constitutes a developmental constraint, as initially envisioned by Maynard Smith who defined the constraints as the “biases on the production of variant phenotypes…caused by the structure, character, composition, or dynamics of the developmental system” (32).
Materials and Methods
The Gene Regulatory Model.
The model (6) captures the spatiotemporal dynamics of gene patterning and is described by
| [1] |
where is the concentration of the ith gene in the jth cell; is the regulatory Michaelis-Menten function that describes the relationship between the total input into a gene and its output concentration; is a matrix containing the strengths of gene–gene interactions; M is the morphogen input; is the Heaviside function to prevent negative gene product production rates; is the diffusion constant for the ith gene; λ is the decay rate; and is a noise term, which adds uniformly distributed fluctuations (±1%) to the concentration of every gene in every cell at every time step (SI Appendix, Methods). Noise is included in the model to avoid unstable solutions.
The Mutation Process.
Mutating a parameter set consists of perturbing all its gene interactions. A mutation affects only one gene interaction, whereas the rest of the interactions remain unchanged. A genotype with n gene interactions is subject to independent mutations: each interaction has its original value decreased and increased by a magnitude referred to as the mutational strength, ranging from 1% to 99%. This metric is in accordance to the type of continuous model used.
Defining Functional Phenotypes.
Functional phenotypes fulfill the following two criteria—stability criterion: a gene profile must be robust with respect to developmental noise and have reached equilibrium to be considered functional; pattern criterion: a gene profile conforms a pattern when the level of heterogeneity within its cells is above a certain threshold. Functional phenotypes are subsequently classified either as a stripe or as one of the seven novel patterns following simple patterning criteria. Details are provided in SI Appendix, Methods.
Supplementary Material
Acknowledgments
We thank James Cotterell, Johannes Jaeger, Anton Crombach, Fyodor Kondrashov, Onuralp Soylemez, Karl Wotton, Jose M. Sancho, Kai Dierkes, and Ben Lenher for discussion. This work was supported by the “la Caixa” International PhD Programme.
Footnotes
The authors declare no conflict of interest.
*This Direct Submission article had a prearranged editor.
This article contains supporting information online at www.pnas.org/lookup/suppl/doi:10.1073/pnas.1411065112/-/DCSupplemental.
References
- 1.Pigliucci M. Is evolvability evolvable? Nat Rev Genet. 2008;9(1):75–82. doi: 10.1038/nrg2278. [DOI] [PubMed] [Google Scholar]
- 2.Kirschner M, Gerhart J. Evolvability. Proc Natl Acad Sci USA. 1998;95(15):8420–8427. doi: 10.1073/pnas.95.15.8420. [DOI] [PMC free article] [PubMed] [Google Scholar]
- 3.Schuster P, Fontana W, Stadler PF, Hofacker IL. From sequences to shapes and back: A case study in RNA secondary structures. Proc Biol Sci. 1994;255(1344):279–284. doi: 10.1098/rspb.1994.0040. [DOI] [PubMed] [Google Scholar]
- 4.Li H, Helling R, Tang C, Wingreen N. Emergence of preferred structures in a simple model of protein folding. Science. 1996;273(5275):666–669. doi: 10.1126/science.273.5275.666. [DOI] [PubMed] [Google Scholar]
- 5.Ma W, Lai L, Ouyang Q, Tang C. Robustness and modular design of the Drosophila segment polarity network. Mol Syst Biol. 2006;2:70. doi: 10.1038/msb4100111. [DOI] [PMC free article] [PubMed] [Google Scholar]
- 6.Cotterell J, Sharpe J. An atlas of gene regulatory networks reveals multiple three-gene mechanisms for interpreting morphogen gradients. Mol Syst Biol. 2010;6:425. doi: 10.1038/msb.2010.74. [DOI] [PMC free article] [PubMed] [Google Scholar]
- 7.Ma W, Trusina A, El-Samad H, Lim WA, Tang C. Defining network topologies that can achieve biochemical adaptation. Cell. 2009;138(4):760–773. doi: 10.1016/j.cell.2009.06.013. [DOI] [PMC free article] [PubMed] [Google Scholar]
- 8.Shah NA, Sarkar CA. Robust network topologies for generating switch-like cellular responses. PLOS Comput Biol. 2011;7(6):e1002085. doi: 10.1371/journal.pcbi.1002085. [DOI] [PMC free article] [PubMed] [Google Scholar]
- 9.Salazar-Ciudad I, Newman SA, Solé RV. Phenotypic and dynamical transitions in model genetic networks. I. Emergence of patterns and genotype-phenotype relationships. Evol Dev. 2001;3(2):84–94. doi: 10.1046/j.1525-142x.2001.003002084.x. [DOI] [PubMed] [Google Scholar]
- 10.Fujimoto K, Ishihara S, Kaneko K. Network evolution of body plans. PLoS ONE. 2008;3(7):e2772. doi: 10.1371/journal.pone.0002772. [DOI] [PMC free article] [PubMed] [Google Scholar]
- 11.Ciliberti S, Martin OC, Wagner A. Innovation and robustness in complex regulatory gene networks. Proc Natl Acad Sci USA. 2007;104(34):13591–13596. doi: 10.1073/pnas.0705396104. [DOI] [PMC free article] [PubMed] [Google Scholar]
- 12.Draghi JA, Parsons TL, Wagner GP, Plotkin JB. Mutational robustness can facilitate adaptation. Nature. 2010;463(7279):353–355. doi: 10.1038/nature08694. [DOI] [PMC free article] [PubMed] [Google Scholar]
- 13.Payne JL, Wagner A. The robustness and evolvability of transcription factor binding sites. Science. 2014;343(6173):875–877. doi: 10.1126/science.1249046. [DOI] [PubMed] [Google Scholar]
- 14.Hayden EJ, Ferrada E, Wagner A. Cryptic genetic variation promotes rapid evolutionary adaptation in an RNA enzyme. Nature. 2011;474(7349):92–95. doi: 10.1038/nature10083. [DOI] [PubMed] [Google Scholar]
- 15.Tóth-Petróczy A, Tawfik DS. Protein insertions and deletions enabled by neutral roaming in sequence space. Mol Biol Evol. 2013;30(4):761–771. doi: 10.1093/molbev/mst003. [DOI] [PubMed] [Google Scholar]
- 16.Dichtel-Danjoy ML, Félix MA. Phenotypic neighborhood and micro-evolvability. Trends Genet. 2004;20(5):268–276. doi: 10.1016/j.tig.2004.03.010. [DOI] [PubMed] [Google Scholar]
- 17.Alexander RP, Kim PM, Emonet T, Gerstein MB. Understanding modularity in molecular networks requires dynamics. Sci Signal. 2009;2(81):pe44. doi: 10.1126/scisignal.281pe44. [DOI] [PMC free article] [PubMed] [Google Scholar]
- 18.Chau AH, Walter JM, Gerardin J, Tang C, Lim WA. Designing synthetic regulatory networks capable of self-organizing cell polarization. Cell. 2012;151(2):320–332. doi: 10.1016/j.cell.2012.08.040. [DOI] [PMC free article] [PubMed] [Google Scholar]
- 19.Lim WA, Lee CM, Tang C. Design principles of regulatory networks: Searching for the molecular algorithms of the cell. Mol Cell. 2013;49(2):202–212. doi: 10.1016/j.molcel.2012.12.020. [DOI] [PMC free article] [PubMed] [Google Scholar]
- 20.Munteanu A, Cotterell J, Solé RV, Sharpe J. Design principles of stripe-forming motifs: The role of positive feedback. Sci Rep. 2014;4:5003. doi: 10.1038/srep05003. [DOI] [PMC free article] [PubMed] [Google Scholar]
- 21.Jaeger J, Sharpe J. In: On the Concept of Mechanism in Development. Towards a Theory of Development. Minelli A, Pradeu T, editors. Oxford Univ Press; Oxford, UK: 2014. pp. 56–78. [Google Scholar]
- 22.Werner T, Koshikawa S, Williams TM, Carroll SB. Generation of a novel wing colour pattern by the Wingless morphogen. Nature. 2010;464(7292):1143–1148. doi: 10.1038/nature08896. [DOI] [PubMed] [Google Scholar]
- 23.Guerreiro I, et al. Role of a polymorphism in a Hox/Pax-responsive enhancer in the evolution of the vertebrate spine. Proc Natl Acad Sci USA. 2013;110(26):10682–10686. doi: 10.1073/pnas.1300592110. [DOI] [PMC free article] [PubMed] [Google Scholar]
- 24.Wolpert L. One hundred years of positional information. Trends Genet. 1996;12(9):359–364. doi: 10.1016/s0168-9525(96)80019-9. [DOI] [PubMed] [Google Scholar]
- 25.Hornung G, Barkai N. Noise propagation and signaling sensitivity in biological networks: A role for positive feedback. PLOS Comput Biol. 2008;4(1):e8. doi: 10.1371/journal.pcbi.0040008. [DOI] [PMC free article] [PubMed] [Google Scholar]
- 26.Jaeger J. The gap gene network. Cell Mol Life Sci. 2011;68(2):243–274. doi: 10.1007/s00018-010-0536-y. [DOI] [PMC free article] [PubMed] [Google Scholar]
- 27.Green J. Morphogen gradients, positional information, and Xenopus: Interplay of theory and experiment. Dev Dyn. 2002;225(4):392–408. doi: 10.1002/dvdy.10170. [DOI] [PubMed] [Google Scholar]
- 28.Rogers KW, Schier AF. Morphogen gradients: From generation to interpretation. Annu Rev Cell Dev Biol. 2011;27:377–407. doi: 10.1146/annurev-cellbio-092910-154148. [DOI] [PubMed] [Google Scholar]
- 29.Prud’homme B, Gompel N, Carroll SB. Emerging principles of regulatory evolution. Proc Natl Acad Sci USA. 2007;104(Suppl 1):8605–8612. doi: 10.1073/pnas.0700488104. [DOI] [PMC free article] [PubMed] [Google Scholar]
- 30.Carroll SB. Evo-devo and an expanding evolutionary synthesis: A genetic theory of morphological evolution. Cell. 2008;134(1):25–36. doi: 10.1016/j.cell.2008.06.030. [DOI] [PubMed] [Google Scholar]
- 31.Huynen MA. Exploring phenotype space through neutral evolution. J Mol Evol. 1996;43(3):165–169. doi: 10.1007/BF02338823. [DOI] [PubMed] [Google Scholar]
- 32.Maynard Smith J, et al. Developmental constraints and evolution: A perspective from the mountain lake conference on development and evolution. Q Rev Biol. 1985;60(3):265–287. [Google Scholar]
- 33.Brigandt I. From developmental constraint to evolvability: How concepts figure in explanation and disciplinary identity. In: Love AC, editor. Conceptual Change in Biology. Vol 307. Springer; Dordrecht, The Netherlands: 2015. pp. 305–325. [Google Scholar]
Associated Data
This section collects any data citations, data availability statements, or supplementary materials included in this article.


