

Abstract
iNKT cells are CD1d-restricted lipid-sensing innate T cells that express the transcription factor PLZF. iNKT cells accumulate in adipose tissue, where they are anti-inflammatory, but the factors that contribute to their anti-inflammatory nature, and their targets in adipose tissue are unknown. Here we report that adipose tissue iNKT cells have a unique transcriptional program and produce interleukin 2 (IL-2) and IL-10. Unlike other iNKT cells, they lack PLZF, but express the transcription factor E4BP4, which controls their IL-10 production. Adipose iNKT cells are a tissue resident population that induces an anti-inflammatory phenotype in macrophages and, through production of IL-2, controls the number, proliferation and suppressor function of adipose regulatory T (Treg) cells. Thus, adipose tissue iNKT cells are unique regulators of immune homeostasis in this tissue.
iNKT cells have a semi-invariant αβTCR and recognize CD1d-presented lipid antigens1. Unlike adaptive MHC-restricted T cells, they display an effector and memory phenotype at steady-state, which renders them poised for immediate effector function. Because of their rapid response and basal expression of NK receptors they are considered “innate” T cells. iNKT cells characteristically express high levels of the BTB-POZ transcription factor PLZF, encoded by Zbtb16, this transcription factor was proposed to define the iNKT cell lineage2,3. PLZF is also expressed by human MAIT cells4, another population of semi-invariant T cells, as well as an innate subset of γδ T cells5. Thus, PLZF expression is associated with T cells with limited TCR diversity and is thought to be responsible for the innate phenotype and rapid cytokine response of these cells5.
MHC-restricted CD4+ T cells differentiate into TH1, TH2, TH17, and regulatory T (Treg) cell subsets. Likewise, subpopulations of iNKT cells analogous to Th1, Th2, and Th17 have been found, and they express some of the same transcription factors as the corresponding MHC-restricted T cells subsets. Surface markers such as CD4, NK1.1 and IL-17RB (a component of the IL-25 receptor) and cytokine receptors such as IL-12R and IL-23R can distinguish TH1-like, TH2-like and TH17-like iNKT cell functional subsets 6,7. However, iNKT cells can produce both TH1 and TH2 cytokines simultaneously, and functionally, while many iNKT cells are inflammatory and have important roles in host defense, they are also implicated in preventing or controlling autoimmune disease 8. iNKT cell production of IL-4, IL-10 and IL-13 has been linked to their capacity to suppress cell-mediated immune responses 9. iNKT cell numbers are reduced in humans with autoimmune diseases and mouse models of autoimmunity such as type I diabetes 10, multiple sclerosis 11,12 and systemic lupus erythematosus (SLE)13 and exacerbation or prevention of these conditions is seen in the absence or following activation of iNKT cells, respectively 14. However, a Treg-like regulatory subset of iNKT cells has not been found.
In both mice and humans, iNKT cells are significantly enriched in visceral adipose tissue, where they represent 15–20% of total T cells15,16. Adipose tissue harbors a distinct collection of immune cells not seen elsewhere. Alternatively activated macrophages (M2) have an important role in the homeostasis of the adipose tissue at lean state17. Treg cells with a restricted TCR usage18 and a distinct gene expression profile that includes PPARγ and high IL-10 expression 19 accumulate in adipose tissue with age18. However, the development of obesity brings major changes to the adipose immune repertoire. iNKT cell numbers decrease early in human and murine obesity 15,16,20–22. Likewise, there is a drop in adipose Treg cell numbers18, while macrophages accumulate23 and undergo a phenotypic switch to the M1 pro-inflammatory macrophage type24. These changes result in a state of chronic inflammation that contributes to metabolic disease through inflammation-induced insulin resistance.
It was recently reported that adipose tissue iNKT cells play a protective role against obesity-induced inflammation, glucose intolerance and weight gain through regulatory cytokine production 16,20,22,25–27. Yet, the basis for the protective function and the anti-inflammatory nature of adipose tissue iNKT cells compared to the Th1, Th2 and Th17 inflammatory iNKT cells in other locations is not understood. Here, we show that unlike the vast majority of iNKT cells in other locations, adipose tissue iNKT display a unique transcriptome and are most notably characterized by the lack of PLZF expression. iNKT cell-deficient mice have reduced numbers of adipose tissue Treg cells, and we demonstrate that iNKT cells transactivate adipose Treg cells and regulate their function. Adipose iNKT cells also produce IL-10 in an E4BP4-dependent manner and can induce an M2 phenotype in macrophage. Thus, we define a new subpopulation of regulatory iNKT cells that have the ability to regulate the function on macrophages and Treg cells in adipose tissue.
Results
iNKT cells in adipose tissue are tissue resident
iNKT cells are enriched in human and murine adipose tissue, where their expression of CD4 and NK1.1 is less than on iNKT cells elsewhere in the periphery15,16. To learn more about the nature of visceral adipose tissue iNKT cells, we investigated whether they are constantly replenished from the periphery, or if they represent a tissue-resident population. To address this we generated parabiotic pairs of CD45.1 and CD45.2 congenic mice. During the healing process after surgery, capillary anastomoses form between the two vascular systems, allowing for exchange of circulating peripheral blood cells. In this experimental system, MHC-restricted CD4+ and CD8+ T cells and B cells rapidly recirculated to reach equilibrium (equal chimerism) in the blood and spleen of parabiotic mice after 2 weeks (Fig. 1a), while bone marrow and thymic cell progenitors do not exchange at this time28. However, the parabiotic reconstitution was lower in the liver and adipose tissue, suggesting resident lymphocyte populations with low turnover reside in these locations (Fig.1a). To identify the circulating or resident behavior of each lymphocyte population, we examined the chimerism of various lymphocyte subsets. B cells, CD8+ T cells and CD4+T cells recirculated though blood, spleen, liver and adipose tissue, reaching almost equal (50%) chimerism between CD45.1 and CD45.2, indicating almost full exchange (Fig. 1b). Adipose Treg cells recirculated to a lesser degree, with only 25% of cells originating from the parabiotic partner of each mouse, although almost complete Treg cell chimerism was seen in the blood, spleen and liver (Fig. 1b). This suggests that Treg cells constantly recirculate through some organs, but also make up resident populations in selected tissues. In contrast to all the other lymphocyte populations, iNKT cells showed virtually no circulation in any of the organs examined (Fig. 1b). In the adipose tissue, >95% of iNKT cells were derived from the host (Fig. 1b, c), indicating that iNKT cells are a tissue-resident lymphocyte population in adipose tissue.
Figure 1. iNKT cells are tissue resident in adipose tissue and do not rely on ICAM or LFA1 for retention.
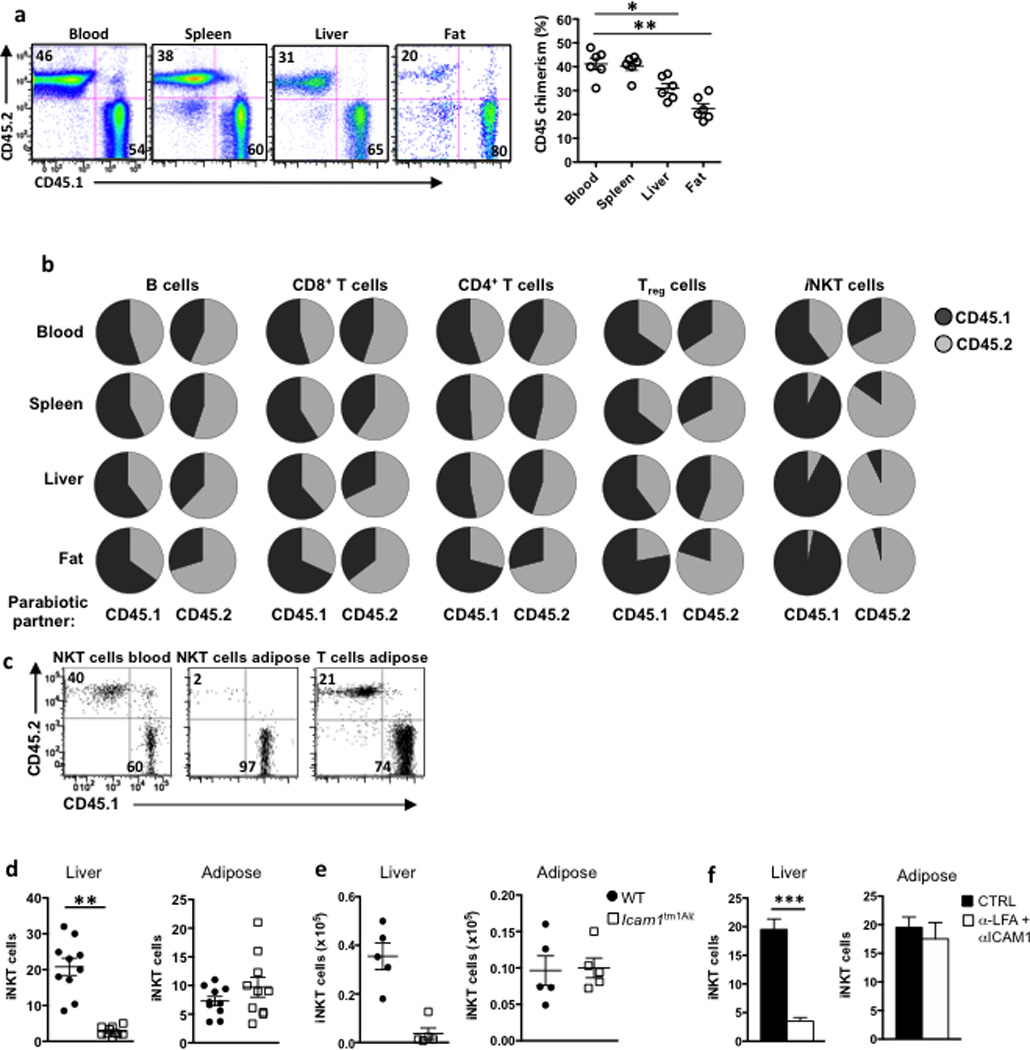
(a) Relative frequencies of CD45.1 (host) and CD45.2 (parabiotic partner) lymphocytes in the blood, spleen, liver and adipose tissue of the CD45.1 member of a CD45.1 and CD45.2 congenic C57BL/6 parabiotic pair joined at 6 wk of age and examined 2 weeks later. Shown are representative facs plots from 2 experiments in 5 pairs of mice each (n=20 mice). Graph shows chimerism of total lymphocytes in each organ in the parabiotic pairs (n=10 pairs). (b) Pie charts indicate the average of the relative frequencies of CD45.1 (black) and CD45.2 (grey) lymphocyte subsets in each partner after 15 d parabiosis (n=10 pairs). Results were generated after B cells, CD8+ and CD4+ T cells, Tregs, and iNKT cells were gated, in blood, spleen, liver and fat. (c) Representative dot plots of iNKT cell chimerism (as measured by CD45.1 and CD45.2) in blood and adipose compared to other non-iNKT T cells in adipose in a CD45.1 partner of parabiotic pair. (d) iNKT cell levels, as a % of lymphocytes, in liver and adipose in WT and ICAM1−/− mice (n=10 per group). (e) iNKT cell numbers in liver and adipose in WT and ICAM1−/− mice (n=5 per group). (f) WT mice were injected with anti-LFA and anti-ICAM1 and iNKT cell levels were measured in liver and fat the following day. Graphs represent one (n=4) of two independent experiments. Statistical comparisons using student t-test. *p<0.05, **p=<0.01.
Because ICAM1-LFA1 interactions are critical for iNKT cell retention in the liver29–31 we investigated if LFA1 and ICAM1 molecules were responsible for iNKT accumulation and retention in adipose tissue. Icam1tm1Alb mice had less iNKT cells than wild-type mice in the liver, confirming the importance of ICAM1 in retention of hepatic iNKT cells. However, iNKT cells were present at normal to slightly elevated frequency and similar absolute numbers in adipose tissue of ICAM1-deficient mice compared to wild-type (Fig. 1d,e). Furthermore, in vivo blocking of ICAM1 and LFA1 with neutralizing antibodies resulted in iNKT cell egress from the liver, but not from the adipose tissue (Fig. 1f). Thus, adipose iNKT cells are a tissue-resident population that do not rely on iCAM1-LFA1 interactions for their retention in adipose tissue.
Adipose iNKT cells have a unique gene expression program
Adipose tissue iNKT cells show phenotypical and functional differences to other iNKT cells, including low CD4 and NK1.1 expression, low IFN-γ, production, and production of IL-1016,20, which together with the observation that they are tissue resident, suggest they may represent a unique population. High-resolution expression analysis comparing iNKT cells to other leukocyte populations, as well as iNKT cells in different tissues as part of the Immunological Genome Project Consortium (Immgen) revealed that only a small numbers of genes were different between iNKT cells from liver, spleen and thymus (eg. liver and splenic iNKT differed by ~100 genes)32. Microarray gene expression analysis of visceral adipose iNKT cells revealed that adipose iNKT cells overexpressed 639 genes compared to matched splenic iNKT cells (Fig. 2a), suggesting they may represent a distinct iNKT population. The overexpressed genes included the MAP kinase phosphatase Dusp1, nuclear receptor transcription factor Nur77 (Nr4a1), and the basic leucine zipper transcription factor, E4BP4 (Nfil3). In addition, 2,710 genes were under-represented in adipose iNKT cells compared to splenic iNKT cells. PLZF(Zbtb16), a transcription factor reported to be expressed by all iNKT cells examined up to now 2,3, was not substantially expressed by adipose iNKT cells, as was IL-7R (Fig. 2a). In contrast, PLZF was highly expressed on splenic iNKT cells (Fig. 2a), similar to previous reports for hepatic, splenic and thymic iNKT cells3,5,32. PLZF transcripts were just above the expression cutoff point in adipose iNKT cells (Fig. 2b). To analyze the expression of the PLZF protein in the adipose tissue iNKT cells, we used PLZF-GFP reporter mice (PEG) generated using modified bacterial artificial chromosome transgene expressing eGFP under the control of PLZF regulatory elements. Flow cytometric analysis revealed that adipose tissue iNKT cells had very low GFP expression, while iNKT cells in liver and thymus were GFP+ (Fig. 2c). We next asked if adipose tissue iNKT cells express PLZF in younger mice. The youngest age at which we could detect epididymal adipose tissue in mice was ~ 12 days old (not shown), when it is thought that iNKT cells start to populate the periphery33. iNKT cells were first detectable in the mouse adipose tissue at 2 weeks of age, and increased with age to represent 5% of T cells at 2 weeks and ~20% of T cells at 16 weeks (Fig. 2d). However, adipose iNKT cells had low or negligible GFP expression in 2 week old PLZF-GFP mice, while total thymic and liver iNKT cells were GFP+ in mice of all ages examined (Fig. 2e). Mean fluorescence intensity (MFI) of GFP showed that adipose iNKT cells had very low PLZF expression compared to iNKT cells in thymus, liver and spleen at all ages examined, however, conventional T cells (TCRβ+ CD1d-aGalCer tetramer−) in adipose tissue had even lower PLZF expression (Fig. 2f). Thus, iNKT cells in the adipose tissue express very little PLZF at all ages.
Figure 2. Adipose iNKT cells lack PLZF and are present in PLZF−/− mice.
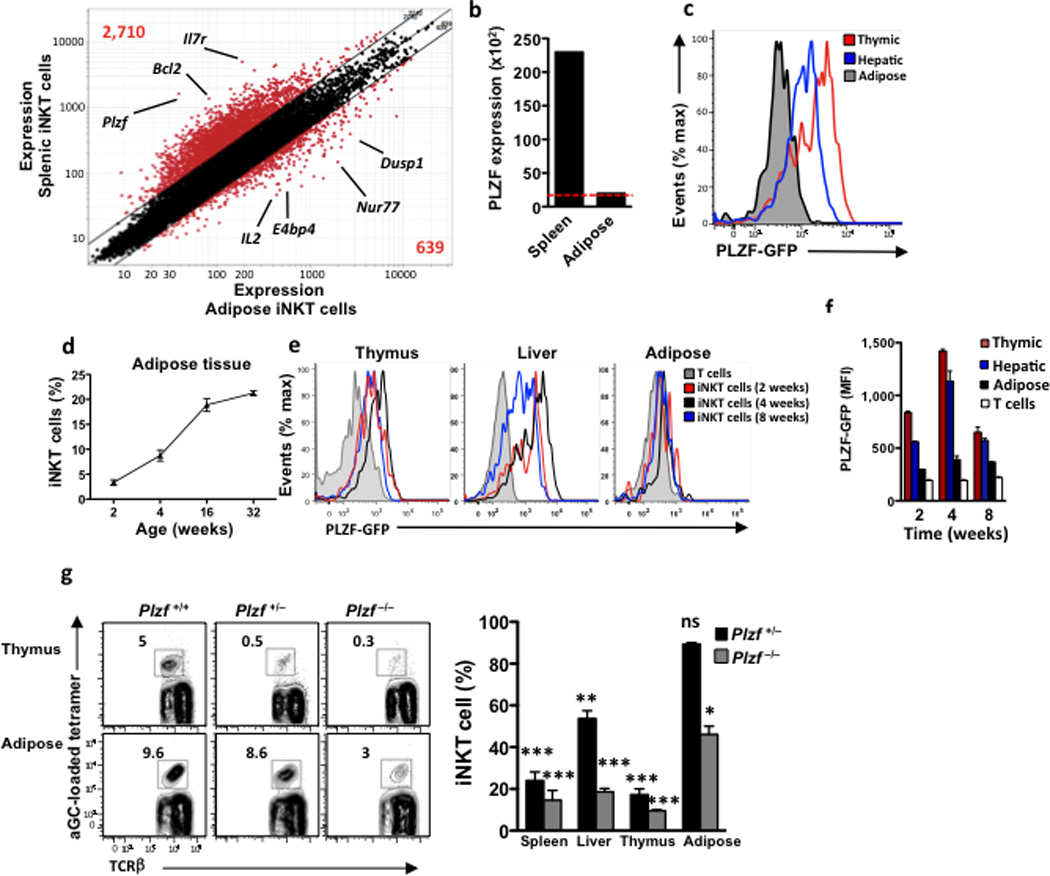
(a) Microarray analysis. Normalized expression values for transcripts isolated from iNKT cells from epididymal fat versus spleen of 6-week-old B6 males. (b) PLZF expression levels of iNKT cells from matched spleen and adipose tissue. Red dotted line represents the expression cut-off level. (c) PLZF-GFP mice were used to measure PLZF expression by flow cytometry. iNKT cells were gated in each organ and GFP+ cells were measured. Histogram illustrates matched organs from one mouse, data is representative of 9 mice. (d) Levels of iNKT cells in adipose tissue with age, as a % of total adipose T cells. n=4 mice per age group. (e) GFP+ cells gated on iNKT cells in thymus, liver and adipose, from PLZF-GFP mice age 2, 4 and 8 weeks old. Histograms represent 4 mice per age group. (f) PLZF MFI expression on thymic, hepatic and adipose iNKT cells compared to adipose (non-iNKT) T cells (white) Each timepoint = n=4 mice. (g) Representative contour plots of iNKT cell levels in thymus and adipose in PLZF+/+, PLZF+/− and PLZF−/− littermates. Right: Graph of reduced iNKT cell levels in PLZF+/− (n=7) and PLZF−/− (n=4) compared to WT mice (n=5). * represents statistical significance compared to WT littermate mice. Statistical comparisons using ANOVA and Tukey post-hoc test. *p<0.05, **p=<0.01, ***p<0.001.
We next investigated the possibility that adipose tissue iNKT cells lose PLZF expression following migration out of the thymus. Athymic nude mice, which lack all T cells, including iNKT cells, had no iNKT cells in the adipose tissue (Supplementary Fig. 1), confirming the thymic origin of this iNKT cell subset. Next, to determine if adipose tissue iNKT cells had expressed high amounts of PLZF at previous developmental stages, we crossed PLZF-Cre mice, which express a BAC transgene in which a Cre recombinase is knocked into the PLZF gene, with mice expressing the fluorescent marker tdTomato encoding a floxed stop codon at the ROSA26 locus. In PLZF-Cre x Rosa26fl/fl mice, cells that express PLZF (and therefore Cre) are permanently tdTomato+. Spleen and adipose tissue iNKT cells in the PLZF-Cre x Rosa26fl/fl mice were highly positive for tdTomato (Supplementary Fig.2), indicating that adipose tissue iNKT had expressed PLZF during development .and downregulated it in the thymus or at a later stage. However, PLZF mRNA is also transiently expressed in HSCs and as a result, 50% of all splenocytes, of which only 1–3% are iNKT cells in the PLZF-Cre x Rosa26fl/fl mice are tdTomato positive. Thus, these experiments do not indicate at what stage in the development of adipose tissue iNKT cells was PLZF functionally important, if at all.
To determine if PLZF is required for adipose tissue iNKT development, we used PLZF-deficient mice. Despite the transient expression of PLZF in HSCs, Zbtb16tm1Ppp (referred to from here as PLZF−/−) have a selective and severe deficiency in iNKT cell development, with very few iNKT cells still present, while other lymphocytes are unaffected 2,3. Both PLZF−/− and PLZF+/− mice had a substantially reduced numbers of thymic and peripheral iNKT cells (Fig. 2g). We observed a 50–85 % reduction in the number of iNKT cells in the spleen, liver and thymus of PLZF+/− mice compared to wild-type littermates, while there was no significant decrease in the number of iNKT cells in adipose tissue of PLZF+/− mice compared to wild-type (95% of wild-type; Fig. 2g). PLZF−/− mice had a 80–90% reduction in the number of iNKT cells in spleen, liver and thymus compared to wild-type mice, while iNKT cells numbers in the adipose tissue were reduced by 50% compared to wild-type mice (Fig. 2g). These data suggests that at steady state, the iNKT cells in the adipose tissue are less sensitive to genetic deletion of PLZF compared to other peripheral sites, although homeostatic proliferation/survival may compensate for PLZF deficiency specifically in adipose tissue.
We next asked if adipose tissue iNKT cells expressed the canonical Vα14-Jα18 TCR paired with Vβ7, Vβ8.1 or Vβ8.2. Single cell PCR showed that iNKT cells in adipose tissue expressed the invariant Vα14-Jα18 TCR, paired with a limited Vβ gene repertoire (Supplementary Fig. 3). Thus, our findings indicate that a population of PLZFlow iNKT that are less sensitive to genetic deletion of PLZF accumulate in adipose tissue.
Adipose iNKT cells are phenotypically similar to iNKT cells in PLZF−/− mice
The first detectable iNKT cell precursors believed to immediately follow positive selection in the thymus (stage 0) are CD24hi CD1d-tetramer+ cells that uniformly express CD69 34. iNKT cells then progress to CD24low cells and subsequently develop into CD44lowNK1.1− (stage 1), CD44hiNK1.1− (stage 2) and CD44hiNK1.1+ (stage 3) cells 34. Stage 0 precursors are PLZF positive, although they have a low frequency in the thymus 2. As previously reported 2,3, we found that the low number of iNKT cells present in the PLZF−/− and PLZF+/− thymi and periphery were arrested at stage 1, based on their CD44lo NK1.1lo phenotype (Fig. 3a). Similar to thymic and peripheral iNKT cells from the PLZF−/− and PLZF+/− mice, adipose tissue iNKT cells in the wild-type mice were mainly CD44low (~80% , compared to 8–20% in thymus and liver), and ~40% of them were NK1.1−, in contrast to only ~15% NK1.1− iNKT cells in the liver (Fig. 3a,b). Thus, wild-type adipose tissue iNKT cells share a number of key phenotypic markers with liver and spleen PLZF-deficient iNKT cells.
Figure 3. Adipose iNKT cells have similar characteristics to PLZF negative iNKT cells.
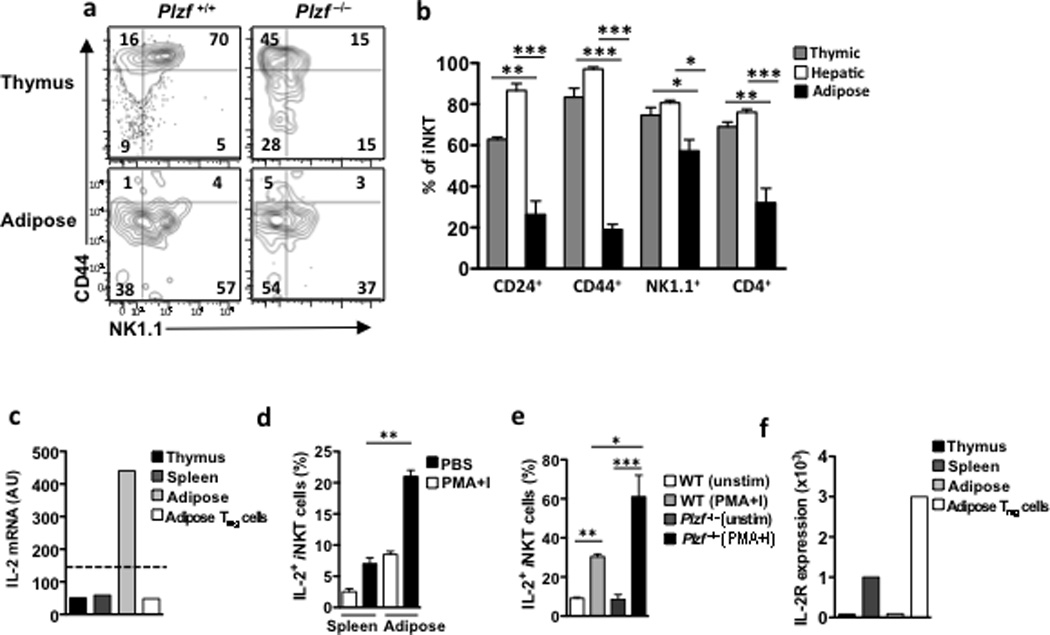
(a) Contour plots of NK1.1 and CD44 in matched thymic and adipose iNKT cells. (b) Graph represents the % of thymic, hepatic and adipose iNKT cells expressing CD24, CD44, NK1.1 and CD4 on, n=3 mice per organ. (c) IL-2 mRNA levels in iNKT cells from thymus, spleen and adipose tissue, as well as Tregs from adipose tissue. (d) Graph of IL-2 production by splenic and adipose iNKT cells measured by flow cytometry of intracellular staining of IL-2 after 4 hour stimulation with PBS or PMA and Ionomycin (PMA+I) (n=4). (e) Histogram of IL-2 intracellular staining gated on adipose iNKT cells in PLZF+/+ and PLZF−/− mice after 4 hours of PMA+I stimulation with Brefeldin A, representative of n=4 per group (f) IL-2R mRNA levels in iNKT cells from thymus, spleen and adipose tissue, as well as Tregs from adipose tissue. Dotted line represents the expression cut-off value. Statistical comparisons using ANOVA and Tukey post-hoc test. *p<0.05, **p=<0.01, ***p<0.001.
PLZF expression is required for the innate-like effector program of iNKT cells, including rapid production of IFN-γ after stimulation. IFN-γ production by iNKT cells is diminished or absent in PLZF−/− mice, while their production of IL-2 is enhanced2. Microarray expression analysis in adipose iNKT cells showed high expression of IL-2 mRNA, compared with iNKT cells in thymus, liver and spleen (Fig. 3c). Furthermore, adipose tissue iNKT cells produced more IL-2 after stimulation with PMA and Ionomycin compared to splenic iNKT cells (Fig. 3d). However, IL-2 production by wild-type adipose tissue iNKT cells was lower than PLZF−/− adipose tissue iNKT cells after PMA+ Ionomycin stimulation (Fig. 3e), suggesting complete loss of PLZF in adipose tissue iNKT cells has an effect on the phenotype of these cells. However, wild-type adipose tissue iNKT cells do not express IL-2R mRNA, as assessed by RT-PCR (Fig. 3f), or the CD25 protein (data not shown), unlike splenic iNKT cells and adipose Treg cells, which have high IL-2R expression (Fig. 3f). Thus, adipose tissue iNKT cells, like iNKT cells from PLZF−/− mice, express low levels of NK1.1 and CD44, and have a strong functional capacity to produce IL-2.
Adipose iNKT cells express T-bet and Gata-3, similar to other iNKT cells
Based on their expression of transcription factors T-bet, Gata-3 and Rorγt and various cytokines, iNKT cells are currently grouped into four functional subsets: NKT1, NKT2, NKT1735–37 and NKT-FH38 cells. Intranuclear staining showed that, similar to iNKT cells in thymus, spleen and liver, adipose tissue iNKT expressed Gata-3 and T-bet, but undetectable Rorγt (Supplementary Fig. 4a), unlike splenic subsets of NKT17 cells (not shown). Adipose tissue iNKT cells produce little IFN-γ after αGalCer stimulation in vivo or in vitro16. However, similar to splenic or hepatic iNKT cells, we observed basal IFN-γ mRNA expression in adipose tissue iNKT cells (data not shown), suggesting that adipose tissue iNKT cells can produce IFN-γ. To determine the cytokine production potential of adipose tissue iNKT cells, we stimulated total spleen, liver and adipose tissue leukocytes with either αGalCer or PMA+Ionomycin, and simultaneously added brefeldin A, which blocks protein transport from the endoplasmic reticulum, for 5 hours, followed by CD1d-tetramer gating and intracellular cytokine staining. Adipose tissue iNKT cells did not produce detectable IFN-γ protein, but, unlike splenic and hepatic iNKT cells, they produced IL-10 after αGalCer stimulation (Supplementary Fig. 4b). However, after PMA + Ionomycin stimulation, adipose iNKT cells produced high amounts of IFN-γ, TNF and IL-10, but little IL-4 (Supplementary Fig. 4c). Adipose tissue iNKT cells did not produce IL-17A following either αGalCer or PMA + Ionomycin stimulation (Supplementary Fig. 4c). Thus, although adipose iNKT cells express the machinery for IFN-γ production and are capable of producing IFN-γ under mitogenic conditions, they produce IL-10 and not IFN-γ when stimulated with a strong lipid ligand.
IL-10 production in adipose iNKT cells is controlled by E4BP4
We next investigated the transcription factors that control IL-2 and IL-10 expression in the adipose tissue iNKT cells. E4BP4, encoded by the Nfil3 gene, is known to regulate IL-10 expression in TH1, Treg and NKT cells 6,39. By microarray analysis, we found that E4BP4 transcript was highly expressed in adipose tissue iNKT cells, but not in liver and spleen iNKT cells, while thymic iNKT cells expressed very low amounts (Fig. 4a). Intranuclear mAb staining showed E4BP4 protein expression in adipose tissue iNKT cells, but not in iNKT cells in liver, spleen, thymus, bone marrow, lymph node and blood (Fig. 4b). Adipose tissue Treg cells also expressed E4BP4 mRNA transcripts (Fig. 4a) and E4BP4 protein, as detected by intracellular E4BP4 mAb staining, at levels similar to adipose iNKT cells (Fig. 4c). Conventional CD8+ T cells and (non-regulatory) CD4+ T cells did not express E4BP4 (Fig. 4d). Flow cytometry confirmed that adipose tissue iNKT cells were not Treg cells, based on their lack of Foxp3 expression (Fig. 4e). Adipose Treg cells have high IL-10 mRNA expression (not shown, data available on Immgen.org), while adipose tissue iNKT cells produced IL-10 protein following in vivo injection of αGalCer (Fig. 4f). To determine if E4BP4 was required for IL-10 production in iNKT cells, we transfected in vitro-cultured primary splenic iNKT cells, which are E4BP4−, with E4BP4 (Fig. 4g). E4BP4 expression induced IL-10 production in αGalCer-stimulated splenic iNKT cells (Fig. 4h), as measured by intracellular cytokine staining and RT-PCR, whereas mock-transfected splenic iNKT cells did not express IL-10 after stimulation (Fig. 4i). Thus adipose iNKT cells, unlike splenic and hepatic iNKT cells, express the transcription factor E4BP4, which is responsible for IL-10 production.
Figure 4. Adipose iNKT cells express E4BP4 which induces IL-10 production.
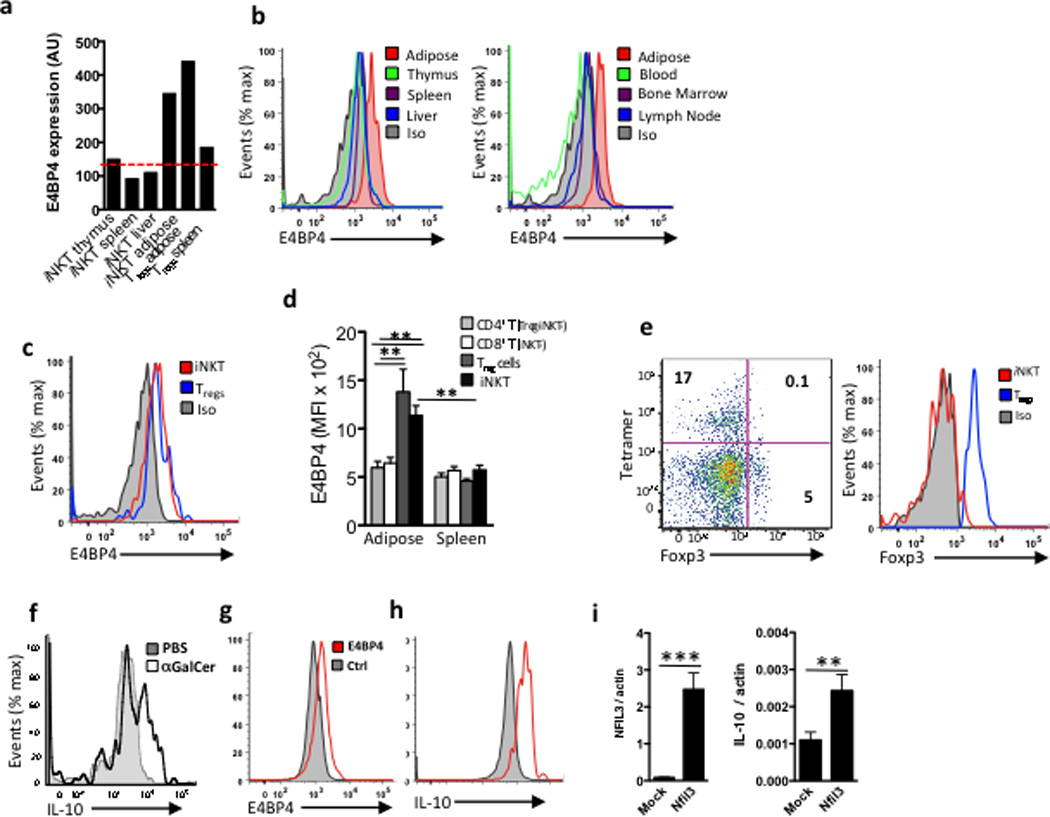
(a) mRNA levels of E4BP4 (Nfil3) in iNKT cells from thymus, spleen, liver and adipose tissue, as wells as Tregs from adipose and spleen as comparison. (b) Representative histogram of intracellular staining for E4BP4 in iNKT cells in several organs and adipose (red), and isotype control (grey filled) (n=4 mice, same mice for each organ). (c) Representative histogram comparing intracellular staining of E4BP4 in adipose iNKT cells vs. adipose Tregs cells (B&C) representative of n=6. (d) Graph of E4BP4 expression (MFI) by flow cytometry gated on adipose and splenic CD4+ and CD8+ T cells after Tregs and iNKT cells were excluded, compared to adipose and splenic Tregs and iNKT cells (n=5). (e) Representative dot plot of Foxp3 staining and tetramer staining after gating on adipose TCRβ+ cells, and histogram of Foxp3 levels in iNKT cells and Tregs cells from adipose tissue (representative of n=8). (f) Intracellular staining of IL-10 in adipose iNKT cells after 4hrs stimulation in vivo following PBS or αGalCer injection, representative of n=6 mice. (g) Primary splenic iNKT cell lines were transfected with E4BP4 (red lines) or mock transfected (grey). Representative histogram of E4BP4 expression 18 hrs after transfection. (h) Intracellular levels of IL-10 levels and (i) mRNA levels of IL-10 in iNKT cells transfected with E4BP4 or mock transfected (n=3 cell lines transfected and mock transfected).
Adipose iNKT cells regulate adipose resident macrophages
Through their rapid cytokine production, iNKT cells are potent transactivators of immune cells and act as a bridge between innate and adaptive immunity. We next investigated the effects of adipose iNKT cell-derived IL-2 and IL-10. Firstly, to address the localization of iNKT cells in the wild-type adipose tissue at steady-state or after αGalCer activation, we developed an αGalCer-loaded CD1d tetramer labeling technique that allows detection of iNKT cells in situ in fresh tissues by confocal microscopy. CXCR6-reporter mice have previously been used to visualize hepatic iNKT cells30. By αGalCer-loaded CD1d tetramer staining we confirmed that the majority (>90%) of CXCR6+ cells in the adipose tissue were iNKT cells (Fig. 5a and data not shown) and therefore we used CXCR6-GFP reporter mice to image iNKT cells in the adipose tissue. We found that CD1d tetramer+ cells (which were also CXCR6-GFP+) were broadly dispersed throughout adipose tissue at steady state (Fig. 5a, b), while following αGalCer stimulation iNKT cells formed numerous clusters in the adipose tissue (Fig. 5a). Co-staining of wild-type mouse adipose tissues showed that iNKT cells interacted with CD11b+ macrophages at steady state, particularly with CD301+ M2 macrophages (Fig. 5b). Following αGalCer stimulation, iNKT cells and CD11b+ macrophages formed clusters around and between adipocytes (Fig. 5b). iNKT cells co-localization with macrophages increased from ~20% at steady-state to 50% of iNKT cells after αGalCer treatment (Figure 5c). Lack of iNKT cells was shown to induce a pro-inflammatory environment in obese adipose tissue, including increased numbers of pro-inflammatory macrophages16,20. Furthermore,IL-10 blocking prevents some of the beneficial effects of αGalCer stimulation on metabolism16. To address if iNKT cell-derived IL-10 directly influences macrophage pro- or anti-inflammatory profiles in lean mice, we assessed the expression of the M2 markers CD206 and CD301, and the M1 marker CD11c on adipose tissue macrophages 3 days after treatment of wild-type lean mice with PBS or αGalCer. Immunohistochemstry showed that αGalCer induced an increase of CD206+ macrophages within 3 days compared to PBS treated mice (Fig. 5d). By flow cytometry, we saw a decrease in the frequency of CD11c+ M1 macrophages and a significant increase in the frequency of CD206+ (22 to 38%) and CD301+ (35–50%) M2 macrophages in αGalCer compared to PBS treated mice (Fig. 5e). Whole adipose tissue qPCR analysis showed that αGalCer reduced iNOS mRNA expression in wild-type, but not in CD1d−/− mice (Fig. 5f). Furthermore, CD1d−/− mice had more CD11c+ M1 macrophages (Fig. 5g) and more iNOS+ macrophages compared to WT mice (Fig. 5h), as measured by flow cytometry. To determine if iNKT derived-IL-10 was responsible for macrophage M2 polarization in the adipose tissue, we neutralized IL-10 at the time of αGalCer treatment. The decrease in CD11c+ macrophages frequency after αGalCer treatment occurred independently of IL-10, however, the increase in the frequency of CD206+ and CD301+ M2 macrophages was prevented by IL-10 neutralization (Fig. 5i). αGalCer treatment also induced the upregulation of IL-10R on adipose tissue macrophages, which was also prevented by IL-10 neutralization (Fig. 5i). Thus, iNKT cells interact with macrophages at steady state and after αGalCer stimulation, and activation of adipose tissue iNKT cells with αGalCer induces IL-10R upregulation and the M2 polarization of adipose macrophages in lean mice.
Figure 5. Adipose iNKT cells interact with macrophages in vivo and induce M2 macrophages through IL-10.
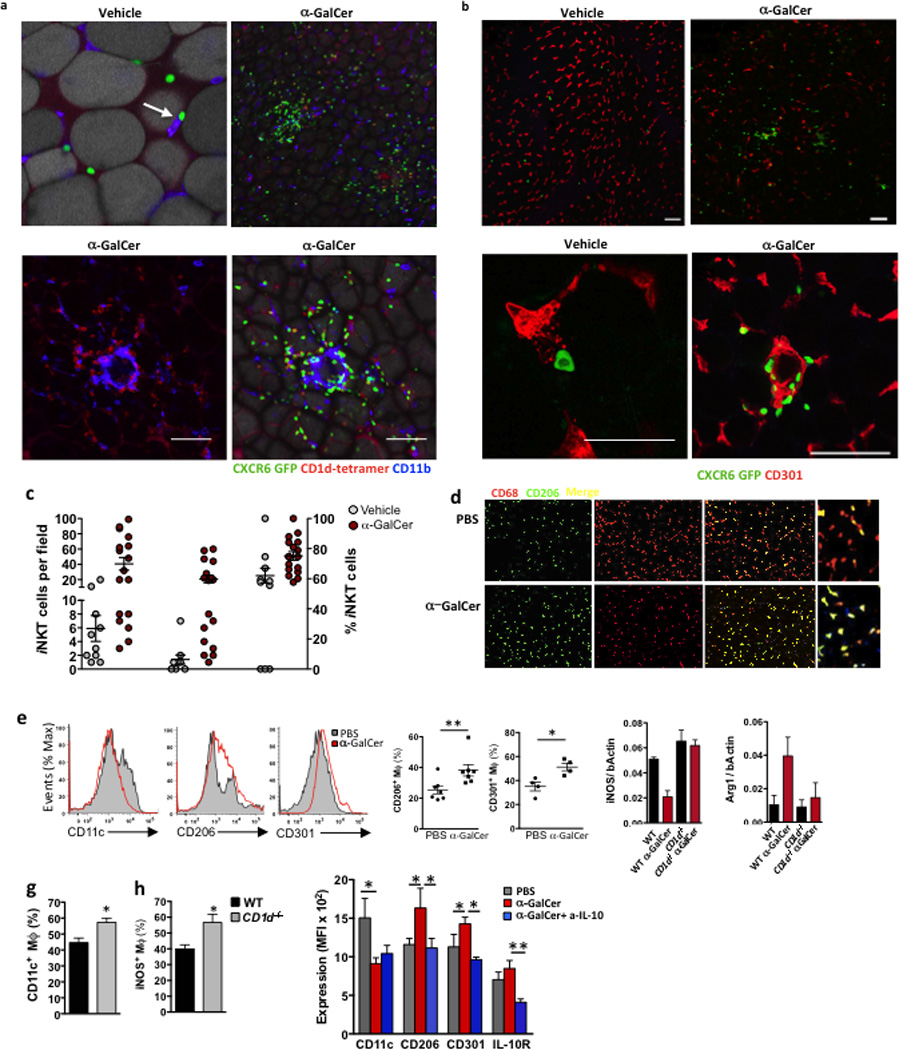
(a&b) Confocal images of CD1d tetramer labeling and CXCR6-GFP+ cells, co-stained with CD11b or CD4, in whole adipose tissue sections from WT and CXCR6-GFP+ mice 4 days after treatment with vehicle control or αGalCer (representative of 5 mice per treatment). (c) Quantification of iNKT-macrophage interactions. Number of iNKT cells after vehicle or αGalCer treatment per field (Left group), number of iNKT cells co-localizing with macrophages (middle group), and quantification of % of total iNKT cells interacting with macrophages per field after vehicle or αGalCer treatment (right group). (d) Immunofluorescent microscopy staining for macrophages in whole mount adipose tissue 3 days after in vivo PBS or αGalCer treatment. CD68 (red), CD206/MMR (green) and double positive ‘M2 phenotype’ macrophages (merged yellow cells). (e) Representative histograms of CD11c, CD206 and CD301 levels after gating on CD11b+F480+ macrophages in adipose tissue. Graphs of CD206+ (n=7) and CD301+ F480+ (n=4) macrophages in each mouse after treatment in vivo with PBS or αGalCer. (f) qPCR of iNOS and Arginine (Arg1) levels over bActin in whole adipose tissue after vehicle or αGalCer treatment in WT and CD1d−/− mice (n=3 per group). (g) Surface CD11c+ and (h) intracellular levels of iNOS in adipose macrophages in WT and CD1d−/− mice (n=3 per group). (i) In vivo treatment of WT mice with PBS or αGalCer (aGC) was repeated, with the inclusion of an IL-10 neutralizing antibody (aIL-10). Graph of mean level of CD11c, CD206, CD301 and IL-10R on adipose macrophages (n=4–5). Statistical comparisons using t-tests or ANOVA for group of 3 with Tukey post-hoc test. *p<0.05, **p=<0.01, ***p<0.001.
Adipose iNKT cells regulate adipose Treg cells
Treg cells have high expression of CD25 and require IL-2 for survival and proliferation40. Therefore, we investigated whether IL-2 production by iNKT cells influence Treg cells function in the adipose tissue. First, we assessed if in vivo αGalCer stimulation of iNKT cells in wild-type mice had an effect on adipose tissue Treg cells. Three days after αGalCer treatment, adipose Treg cells increased in frequency (from 3 to 7% of lymphocytes, or from 15% to 30% of CD4+ T cells) and in absolute number (from 10,000 to 50,000 per 2 fat pads; Fig. 6a–d). In contrast, in the spleen, where iNKT cells do not produce IL-2, splenic Treg cell numbers did not increase after αGalCer administration (Fig. 6e). We also assessed Treg cells expansion after αGalCer administration to Foxp3-GFP reporter mice. Treg cells were sparse and difficult to detect by GFP immunofluorescence in the adipose tissue of 6 to 16 weeks old naïve Foxp3-GFP mice. Following αGalCer administration, GFP+ Treg cells were observed within iNKT cell clusters in adipose tissue (Fig. 6f). To address if the transactivation of Treg cells occurs within the iNKT cells clusters, we examined Treg cell numbers in the adipose tissue of CD1d−/− and Ja18−/− mice at steady state. Treg cells frequencies were significantly decreased in the adipose tissue of CD1d−/− mice (1.6%) compared to wild-type (4% of lymphocytes; Fig. 6g). Nuclear Ki67 staining showed that Treg cells proliferated less in adipose tissue of CD1d−/− mice at steady state compared to wild-type mice (Fig. 6h). Treg cell frequencies were also significantly reduced in adipose tissue of young and old Ja18−/− mice compared to wild-type mice (Fig. 6i). To test if iNKT cells-derived IL-2 was critical for Treg cell regulation in the adipose tissue, we neutralized IL-2 in αGalCer-treated wild-type mice. IL-2 blocking prevented the αGalCer -induced expansion of adipose tissue Treg cells in vivo (Fig. 6j). These data suggest that activation of iNKT cells transactivates adipose Treg cells and regulates their homeostasis.
Figure 6. Adipose iNKT control adipose tissue Tregs through IL-2 production.
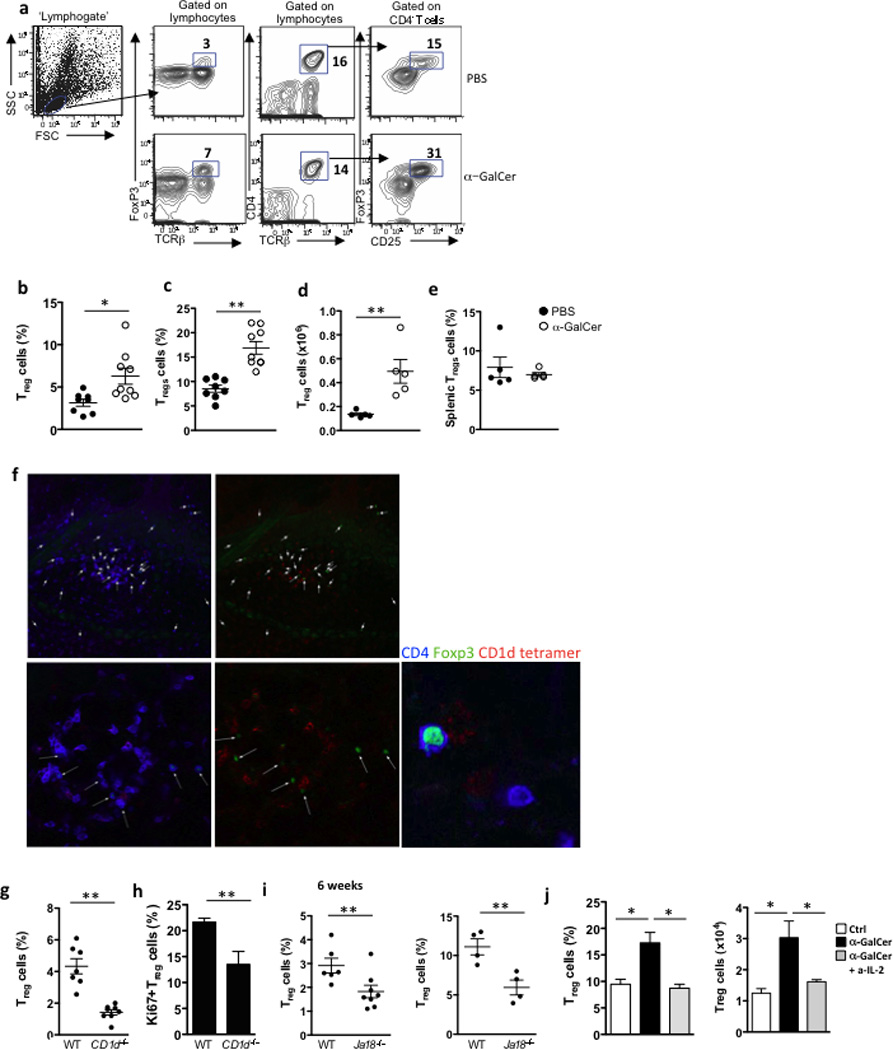
(a) Gating strategy, and representative contour plots of adipose Tregs after PBS or αGalCer treatment. (b) Levels of Tregs as a % of adipose lymphocytes and (c) as % of adipose T cells, after treatment with PBS (n=8) or αGalCer (n=9). and (d) number of Tregs in adipose tissue after treatment with PBS or αGalCer (n=5). (e) Levels of splenic Tregs from the same mice after treatment with PBS or αGalCer (n=5). Treg cell levels and numbers were measured 3 days post-injection. (f) Confocal images of CD1d tetramer labeling and Foxp3-GFP+ cells, co-stained with CD4, in whole adipose tissue sections from Foxp3-GFP+ mice that received αGalCer (represents 4 mice). (g) Levels of Tregs as a % of adipose lymphocytes, in 6wk-old WT versus CD1d−/− mice (n=7 per strain). (h) Adipose Tregs were stained intracellularly with Ki67 in 6wk-old WT versus CD1d−/− mice (n=5). (i) Levels of Tregs as a % of adipose T cells, in 6wk-old and 6 month old WT (n=6 and n=4) versus Ja18−/− mice (n=9 and n=4). (j) Treatment of WT mice with PBS or αGalCer (n=5 per group) was repeated, with the inclusion of an IL-2 neutralizing antibody in one group of αGalCer treated mice, and Treg % and number were measured in adipose tissue. Statistical comparisons using t-tests or ANOVA for group of 3 with Tukey post-hoc test. *p<0.05, **p=<0.01, ***p<0.001.
iNKT cells in adipose tissue are regulatory
Next we addressed whether adipose tissue iNKT cells induced macrophage M2 polarization directly or indirectly, through Treg activation and IL-10 production. Adipose tissue Treg cells express high amounts of IL-10 at resting state18, and have a higher expression of the lectin-like inhibitory receptor Klrg1compared to Treg cells in other tissues, indicative of strong anti-inflammatory and suppressive functions. Klrg1 expression is thought to be IL-2 dependent and identifies a population with enhanced suppressive function 41. Flow cytometry analysis showed that adipose tissue Treg cells expressed high amounts of Klrg1 protein (57%, compared to 5% on splenic Tregs; Fig. 7a). Klrg1 expression on adipose tissue Treg cells increased following αGalCer treatment (Fig. 7a) while Treg cells in CD1d−/− mice expressed significantly less Klrg1 than wild-type in the adipose tissue (Fig. 7a). Furthermore, adipose Treg cells had enhanced production of IL-10 after αGalCer treatment compared to mice that received PBS (Fig. 7b). At steady state, there were significantly fewer Treg cells producing IL-10 in Ja18−/− iNKT cells deficient mice (Fig. 7c). To further test the hypothesis that iNKT cells can enhance Treg cell functions, we co-cultured peritoneal macrophages with freshly isolated adipose tissue Treg cells from wild-type lean mice treated with PBS or αGalCer for 3 days. All adipose tissue Treg cells induced the expression of M2 markers on cultured macrophages, whileTreg cells from αGalCer-treated mice had enhanced ability to induce M2 macrophage marker expression compared to PBS treatment (Fig. 7d). These results suggest that iNKT cells can regulate the number and function of adipose Tregs cells.
Figure 7. Adipose iNKT cells enhance the suppressive ability of Tregs and have similar functions to Tregs.
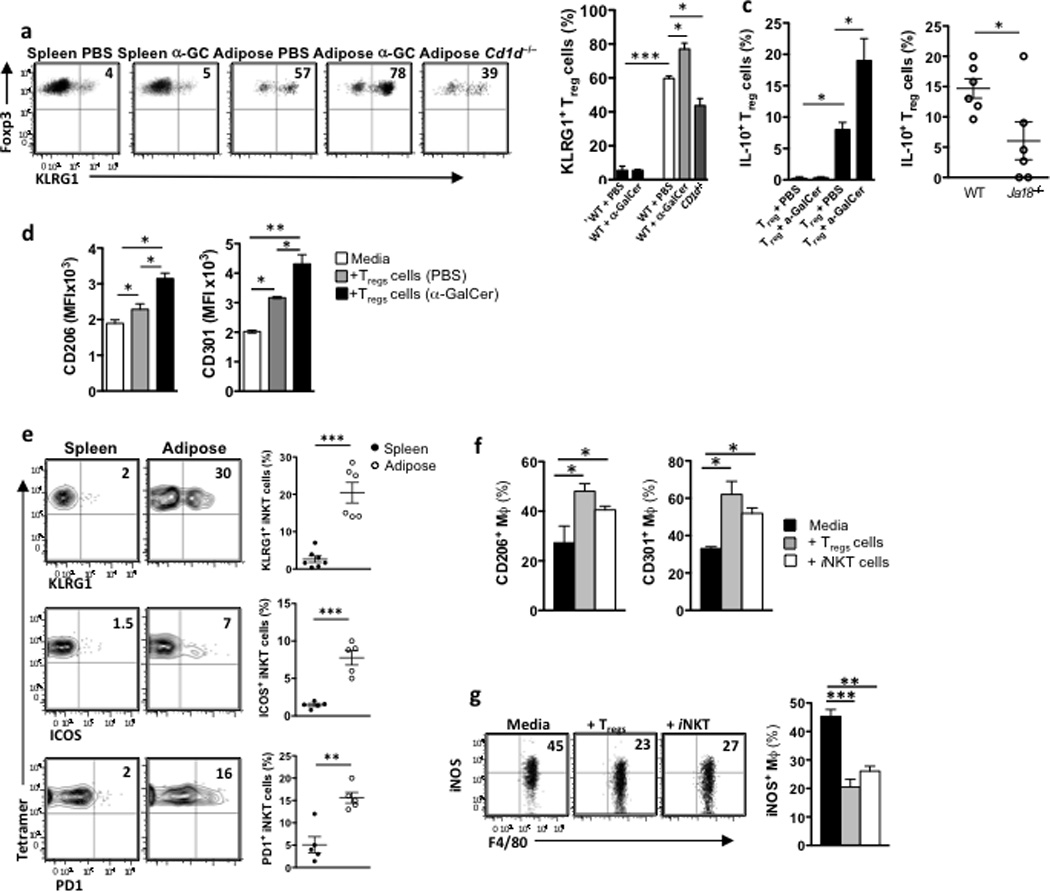
(a) Dot plots and graph of Klrg1 surface expression on splenic Treg cells (CD3+CD4+Foxp3+) in spleen 3 days after PBS or αGalCer treatment, or in WT adipose tissue 3 days after PBS or αGalCer treatment, or in adipose tissue of CD1d−/− mice (n=5 per group). (b) Intracellular IL-10 production in vivo by Treg cells in spleen (first 2 bars) and adipose tissue (last 2 bars) after treatment in vivo with αGalCer (n=4). (c) Basal intracellular IL-10 production in vivo by adipose Tregs in WT and Ja18−/− mice (n=6). (d) 10,000 Tregs were isolated from adipose tissue that had been treated with PBS or αGalCer for 3 days (pooled from 5 mice per treatment group), and cultured with peritoneal macrophages. MFI of CD301 and CD206 levels were measured on cultured macrophages (n=3 experiments). (e) Klrg1, ICOS and PD-1 surface expression on iNKT cells from spleen and adipose tissue (n=5–6). (f) Peritoneal macrophages were isolated from WT mice and cultured for 48hrs with either iNKT cells or Treg cells from adipose tissue or media alone. After 48hrs of culture, macrophages were stained for flow cytometric analysis of CD206/MMR and CD301 levels (n=2 independent experiments). (g) Dot plots and graphs of intracellular iNOS levels in peritoneal macrophages from obese mice cultured with adipose Treg cells and iNKT cells for 24 hours. Statistical comparisons using t-tests or ANOVA for group of 3 with Tukey post-hoc test. *p<0.05, **p=<0.01, ***p<0.001.
We also investigated if adipose iNKT cells could induce M2 macrophage polarization directly. We found that adipose iNKT cells had high expression of Klrg1 mRNA (not shown) and expressed more cell surface Klrg1 (30%) compared to splenic iNKT cells (2%; Fig. 7e). Adipose iNKT cells also expressed more ICOS (7%, compared to 1% on splenic iNKT) and PD1 (16%, compared to 2% on splenic iNKT; Fig. 7e), suggesting that adipose iNKT cells, but not splenic iNKT cells share some phenotypical markers with Treg cells. To test the regulatory functions of adipose iNKT cells, we cultured freshly isolated iNKT cells and Tregs from wild-type mouse adipose tissues with peritoneal macrophages. iNKT cells alone were sufficient to induce the expression of M2 macrophage markers on cultured macrophages, similar to, although not as strongly, as adipose Treg cells (Fig. 7f). iNKT cells isolated from spleen had no regulatory potential, although splenic Treg cells did, as expected (Supplementary Fig. 5). Co-culture with either adipose Treg cells or iNKT cells significantly reduced the frequency of iNOS-producing macrophages compared to culture with media alone (Fig. 7g). These data indicate that adipose iNKT cells can directly induce M2 anti-inflammatory macrophages, and also enhance the ability of Treg cells to do the same.
Discussion
Here we describe a population of PLZFneg/lo iNKT cells resident in adipose tissue, that are Foxp3 negative but regulatory in nature. Adipose PLZFneg/lo express E4BP4, produce IL-2 and IL-10 and control adpose Treg cells and macrophages locally, making them important regulators of immunity in adipose tissue. iNKT cells are can act as cellular adjuvants that enhance immune responses and bridge the innate and adaptive immune systems. Although iNKT cells express a canonical TCR, they are a heterogeneous population. They respond differently under specific conditions, and have tissue specific responses. Therefore, the ability of iNKT cells to produce various cytokines, and subsequently skew an immune response is due either to the microenvironment in which they are activated, and/or to the existence of functionally distinct iNKT-1,-2, −17 and NKT-FH cell subsets6,35,37,38. Our findings using parabiosis pointed to the tissue resident nature of adipose iNKT cells. Based on their transcription factor profile, including the very low PLZF levels, and expression of E4BP4, adipose iNKT cells do not fall into the NKT-1, NKT-2, NKT-17 or NKT-FH cell subsets previously described. A population of NKT cells expressing both PLZF and FoxP3 in cervical lymph nodes following aGalCer administration have been reported in a EAE model42, suggesting that regulatory iNKT cells can be induced in specific settings. However, we found that adipose iNKT cells do not express Foxp3. Thus, adipose iNKT cells are a distinct regulatory subset based on their phenotype, transcriptional program and function.
The adipose tissue PLZFlo iNKT cell subset may develop towards this distinct phenotype in the thymus before migration to adipose tissue. Alternatively, this subset may represent a state of activation. iNKT cells in the rest of the body are found in a poised state, ready for rapid cytokine production following activation. In contrast to these other sites, our data suggests that adipose iNKT cells may be chronically activated. At steady state, we found that adipose tissue iNKT cells lack IL-7R and express high amounts of CD69 and Nur77, which are hallmarks of activation through TCR stimulation43. In addition, cultured iNKT cell clones decrease their PLZF expression after stimulation44. Therefore, signals in the adipose tissue may sustain this iNKT cell subset as chronically activated. These may include lipid antigens, cytokines or adipokines that may provide co-stimulatory signals to iNKT cells in the presence of endogenous lipid antigens. CD1d is expressed in human adipose tissue15. Adipocytes themselves express CD1d21,22, and therefore may function as antigen presenting cells for iNKT cells. However, if iNKT cells were chronically activated in the adipose tissue, one might expect them to be in an anergic state. Although more adipose iNKT cells express PD1 than splenic iNKT cells, our data suggests that adipose iNKT cells are not anergic, as they proliferate massively and produce cytokines in vivo after αGalCer injection. It was recently reported that iNKT cells pre-treated with αGalCer, which are typically thought to become hyporesponsive, were still capable of proliferating and produced cytokines, namely IL-1045, suggesting these cells had not become anergic, but rather immunoregulatory, subsequent to strong stimulation. The same report found a functionally similar population enriched in adipose tissue without αGalCer treatment45, lending strength to the hypothesis that adipose iNKT cells may be alternatively activated due to chronic stimulation locally. Adipose iNKT cells also appear less dependent on PLZF expression for their development or local homeostasis compared to other iNKT subsets. First, they express very little PLZF and second, there was no significant reduction in adipose iNKT cell numbers in PLZF+/− mice. Studies using haplosufficient PLZF mice have shown that high levels of PLZF expression were required for the effector functions of other iNKT cells2,3,44 and development, evidenced by a severe decrease of iNKT cell numbers in the periphery in PLZF+/− mice. It remains to be seen whether there is a compensatory mechanism in haplosufficient PLZF mice in the adipose tissue, or whether high levels of PLZF would be required for iNKT cell development, traffic or survival in adipose tissue, in a similar way to what is required for iNKT cells in the liver and spleen.
Adipose tissue is a site of constant remodeling with fluctuations in lipid handling, storage and lipolysis, due to the fasting and feeding cycles that occur in mice and humans, or in more extreme examples, during famine or obesity. The adipose resident immune system seems to function in an anti-inflammatory state to dampen inflammation during potentially dangerous remodeling, where foreign dietary derived lipids must be tolerized, and also buffered to prevent lipotoxicity. Adipocytes play an important role in buffering lipids from the immediate environment, and also from preventing lipid spillover to ectopic sites like liver and muscle. However, the immune system, particularly macrophages, have also been implicated in preventing lipotoxicity and in buffering lipids46. We suggest that enrichment of regulatory iNKT cells in adipose tissue helps to keep inflammation at bay, and at the same time, to regulate the homeostasis of other anti-inflammatory immune cells including M2 macrophages and Treg cells.
This scenario fits perfectly with a protective role for adipose iNKT cells in obesity, although the beneficial role of iNKT cells in obesity is currently controversial47,48 due to variations in the metabolic phenotype of iNKT deficient mice. However, several studies have shown adoptive transfer of iNKT cells into obese iNKT-deficient mice16 or activation of iNKT cells by αGalCer in obesity dampens inflammation, leading to improved metabolic outcome and weight loss16,20,22,27. However, the mechanism of action of adipose iNKT cells, as was the basis for their anti-inflammatory nature, remained unclear. Our current study sheds light on the mechanisms of action for iNKT cells in adipose tissue, and therefore has important implications in obesity and associated metabolic disease. The anti-inflammatory and regulatory nature of adipose iNKT cells suggests that they can influence the functions of macrophages and Tregs cells directly, as well as functioning as regulatory cells themselves. The observed depletion of adipose iNKT cells in human and murine obesity15,16,20–22 therefore represents the loss of an important regulatory population. Without adipose regulatory iNKT cells, Treg cell numbers and M2 macrophage status are compromised, both of which impact adipose tissue inflammation and metabolic disorder that accompanies obesity. The capacity of iNKT cells to activate rapid cytokine production has been exploited to manipulate the outcomes of mouse models of autoimmunity and cancer various cancers8,13,49. Our findings indicating that adipose iNKT cells maintain a healthy adipose tissue under normal conditions suggest they may be a potential therapeutic target to correct obesity and metabolic disorder.
Online Methods
Mice
C57BL/6, mice were purchased from Jackson Laboratory. CD1d−/− were provided by Mark Exley (Harvard Medical School). C57BL/6 CXCR6-GFP+/− mice (The Jackson Laboratory) and C57BL/6 Foxp3gfp mice50 (founders were kindly provided by Dr. Alexander Rudensky at the Memorial Sloan-Kettering Cancer Center) were bred and maintained at the Trudeau Institute and were used at 8–16 weeks of age. PLZF-deficient mice (were kindly provided by Dr. Pier Paulo Pandolfi) and have been described3. PLZF-reporter (PEG) mice were generated in the Sant’Angelo lab with a modified bacterial artificial chromosome transgene expressing eGFP under the control of PLZF regulatory elements. The pLD53 SC-AB vector system (provided by Dr. E. Pamer, MSKCC, New York, NY) was used for the modification. The purified bacterial artificial chromosome transgene was microinjected into fertilized C57BL/6 eggs by MSKCC’s Mouse Genetics Core Facility. EGFP expression faithfully reproduced PLZF expression in all three founder lines. One was selected for further experiments. PCre mice were generated with similar methodology with a bacterial artificial chromosome transgene expressing Cre recombinase under the control of PLZF promoter. In almost all experiments, male mice were used, with the exception of PLZF+/− and −/− mice and Jα18−/− where male and female mice were used and compared to male a female WT mice. Mice were bred in our specific-pathogen-free facilities at Harvard Medical School. All animal work was approved by and in compliance with the Institutional Animal Care and Use Committee guidelines of The Dana Farber Cancer Institute and Harvard Medical School.
Tissue processing
The visceral abdominal fat was isolated from the mice and digested with 20 mL collagenase solution (1mg/mL collagenase in PBS) at 37°C for 25 min with shaking. After digestion, adipocytes were isolated by filtering through a 40um nylon mesh and centrifuged for 5 min at 300g to pellet the stromovascular fraction (SVF). The supernatant was discarded and the SVF was washed with FACS buffer (1%FBS and 0.02% NaN3 in PBS), then resuspended in FC block at 4°C for 15 min and then stained with desired antibodies.
Parabiosis surgery
CD45.1 and CD45.2 mice were anesthetized with 100 mg/kg ketamine and 10 mg/kg xylazine. After shaving, a linear incision was made from the scapulae to the lower abdomen on opposing sides of each member of the pair. Animals were placed side-by-side and skin edges sewn together. Each pair was housed singly, with food placed on the floor of the cage for the first week during recovery. Parabiotic mice were kept together for 2–3 weeks. Percent chimerism in the blood and tissues was defined for gated lymphocytes, or lymphocyte subsets as the percentage of CD45.1+ cells over the percentage of CD45.1+ plus CD45.2+ cells in CD45.2+ mice and as the percentage of CD45.2+ cells over the percentage of CD45.2+ plus CD45.1+ cells in CD45.1+ mice.
Microarray
iNKT cells were sorted on a FACSAria (BD) by the Flow Cytometry Core of The Dana-Farber Cancer Institute. Cells were double-sorted to >95% purity and collected into TRIzol (Invitrogen). Sample processing and data analysis were performed as previously described32. Expression plots were produced with GenePattern.
Single-cell PCR
cDNA from sorted CD1d-α-GalCer tetramer+ TCRβ+ cells was generated by the addition of 2µl per well of buffer containing SuperScript VILO (Invitrogen) and 0.1% Triton X-100 (Sigma), and incubated according to manufacturer’s instructions. Transcripts encoding Vα and Vβ were amplified by two rounds of nested PCR as previously described (paper reference below). PCR products were separated on a 1.5% agarose gel and sequenced (Applied Genetics Diagnostics, University of Melbourne).
Confocal/fluorescent microscopy
For detection of GFP and PBS57-CD1d tetramer staining, epididymal or subcutaneous adipose tissue was harvested into PBS/0.02% sodium azide /5% normal mouse serum (Jackson ImmunoResearch Laboratories, Inc.). Tissues were first stained with PBS57 loaded-CD1d tetramers (provided by the NIH Tetramer Core Facility) at room temperature for 60 min in the dark on a circular shaker. Subsequent antibody staining was performed on ice for 60 min, in the dark on a circular shaker. Next, tissue was washed with PBS/ 0.02% sodium azide/ 5% mouse serum. Adipose tissue was imaged on glass slides with Aqua Poly/Mount (Polysciences, Inc.) and a coverslip by confocal microscopy (Leica TCS SP5). Surface antibody staining included anti-CD11b (M1/70) from eBioscience, anti-CD4 (RM4-5) and anti-CD301 (LOM-14) from Biolegend.
Flow cytometry and cell sorting
Single-cell suspensions were incubated with Fc receptor-blocking antibody before being stained on ice with specific antibodies and tetramer. Dead cells were excluded with live/dead gate using 7-AAD, or Zombie Aqua (BioLegend) for fixed and permeabilized cells. αGalCer analog PBS-57-loaded or empty CD1d tetramers were provided by the NIH tetramer facility (Emory Vaccine Center, Atlanta). For analysis of iNKT cells, a dump gate with CD19 was used to eliminate non-specific staining, and staining of the same cell preparations with ‘empty’ tetramer (no αGalCer) confirmed specificity. Antibodies conjugated to fluorescein isothiocyanate, phycoerythrin, phycoerythrin-indotricarbocyanine, peridinine chlorophyll protein complex 5.5, allphycocyanin or allophycocyanin-indotricarbocyanine were as follows: anti-IL-4 (11B11), -IFN-γ (XMG1,2), -IL-10 (JES5-16E3), -CD44 (IM7), -TCRβ (G572597), -CD11b (M1/70), -CD11c (N418), -F4/80 (CI:A3-1), -NK1.1 (PK136), -CD3 (500A2), -CD4 (RM4-5), and -CD25 (PC61). For staining for transcription factors anti-PLZF(9E12), -Tbet (4B10), -Gata3 (16E10A23), -RORγt (B2D), -Foxp3 (FJK-16s), and -E4BP4 (S2M-E19) and cytokines, cells permeabilized with the Foxp3 staining buffer set (eBioscience). Cell doublets were excluded by comparison of side-scatter width to forward-scatter area.
In Vivo Stimulation of iNKT Cells and Intracellular Cytokine Staining
Mice were injected i.p. with 1 µg of αGalCer or vehicle alone and sacrificed after 5 hr or 4 days. Single-cell suspension of splenocytes, liver mononuclear cells, and adipose tissue SVFs were obtained as before, but with the inclusion of Brefeldin A in all media. First, single-cell suspensions of splenocytes or LMNCs were stained with cell-surface-labeling CD3 mAb and αGalCer -loaded CD1d tetramer. Cells were then fixed, permeabilized, and stained intracellularly for IL-4, IL-10, and IFN-γ using the Cytofix/Cytoperm kit (BD Biosciences), according to the manufacturer’s instructions. To neutralize cytokines prior to αGalCer treatment, anti-IL-4 (11B11) or anti-IL-10 (JES5-2A5) were injected i.p. prior to injection of αGalCer.
Statistics
Results are expressed as the mean ± S.E.M. The statistical tests used included unpaired Student’s t test using Welch’s correction for unequal variances and one-way analysis of variance followed by Tukey’s post-hoc test. P ≤ _0.05 was considered to denote significance. No exclusion of data points or mice was used. Pilot studies were used for estimation of the sample size required to ensure adequate power. Mice that received treatment were randomized per cage so that each cage contained mice with test treatment versus control treatment (ie. aGalCer vs vehicle).
Supplementary Material
Acknowledgements
The authors would like to thank Dr. P.P. Pandolfi for the use of the PLZF−/− mice and Dr. A.Rudensky (Sloan-Kettering Institute) for the use of the Foxp3gfp mice, Ms. K. Rothamel, and the US National Institutes of Health Tetramer Core for mouse CD1d-PBS57 tetramers. This work benefited from public data generated by the Immunological Genome Project (http://www.immgen.org). L.L. was supported by a Marie Curie Fellowship. M.B.B. is supported by research grants from the US National Institutes of Health (AI063428, AI028973 and DK057521) and the American Diabetes Association (7-12-IN-07). P.J.B. is supported by a career development award from the American Academy of Allergy, Asthma and Immunology ARTrust. M.T., E.E.V.D., and E.A.L. are supported by the Trudeau Institute and NIH T32 A1049823 (E.E.V.D.). D.I.G. and H.F.K. are supported by The National Health and Medical Research Council of Australia Program Grant (1013667), and an NHMRC Senior Principal Research Fellowship (1020770)(D.I.G). D.B.S. was supported by NIH NIAID R01 AI083988 and AI059739 and by the Robert Wood Johnson Foundation (grant #67038) to the Child Health Institute of New Jersey.
Footnotes
Author Contributions:
L.L. designed and performed experiments, analyzed data and wrote the paper; X.M., S.Z., A.M., C.L. and H.F.K. performed experiments; E.E.V.D, M.T. and E.A.L. developed analytical tools; P.J.B. contributed to the microarray analysis and other analysis, G.B. synthesized aGalCer, U.vA. D.I.G. and D.B.S’A. contributed to the design of experiments and provided materials and tools, and M.B.B. designed experiments and wrote the paper.
References
- 1.Cohen NR, Garg S, Brenner MB. Antigen Presentation by CD1 Lipids, T Cells, and NKT Cells in Microbial Immunity. Adv Immunol. 2009;102:1–94. doi: 10.1016/S0065-2776(09)01201-2. [DOI] [PubMed] [Google Scholar]
- 2.Savage AK, et al. The transcription factor PLZF directs the effector program of the NKT cell lineage. Immunity. 2008;29:391–403. doi: 10.1016/j.immuni.2008.07.011. [DOI] [PMC free article] [PubMed] [Google Scholar]
- 3.Kovalovsky D, et al. The BTB-zinc finger transcriptional regulator PLZF controls the development of invariant natural killer T cell effector functions. Nature immunology. 2008;9:1055–1064. doi: 10.1038/ni.1641. [DOI] [PMC free article] [PubMed] [Google Scholar]
- 4.Martin E, et al. Stepwise development of MAIT cells in mouse and human. PLoS biology. 2009;7:e54. doi: 10.1371/journal.pbio.1000054. [DOI] [PMC free article] [PubMed] [Google Scholar]
- 5.Kreslavsky T, et al. TCR-inducible PLZF transcription factor required for innate phenotype of a subset of gammadelta T cells with restricted TCR diversity. Proceedings of the National Academy of Sciences of the United States of America. 2009;106:12453–12458. doi: 10.1073/pnas.0903895106. [DOI] [PMC free article] [PubMed] [Google Scholar]
- 6.Watarai H, et al. Development and function of invariant natural killer T cells producing T(h)2- and T(h)17-cytokines. PLoS biology. 2012;10:e1001255. doi: 10.1371/journal.pbio.1001255. [DOI] [PMC free article] [PubMed] [Google Scholar]
- 7.Brennan PJ, Brigl M, Brenner MB. Invariant natural killer T cells: an innate activation scheme linked to diverse effector functions. Nat Rev Immunol. 2013;13:101–117. doi: 10.1038/nri3369. [DOI] [PubMed] [Google Scholar]
- 8.Berzins SP, Smyth MJ, Baxter AG. presumed guilty: natural killer T cell defects and human disease. Nature reviews. Immunology. 2011;11:131–142. doi: 10.1038/nri2904. [DOI] [PubMed] [Google Scholar]
- 9.Godfrey DI, Kronenberg M. Going both ways: immune regulation via CD1d-dependent NKT cells. J Clin Invest. 2004;114:1379–1388. doi: 10.1172/JCI23594. [DOI] [PMC free article] [PubMed] [Google Scholar]
- 10.Novak J, Griseri T, Beaudoin L, Lehuen A. Regulation of type 1 diabetes by NKT cells. International reviews of immunology. 2007;26:49–72. doi: 10.1080/08830180601070229. [DOI] [PubMed] [Google Scholar]
- 11.Araki M, et al. Th2 bias of CD4+ NKT cells derived from multiple sclerosis in remission. Int Immunol. 2003;15:279–288. doi: 10.1093/intimm/dxg029. [DOI] [PubMed] [Google Scholar]
- 12.van der Vliet HJ, et al. Circulating V(alpha24+) Vbeta11+ NKT cell numbers are decreased in a wide variety of diseases that are characterized by autoreactive tissue damage. Clin Immunol. 2001;100:144–148. doi: 10.1006/clim.2001.5060. [DOI] [PubMed] [Google Scholar]
- 13.Bosma A, Abdel-Gadir A, Isenberg DA, Jury EC, Mauri C. Lipid-antigen presentation by CD1d(+) B cells is essential for the maintenance of invariant natural killer T cells. Immunity. 2012;36:477–490. doi: 10.1016/j.immuni.2012.02.008. [DOI] [PMC free article] [PubMed] [Google Scholar]
- 14.Novak J, Lehuen A. Mechanism of regulation of autoimmunity by iNKT cells. Cytokine. 2011;53:263–270. doi: 10.1016/j.cyto.2010.11.001. [DOI] [PubMed] [Google Scholar]
- 15.Lynch L, et al. Invariant NKT cells and CD1d(+) cells amass in human omentum and are depleted in patients with cancer and obesity. European journal of immunology. 2009;39:1893–1901. doi: 10.1002/eji.200939349. [DOI] [PubMed] [Google Scholar]
- 16.Lynch L, et al. Adipose tissue invariant NKT cells protect against diet-induced obesity and metabolic disorder through regulatory cytokine production. Immunity. 2012;37:574–587. doi: 10.1016/j.immuni.2012.06.016. [DOI] [PMC free article] [PubMed] [Google Scholar]
- 17.Lumeng CN, DelProposto JB, Westcott DJ, Saltiel AR. Phenotypic switching of adipose tissue macrophages with obesity is generated by spatiotemporal differences in macrophage subtypes. Diabetes. 2008;57:3239–3246. doi: 10.2337/db08-0872. [DOI] [PMC free article] [PubMed] [Google Scholar]
- 18.Feuerer M, et al. Lean, but not obese, fat is enriched for a unique population of regulatory T cells that affect metabolic parameters. Nature medicine. 2009;15:930–939. doi: 10.1038/nm.2002. [DOI] [PMC free article] [PubMed] [Google Scholar]
- 19.Cipolletta D, et al. PPAR-gamma is a major driver of the accumulation and phenotype of adipose tissue Treg cells. Nature. 2012;486:549–553. doi: 10.1038/nature11132. [DOI] [PMC free article] [PubMed] [Google Scholar]
- 20.Ji Y, et al. Activation of natural killer T cells promotes M2 Macrophage polarization in adipose tissue and improves systemic glucose tolerance via interleukin-4 (IL-4)/STAT6 protein signaling axis in obesity. The Journal of biological chemistry. 2012;287:13561–13571. doi: 10.1074/jbc.M112.350066. [DOI] [PMC free article] [PubMed] [Google Scholar]
- 21.Schipper HS, et al. Natural killer T cells in adipose tissue prevent insulin resistance. The Journal of clinical investigation. 2012;122:3343–3354. doi: 10.1172/JCI62739. [DOI] [PMC free article] [PubMed] [Google Scholar]
- 22.Huh JY, et al. A novel function of adipocytes in lipid antigen presentation to iNKT cells. Molecular and cellular biology. 2013;33:328–339. doi: 10.1128/MCB.00552-12. [DOI] [PMC free article] [PubMed] [Google Scholar]
- 23.Weisberg SP, et al. Obesity is associated with macrophage accumulation in adipose tissue. The Journal of clinical investigation. 2003;112:1796–1808. doi: 10.1172/JCI19246. [DOI] [PMC free article] [PubMed] [Google Scholar]
- 24.Lumeng CN, Bodzin JL, Saltiel AR. Obesity induces a phenotypic switch in adipose tissue macrophage polarization. The Journal of clinical investigation. 2007;117:175–184. doi: 10.1172/JCI29881. [DOI] [PMC free article] [PubMed] [Google Scholar]
- 25.Schipper HS, et al. Natural killer T cells in adipose tissue prevent insulin resistance. J Clin Invest. 2012;122:3343–3354. doi: 10.1172/JCI62739. [DOI] [PMC free article] [PubMed] [Google Scholar]
- 26.Ji Y, et al. Short term high fat diet challenge promotes alternative macrophage polarization in adipose tissue via natural killer T cells and interleukin-4. The Journal of biological chemistry. 2012;287:24378–24386. doi: 10.1074/jbc.M112.371807. [DOI] [PMC free article] [PubMed] [Google Scholar]
- 27.Hams E, Locksley RM, McKenzie AN, Fallon PG. Cutting Edge: IL-25 Elicits Innate Lymphoid Type 2 and Type II NKT Cells That Regulate Obesity in Mice. Journal of immunology. 2013;191:5349–5353. doi: 10.4049/jimmunol.1301176. [DOI] [PMC free article] [PubMed] [Google Scholar]
- 28.Wright DE, Wagers AJ, Gulati AP, Johnson FL, Weissman IL. Physiological migration of hematopoietic stem and progenitor cells. Science. 2001;294:1933–1936. doi: 10.1126/science.1064081. [DOI] [PubMed] [Google Scholar]
- 29.Ohteki T, Maki C, Koyasu S, Mak TW, Ohashi PS. Cutting edge: LFA-1 is required for liver NK1.1+TCR alpha beta+ cell development: evidence that liver NK1.1+TCR alpha beta+ cells originate from multiple pathways. Journal of immunology. 1999;162:3753–3756. [PubMed] [Google Scholar]
- 30.Geissmann F, et al. Intravascular immune surveillance by CXCR6+ NKT cells patrolling liver sinusoids. PLoS biology. 2005;3:e113. doi: 10.1371/journal.pbio.0030113. [DOI] [PMC free article] [PubMed] [Google Scholar]
- 31.Thomas SY, et al. PLZF induces an intravascular surveillance program mediated by long-lived LFA-1-ICAM-1 interactions. The Journal of experimental medicine. 2011;208:1179–1188. doi: 10.1084/jem.20102630. [DOI] [PMC free article] [PubMed] [Google Scholar]
- 32.Cohen NR, et al. Shared and distinct transcriptional programs underlie the hybrid nature of iNKT cells. Nature immunology. 2013;14:90–99. doi: 10.1038/ni.2490. [DOI] [PMC free article] [PubMed] [Google Scholar]
- 33.Kronenberg M. Toward an understanding of NKT cell biology: progress and paradoxes. Annual review of immunology. 2005;23:877–900. doi: 10.1146/annurev.immunol.23.021704.115742. [DOI] [PubMed] [Google Scholar]
- 34.Bendelac A, Savage PB, Teyton L. The biology of NKT cells. Annual review of immunology. 2007;25:297–336. doi: 10.1146/annurev.immunol.25.022106.141711. [DOI] [PubMed] [Google Scholar]
- 35.Brennan PJ, Brigl M, Brenner MB. Invariant: natural killer T cells: an innate activation scheme linked to diverse effector functions. Nature reviews. Immunology. 2013;13:101–117. doi: 10.1038/nri3369. [DOI] [PubMed] [Google Scholar]
- 36.Constantinides MG, Bendelac A. Transcriptional regulation of the NKT cell lineage. Current opinion in immunology. 2013;25:161–167. doi: 10.1016/j.coi.2013.01.003. [DOI] [PMC free article] [PubMed] [Google Scholar]
- 37.Lee YJ, Holzapfel KL, Zhu J, Jameson SC, Hogquist KA. Steady-state production of IL-4 modulates immunity in mouse strains and is determined by lineage diversity of iNKT cells. Nature immunology. 2013;14:1146–1154. doi: 10.1038/ni.2731. [DOI] [PMC free article] [PubMed] [Google Scholar]
- 38.Chang PP, et al. Identification of Bcl-6-dependent follicular helper NKT cells that provide cognate help for B cell responses. Nature immunology. 2012;13:35–43. doi: 10.1038/ni.2166. [DOI] [PubMed] [Google Scholar]
- 39.Motomura Y, et al. The transcription factor E4BP4 regulates the production of IL-10 and IL-13 in CD4+ T cells. Nature immunology. 2011;12:450–459. doi: 10.1038/ni.2020. [DOI] [PMC free article] [PubMed] [Google Scholar]
- 40.Sakaguchi S. Naturally arising CD4+ regulatory t cells for immunologic self-tolerance and negative control of immune responses. Annual review of immunology. 2004;22:531–562. doi: 10.1146/annurev.immunol.21.120601.141122. [DOI] [PubMed] [Google Scholar]
- 41.Cheng G, et al. IL-2 receptor signaling is essential for the development of Klrg1+ terminally differentiated T regulatory cells. Journal of immunology. 2012;189:1780–1791. doi: 10.4049/jimmunol.1103768. [DOI] [PMC free article] [PubMed] [Google Scholar]
- 42.Monteiro M, et al. Identification of regulatory Foxp3+ invariant NKT cells induced by TGF-beta. Journal of immunology. 2010;185:2157–2163. doi: 10.4049/jimmunol.1000359. [DOI] [PubMed] [Google Scholar]
- 43.Moran AE, et al. T cell receptor signal strength in Treg and iNKT cell development demonstrated by a novel fluorescent reporter mouse. The Journal of experimental medicine. 2011;208:1279–1289. doi: 10.1084/jem.20110308. [DOI] [PMC free article] [PubMed] [Google Scholar]
- 44.Constantinides MG, Picard D, Savage AK, Bendelac A. A naive-like population of human CD1d-restricted T cells expressing intermediate levels of promyelocytic leukemia zinc finger. Journal of immunology. 2011;187:309–315. doi: 10.4049/jimmunol.1100761. [DOI] [PMC free article] [PubMed] [Google Scholar]
- 45.Sag D, Krause P, Hedrick CC, Kronenberg M, Wingender G. IL-10-producing NKT10 cells are a distinct regulatory invariant NKT cell subset. The Journal of clinical investigation. 2014 doi: 10.1172/JCI72308. [DOI] [PMC free article] [PubMed] [Google Scholar]
- 46.Xu X, et al. Obesity activates a program of lysosomal-dependent lipid metabolism in adipose tissue macrophages independently of classic activation. Cell metabolism. 2013;18:816–830. doi: 10.1016/j.cmet.2013.11.001. [DOI] [PMC free article] [PubMed] [Google Scholar]
- 47.Wu L, Van Kaer L. Contribution of lipid-reactive natural killer T cells to obesity-associated inflammation and insulin resistance. Adipocyte. 2013;2:12–16. doi: 10.4161/adip.22296. [DOI] [PMC free article] [PubMed] [Google Scholar]
- 48.Lynch L. Adipose iNKT cells. Immunology. 2014 doi: 10.1111/imm.12269. In Press. [DOI] [PMC free article] [PubMed] [Google Scholar]
- 49.Swann J, Crowe NY, Hayakawa Y, Godfrey DI, Smyth MJ. Regulation of antitumour immunity by CD1d-restricted NKT cells. Immunology and cell biology. 2004;82:323–331. doi: 10.1111/j.0818-9641.2004.01254.x. [DOI] [PubMed] [Google Scholar]
- 50.Fontenot JD, et al. Regulatory T cell lineage specification by the forkhead transcription factor foxp3. Immunity. 2005;22:329–341. doi: 10.1016/j.immuni.2005.01.016. [DOI] [PubMed] [Google Scholar]
Associated Data
This section collects any data citations, data availability statements, or supplementary materials included in this article.