

Abstract
Background and Aims Leaf gas exchange is influenced by stomatal size, density, distribution between the leaf adaxial and abaxial sides, as well as by pore dimensions. This study aims to quantify which of these traits mainly underlie genetic differences in operating stomatal conductance (gs) and addresses possible links between anatomical traits and regulation of pore width.
Methods Stomatal responsiveness to desiccation, gs-related anatomical traits of each leaf side and estimated gs (based on these traits) were determined for 54 introgression lines (ILs) generated by introgressing segments of Solanum pennelli into the S. lycopersicum ‘M82’. A quantitative trait locus (QTL) analysis for stomatal traits was also performed.
Key Results A wide genetic variation in stomatal responsiveness to desiccation was observed, a large part of which was explained by stomatal length. Operating gs ranged over a factor of five between ILs. The pore area per stomatal area varied 8-fold among ILs (2–16 %), and was the main determinant of differences in operating gs between ILs. Operating gs was primarily positioned on the abaxial surface (60–83 %), due to higher abaxial stomatal density and, secondarily, to larger abaxial pore area. An analysis revealed 64 QTLs for stomatal traits in the ILs, most of which were in the direction of S. pennellii.
Conclusions The data indicate that operating and maximum gs of non-stressed leaves maintained under stable conditions deviate considerably (by 45–91 %), because stomatal size inadequately reflects operating pore area (R2 = 0·46). Furthermore, it was found that variation between ILs in both stomatal sensitivity to desiccation and operating gs is associated with features of individual stoma. In contrast, genotypic variation in gs partitioning depends on the distribution of stomata between the leaf adaxial and abaxial epidermis.
Keywords: Amphistomatous, pore area, Solanum lycopersicum, S. pennellii, operating stomatal conductance, stomatal responsiveness, leaf gas exchange, quantitative trait locus, QTL
INTRODUCTION
Stomata control the loss of water and the intake of carbon dioxide by a leaf (Lawson and Blatt, 2014; Lawson et al., 2014). Under water shortage conditions, water conservation takes priority over carbon gain (Flexas and Medrano, 2002; Resco et al., 2009). When water supply is not limiting, increasing carbon dioxide intake and/or promoting leaf cooling (through increased transpiration) are the governing processes (Lu et al., 1994; Radin et al., 1994). Variation in stomatal anatomical features or stomatal pore width regulation influences gas exchange in diverse ways, and may be introduced by genetic factors and growth conditions, including evaporative demand (Aliniaeifard and van Meeteren, 2014; Giday et al., 2014), carbon dioxide level (Ainsworth and Rogers, 2007; Berry et al., 2010) and light regime (Pieruschka et al., 2010; Martins et al., 2014). Stomatal traits that are beneficial under a given climatic scenario might be less adaptive for plant performance in another environment (Tardieu, 2011).
For environments characterized by low or unpredictable water availability, soil water shortages strongly limit yield (Tuberosa, 2012; Harrison et al., 2014). Climate change may exacerbate negative effects through increased frequency of drought events (Rosegrant et al., 2009). Plants display a diverse set of strategies to deal with water scarcity, including drought avoidance mechanisms (Price et al., 2002). Most plants actively reduce their water loss by stomatal closure under water shortage conditions (Meinzer, 1993). Therefore, genotypes with stomata that are more responsive to desiccation have a selective advantage in low water environments (Skirycz and Inze, 2010). To our knowledge, no systematic effort to breed for stomatal closing ability has been attempted, while genetic variation in this trait probably remains unexplored.
In environments with an abundant water supply, increasing stomatal conductance (gs; conductance = 1/resistance) favours carbon dioxide uptake and evaporative cooling (Lu et al., 1994; Kusumi et al., 2012). Maximum (potential) gs refers to the state where all stomata are fully open, and can only be approximated under laboratory conditions (very low evaporative demand, low carbon dioxide concentration and high light intensity; Drake et al., 2013; Dow et al., 2014a). Under alternative conditions, operating gs is lower than maximum gs. However, maximum gs positively correlates with operating gs under relatively unstressed conditions (Franks et al., 2009; Dow et al., 2014a, b). Operating gs can be enhanced by increasing stomatal density, stomatal size or the percentage of pore area per stomatal area (stomatal area is the size of the guard cells and the pore). Increasing stomatal size generally promotes gs due to correspondingly larger pores, despite a small compensatory effect of pore depth, which reduces diffusion (Franks and Beerling, 2009). With regard to pore size, morphometric parameters such as pore area per stomatal area vary over a factor of 20 between species (Franks and Farquhar, 2007). However, the magnitude of variation within species is not known. To take advantage of genotypic variation, it is essential to investigate which stomatal traits are associated with maximizing operating gs.
At a given total (abaxial plus adaxial) pore area, gas exchange can be further improved by a more even pore area partitioning between the two leaf surfaces. In this way, mesophyll and leaf-to-atmosphere diffusion conductance may be increased (Parkhurst and Mott, 1990; Muir et al., 2014). To our knowledge, there are no studies that address and quantify whether gs partitioning among leaf sides is diverse within the gene pool of a particular crop species.
In this study, we utilized a population of Solanum lycopersicum × Solanum pennellii introgression lines (ILs) and the parents to assess variation in stomatal responsiveness to desiccation and gs-related anatomical traits. First, our aim was to relate stomatal closing ability to anatomical traits. Secondly, by using a modified version of the equation of Brown and Escombe (1900), we attempt to distinguish the main anatomical traits associated with genetic differences in operating gs, as well as the drivers of its partitioning among the leaf surfaces. Quantification of variation in stomatal features, regulating gas exchange, can inform future breeding efforts for improving plant performance.
MATERIALS AND METHODS
Plant material and growth conditions
Measurements were conducted on 54 ILs (see Supplementary Data Tables S1–S3) together with the parents, Solanum lycopersicum ‘M82’ and the highly drought-tolerant wild tomato species, Solanum pennellii LA716 (Eshed and Zamir, 1995; Xu et al., 2008). These ILs contain a single homozygous segment of S. pennellii DNA, the amount of which varies depending on the IL, in the background of S. lycopersicum. ILs with the format ILX-Y have the S. pennellii DNA segment (referred to as Y) in chromosome X. Seeds were sown in 2 L pots containing a mixture of peat and perlite (9:1, v/v; Meegaa substrates BV, Rotterdam, The Netherlands). Ten pots per IL were placed in a greenhouse, located in the central part of Denmark (Årslev, 55 °N). Plants were grown in the greenhouse up to the cotyledon stage (i.e. fully open cotyledons and before the appearance of the first leaf). Subsequently, six seedlings per IL were selected and placed in a walk-in growth chamber (MB-teknik, Brøndby, Denmark), at a density of 13·33 plants m−2. The chamber accommodated two tables, established as blocks, with every block having three randomly distributed pots of each IL. Air temperature (22·1 ± 0·9 °C) and relative air humidity (RH = 58 ± 5%) were kept constant, resulting in a vapour pressure deficit (VPD) of 0·97 ± 0·06 kPa. Light was provided by LED lamps (FL300 LED top-light 550 W, Fionia Lighting, Søndersø, Denmark) at 470 ± 20 μmol m−2 s−1 photosynthetic photon flux density (PPFD; determined by LI-250A, LI-COR, Lincoln, NE, USA) for 18 h d−1. Air temperature and RH were continuously measured by sensors [Humitter 50U/50Y(X), Vaisala, Helsinki, Finland] placed at 50 cm from the root–shoot interface (i.e. on the plant canopy), and data were automatically recorded by data loggers (Datataker, Thermo Fisher Scientific Australia Pty Ltd, Scoresby, Australia). Plants were fertigated twice a day (>20 % drainage per day), maintaining the substrate at retention capacity, and were cultivated in the growth chamber for 4 weeks. Following this period, the number of leaves of the IL population ranged from 6·2 to 22·7, and it was 10·0 ± 2·8 on average (values for each IL are given in Supplementary Table S1, together with shoot biomass). Stomatal features were assessed on fully expanded leaves receiving full PPFD. In all cases, the time between sampling and the start of the evaluation did not exceed 15 min.
Stomatal and pore anatomy
Stomatal features were assessed on both abaxial (lower) and adaxial (upper) leaf surfaces. Stomatal length (i.e. longest diameter), width (i.e. shortest diameter), (projected) area and density (i.e. number per unit leaf area), together with pore length (i.e. longest diameter), width (i.e. shortest diameter) and area were determined. Tomato has imparipinnate compound leaves (i.e. lateral leaflets in pairs, and a terminal leaflet). Measurements were conducted using the silicon rubber impression technique (Weyers and Johansen, 1985) on a lateral leaflet of the third leaf counting from the apex. Imprints were obtained from the middle portion of the lamina midway between the midrib and leaflet edge, as well as halfway between the leaflet base and tip. The impression material was held on the leaflet for 3 min. Following this period, a positive replica of the impression material was made by using nail varnish. Sampling took place 2 h following the onset of the light period, because this time is required for plants exposed to prolonged darkness to open their stomata and reach a steady-state operating gs (Drake et al., 2013). Images were acquired using an optical microscope (Leitz Aristoplan, Ernst Leitz Wetzlar GmbH, Wetzlar, Germany) connected to a digital camera (Nikon DXM-1200, Nikon Corp., Tokyo, Japan). For each leaflet, stomatal (length, width, area) and pore (length, width, area) anatomical features were determined on 60 randomly selected stomata using a magnification of ×1000. The employed oil immersion objective (×100) had a numerical aperture of 1·4. Stomatal size was defined as stomatal length multiplied by stomatal width (Franks and Beerling, 2009). Stomatal pore depth was considered to be equal to the guard cell width [i.e. (stomatal width – pore width)/2], based on the assumption that guard cells inflate to a circular cross-section (Franks and Farquhar, 2007; Franks and Beerling, 2009). Stomatal density was counted on five non-overlapping interveinal fields of view per leaflet (magnification of ×100; an example is shown in Supplementary Data Fig. S1). Image processing was performed with the UTHSCSA ImageTool program (University of Texas Health Science Centre, San Antonio, TX, USA). Four leaflets (one leaflet per plant) were assessed per genotype.
Computation of operating and maximum stomatal conductance (gs)
The cross-sectional area available for gas exchange is the product of the pore area and stomatal density. This product determines the gs for water vapour (and carbon dioxide). Operating and maximum gs (expressed in mmol H2O m−2 s−1) were calculated for both abaxial and adaxial leaf surfaces based on the following equation (after Franks and Farquhar, 2001):
| (1) |
For computing operating gs, (measured) pore area was employed, while (measured) pore width was used for estimating pore depth [(stomatal width – pore width)/2]. For computing maximum gs, pore area [π(stomatal length/4)2] and pore depth (stomatal width/2) were estimated based on stomatal size (Franks and Farquhar, 2007; Franks and Beerling, 2009). The former equation is based on the fact that pore length is approximately half of stomatal length (Franks and Beerling, 2009).
In both cases, the molar volume of air and the effective diffusion coefficient for water vapour in air used in the calculation were 0·024 m3 mol−1 and 2·43 × 10−5 m2 s−1, respectively, at 21 °C (Jones, 2014). The latter value was adjusted to account for molecular collisions with the pore walls (the so-called Knudsen diffusion). The weighting used was scaled linearly from 0·67 (at 0 mmol H2O m−2 s−1) to 0·90 (at 300 mmol H2O m−2 s−1 and thereafter) (Cowan and Milthorpe, 1968). The end correction [(π/2) × √(pore area/π)], used in the calculation of gs, introduces a small deviation from linearity in the relationship between gs and pore width (Kaiser, 2009). Calculations of gs were conducted for either leaf side in four leaflets, one leaflet per plant, for each IL. Leaf-level gs was taken as the gs sum of both leaf sides.
Calculated (based on anatomical parameters) and measured (by using porometer) operating gs are highly correlated (van Gardingen et al., 1989; Lawson et al., 1998). In this study, initial transpiration rate upon leaflet exposure to desiccation (described below), and operating gs were found to be significantly correlated (R2 = 0·33, P < 0·001; data not shown), validating the calculation of the latter.
Stomatal response to desiccation
Stomatal responsiveness was evaluated by exposing detached leaflets to dehydration. To avoid signals generated by circadian rhythmicity (Chen et al., 2012), leaflets were collected at the same time of the day (i.e. 2 h following the onset of the light period). Terminal rather than lateral leaflets were selected, since these have long petioles (>2 cm), facilitating both rehydration and handling. Fully expanded leaflets sampled from the third leaf (counting from the apex) were detached, re-cut while submerging their petiole under degassed water, and placed in flasks filled with degassed water. Leaflets were left at 21 °C, about 100 % RH (i.e. VPD close to 0) and under 15 μmol m−2 s−1 PPFD for 1 h to reach their saturated fresh weight (Fanourakis et al., 2012, 2013). Following rehydration, leaflets were placed on a net (similar boundary layer conditions on either leaf side) with the abaxial surface facing downwards, and the transpiration rate was assessed through gravimetric measurements every 20 min for 4 h (±0·0001 g; Mettler AE 200, Giessen, Germany). Test room conditions were: air temperature = 21·0 ± 1·2 °C, RH = 50 ± 4 % and PPFD = 50 μmol m−2 s−1 provided by fluorescent lamps (T5 fluorescent lamp, GE Lighting, Cleveland, OH, USA). As an indication of air velocity, the rate of evaporation from two glass beakers was recorded in the test room during measurements (Poorter et al., 2012). The evaporation rate of distilled water was 0·73 ± 0·01 mmol H2O m−2 s−1, indicating adequate air circulation. At the end of the test period, leaflet area (LI-COR Model Li-3100, LI-COR) and dry weight (24 h at 80 °C) were determined. The transpiration rate was computed by using the following equation (Aliniaeifard and van Meeteren, 2014):
| (2) |
The variables a, b, c and d correspond to transpiration rate, leaflet fresh weight, measurement frequency and leaflet area, respectively, while 18 is the molecular mass of H2O. Leaflet relative water content (RWC) was calculated, following Slavik (1974), as:
| (3) |
Stabilization RWC was defined as the RWC at which the transpiration rate stabilized, and was calculated as explained by Giday et al. (2013). In brief, the stable transpiration rate was defined as the average of the three consecutive points that do not significantly differ, while stabilization RWC was taken as the RWC where the first of these three points was noted. For each IL, measurements were carried out on six leaflets, one leaflet per plant.
Stomatal responsiveness to water stress was assessed in detached leaves. This approach offers a relatively short assessment period (5 h), as compared with exposing plants to (soil) water deprivation, which would require several days. Additionally, the leaf hydration level (i.e. RWC) at each measurement step can be determined, which is in any case a destructive measurement. However, it carries the dual pitfall of excluding root signals (e.g. abscisic acid, xylem sap pH), which would promote stomatal closure, as well as of imposing dehydration at a faster pace as compared with plants exposed to soil drying. It could also be argued that a rapid leaf hydration may hamper stomatal opening, owing to the mechanical advantage of the epidermis (Brodribb and Holbrook, 2006). This shortcoming was seized here by (1) collecting the leaves at a time where leaf water potential was relatively high; (2) placing the petiole underwater, immediately following excision (thus restoring the water supply); and (3) allowing 1 h to acclimate.
Statistical analyses
Data analysis was performed using the R software (version 2.14.2; www.r-project.org). Relationships between stomatal response characteristics and leaf weight loss, as well as between anatomical features and leaf weight loss or gs were assessed using linear regressions. To obtain a more precise quantification of the relative importance of each variable, we ran hierarchical partitioning of variance analysis using the hier.part package (http://CRAN.R-project.org/package=hier.part). This analytical method of multiple regression ranks the importance of each covariate in explaining the response variable independently of the remaining covariates (Mac Nally, 2000). This is achieved by effectively alleviating the effects of multicollinearity between the explanatory variables (Mac Nally, 2000). In this way, the hierarchical partitioning of variance analysis yields the independent contribution of each explanatory variable to the response variable separately from the joint contribution, resulting from correlation with other variables. The Z-score of each predictor variable, which quantifies the variables’ significance, was estimated using randomization test for hierarchical partitioning.
A statistical analysis was also performed on selected stomatal features to identify introgressions which potentially harbour quantitative trait loci (QTLs). Each observed IL phenotype was compared with the recurrent parent (S. lycopersicum ‘M82’), as this represents the majority of the genome present in each IL. The differences between the recurrent parent and the ILs can thus be attributed to the introgressed segment from the donor parent, S. pennellii. For each measured attribute, the ILs and the donor parent were tested against the recurrent parent using Dunnett’s test, as implemented in the R ‘multcomp’ package. Multiple test correction was performed using the default single-step method. P-values of 0·05, 0·01 and 0·001 were taken as the thresholds of significance.
RESULTS
Stomata, pore area and their distribution between the two leaf sides
Total stomatal density varied nearly 2-fold (170–323 mm−2) between ILs (values for each IL are given in Supplementary Data Table S2), and was independent of the distribution between the two leaf sides (data not shown). Stomata were evenly distributed on both leaf sides only in the wild parent (Fig. 1). In the elite line and the remaining ILs, stomata were denser (59–69 %) on the abaxial side.
Fig. 1.
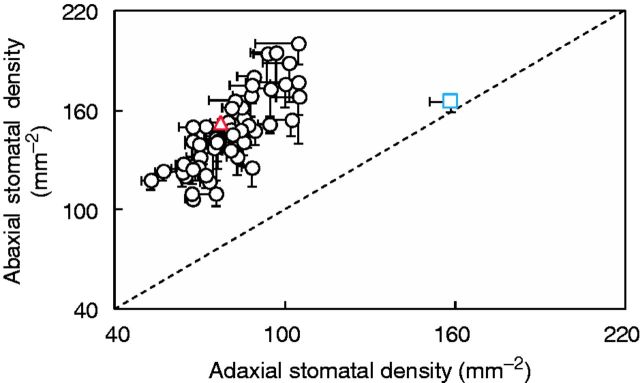
Stomatal density on abaxial vs. adaxial leaf sides in 54 introgression lines and the two parents, indicated by the coloured symbols (triangle, Solanum lycopersicum ‘M82’; square, Solanum pennellii LA716). Introgression lines above the 1:1 relationship showed higher values on the abaxial leaf side compared with the adaxial side. Data are means ± s.e.m. (n = 4).
A negative relationship between stomatal density and size was found (R2 ≤ 0·38; Fig. 2). This trend was more prominent on the adaxial than the abaxial leaf side (the slope was twice as steep; Fig. 2). Except for the wild parent, stomata were more rounded (i.e. 12–32 % lower length to width ratio) on the abaxial compared with the adaxial leaf side (Supplementary Data Fig. S2). Overall, larger stomata had larger pores but a large variability for this correlation was observed (Fig. 3A). Stomatal size was also significantly correlated with the pore area per stomatal area but with an R2 of 0·27 (Fig. 3B). Pore area per stomatal area varied by a factor of eight (2–16 %).
Fig. 2.
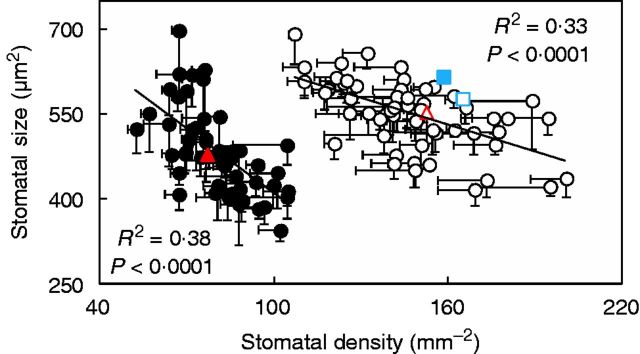
Stomatal size, the product of stomatal length and stomatal width, as a function of stomatal density of both adaxial (filled symbols) and abaxial (open symbols) leaf sides in 54 introgression lines and the two parents, indicated by the coloured symbols (triangle, Solanum lycopersicum ‘M82’; square, Solanum pennellii LA716). The lines represent the following regressions: y = −3·8031x + 791·69 (adaxial leaf side) and y = −1·5574x + 780·71 (abaxial leaf side), respectively. Linear regressions through log–log data were also highly significant (P < 0·001), yielding similar R2 (i.e. 0·39 and 0·33 for adaxial and abaxial leaf sides, respectively). Horizontal and vertical bars indicate the s.e.m. (n = 4).
Fig. 3.
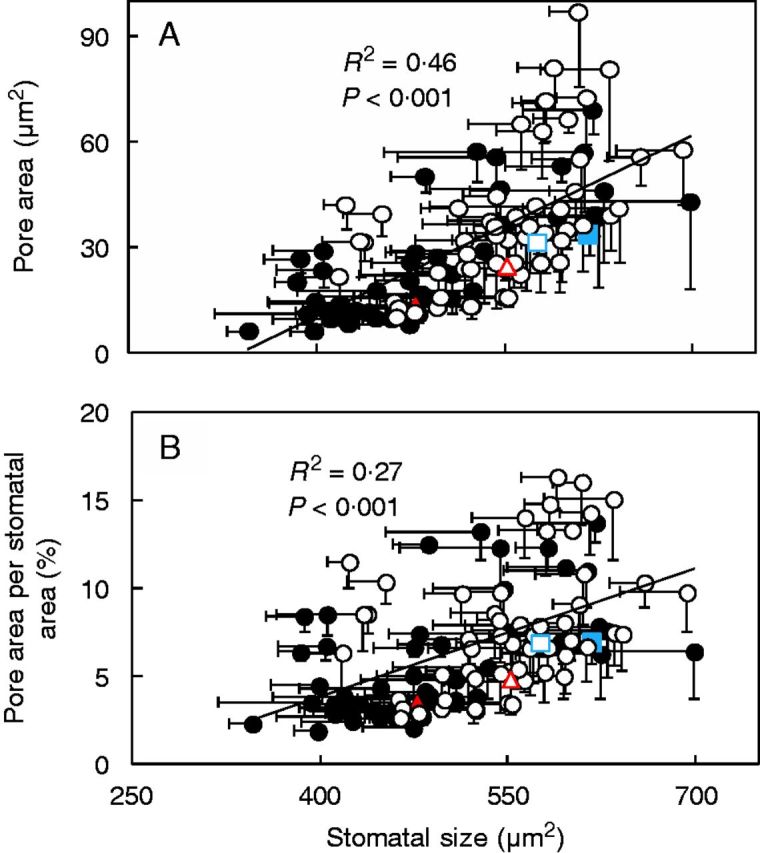
Pore area (A) and pore area per stomatal area (B) as a function of stomatal size of both adaxial (filled symbols) and abaxial (open symbols) leaf sides in 54 introgression lines and the two parents, indicated by the coloured symbols (triangle, Solanum lycopersicum ‘M82’; square, Solanum pennellii LA716). Stomatal area is the size of the guard cells and the pore. Stomatal size is the product of stomatal length and stomatal width. Sampling took place 2 h following the onset of the light period. The lines represent the following regressions: y = 0·1717x − 58·213 (A) and y = 0·0244x − 5·9876 (B), respectively. Horizontal and vertical bars indicate the s.e.m. (n = 4).
In 53 out of 56 genotypes, the stomatal pore area was larger (2–74 %) on the abaxial leaf surface compared with the adaxial surface (Fig. 4D; values for each IL are given in Supplementary Data Table S2). This pattern was driven by wider pore widths on the abaxial leaf side and not by differences in pore length, which was generally shorter (Fig. 4A, C). According to our calculation, the stomatal pore cavity was deeper (2–31 %) on the abaxial compared with the adaxial leaf side in 52 (out of 54) ILs but not in the wild parent (Fig. 4B).
Fig. 4.
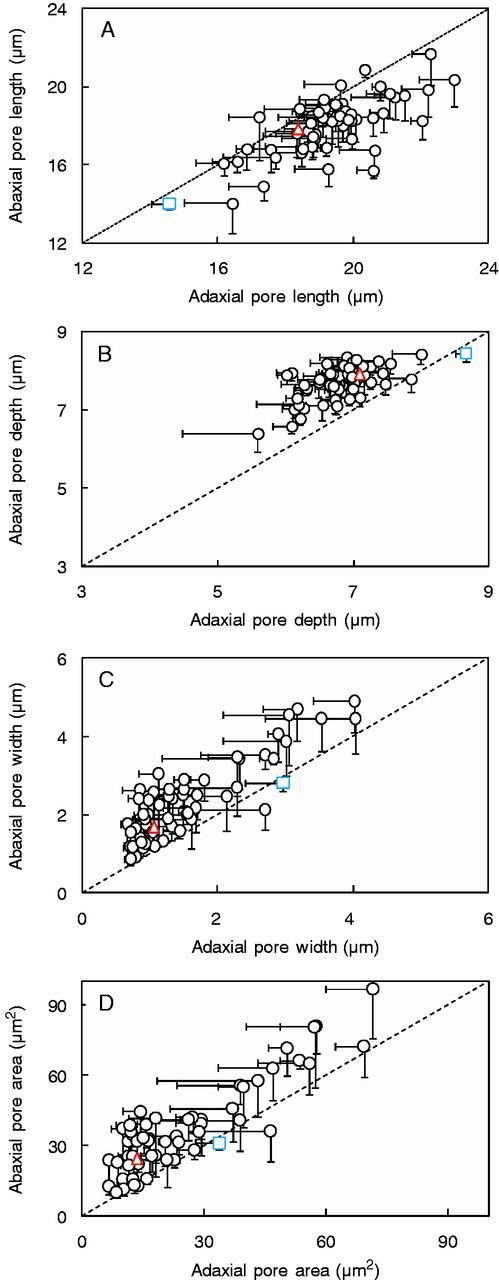
(A) Pore length, (B) depth [=(stomatal width – pore width)/2], (C) width and (D) area on abaxial vs. adaxial leaf sides in 54 introgression lines and the two parents, indicated by the coloured symbols (triangle, Solanum lycopersicum ‘M82’; square, Solanum pennellii LA716). Introgression lines above the 1:1 relationship showed higher values on the abaxial leaf side compared with the adaxial side, and vice versa for introgression lines below the line. Sampling took place 2 h following the onset of the light period. Data are means ± s.e.m. (n = 4).
Operating vs. maximum gs
Operating and maximum gs were computed (values for each IL are given in Supplementary Data Table S3). Pore dimensions (area and depth) were employed for estimating operating gs, whereas pore dimensions were calculated based on stomatal size in the maximum gs estimation. In all cases, operating gs was lower (45–91 %) than maximum gs (Supplementary Data Fig. S3C). The difference between operating and maximum gs was dependent on the leaf side (Fig. S3A, B). This difference was found to be more prominent on the adaxial leaf surface, as compared with the abaxial surface (−81 ± 1 vs. −70 ± 2 %, respectively; values for each IL are given in Table S3).
Operating gs and its partitioning between the two leaf sides
Total operating gs was strongly dependent on the IL, varying between as little as 198 to as much as 966 mmol m−2 s−1. The noted values refer to the experimental conditions of the current study, and will change depending on the ambient conditions. Critically, the ranking of the ILs may also alter, since their stomata may respond differently to changes in environmental conditions.
Operating gs was evenly partitioned between the two leaf surfaces in the wild parent (Fig. 5). In the 54 ILs and the elite line, operating gs was largely partitioned to the abaxial side (60–83 %), due to both higher stomatal density and larger pore areas on the abaxial side (Figs 1 and 4D). It appears that the negative effect of deeper pore cavities on gs of the abaxial compared with the adaxial leaf surface (Fig. 4B) was small.
Fig. 5.
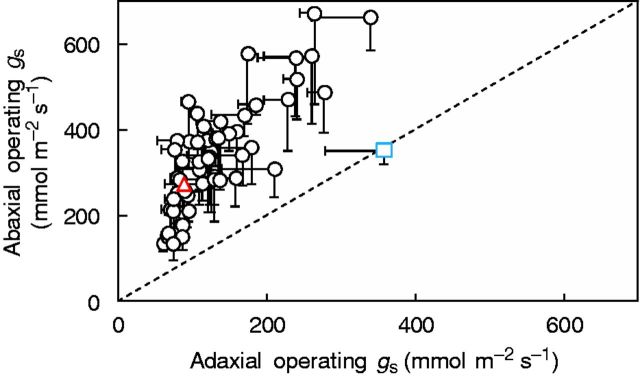
Operating stomatal conductance [gs; Eqn (1)] of abaxial vs. adaxial leaf sides in 54 introgression lines and the two parents, indicated by the coloured symbols (triangle, Solanum lycopersicum ‘M82’; square, Solanum pennellii LA716). Introgression lines above the 1:1 relationship showed higher values on the abaxial leaf side compared with the adaxial side. Sampling took place 2 h following the onset of the light period. Data are means ± s.e.m. (n = 4).
The contribution of total stomatal density, stomatal size and the pore area per stomatal area of either leaf side to the variation of operating gs between ILs was evaluated by using hierarchical partitioning of variance (Fig. 6). The analysis revealed that the pore area per stomatal area (see Fig. 3B) was the main determinant of genetic differences in operating gs, with stomatal density and size exerting a less important role.
Fig. 6.
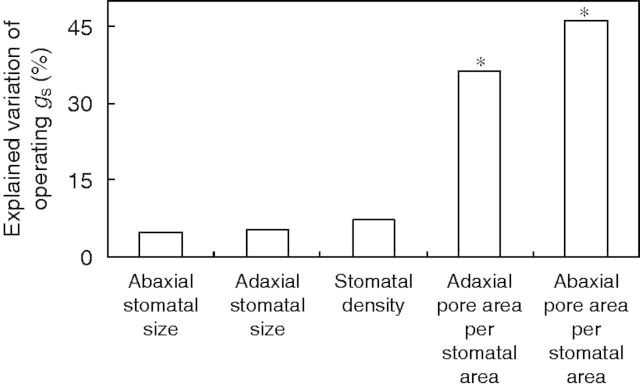
Percentage of the variation in the operating stomatal conductance (gs) explained independently by stomatal anatomical characteristics. These were total (abaxial plus adaxial) stomatal density, adaxial and abaxial stomatal size, as well as adaxial and abaxial pore area per stomatal area. Stomatal size is the product of stomatal length and stomatal width. Data include 54 introgression lines and the two parents (Solanum lycopersicum ‘M82’, Solanum pennellii LA716). Sampling took place 2 h following the onset of the light period. Significant independent contributions are indicated by asterisks (*P < 0·05).
Stomatal responsiveness to desiccation
The decrease in transpiration rate largely reflects the decline in pore widths, given the very low cuticular water loss of tomato leaves (Kimbara et al., 2012). Based on this background, genetic differences in the control of water loss were determined by exposing detached leaflets to desiccation. The transpiration rate decreased as leaflets dehydrated (i.e. with decreasing RWC; Supplementary Data Fig. S4). The sensitivity of the transpiration rate to dehydration strongly depended on IL identity (Fig. S4).
The leaflet hydration level at the end of the test period (i.e. RWC at 4 h) varied between 43 and 71 % among ILs (Supplementary Data Fig. S5). The three major components of water loss (stabilization RWC, transpiration rate at stabilization RWC and percentage change in transpiration) were significantly correlated with RWC at 4 h of desiccation between ILs (Fig. S5). The relationship between initial transpiration and RWC at 4 h of desiccation was highly significant (P < 0·0001), but weak (R2 = 0·28; data not shown). Hierarchical partitioning of variance indicated that the stabilization RWC as well as the transpiration rate at stabilization RWC were the most important determinants of leaflet weight loss, together accounting for 81 % of the observed variation (Fig. 7A).
Fig. 7.
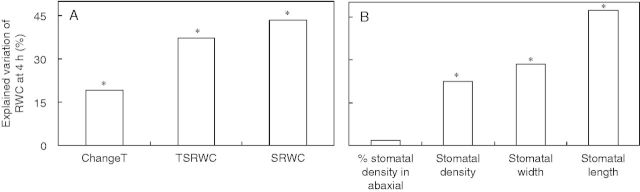
Percentage of the variation in the relative water content (RWC) at 4 h of desiccation explained independently by stomatal response (A) or anatomical (B) characteristics. The response characteristics are RWC of stabilization (SRWC), transpiration rate at stabilization RWC (TSRWC), and percentage of the change in the transpiration rate (stable relative to initial; ChangeT). The anatomical characteristics refer to total (abaxial plus adaxial) stomatal density, percentage of stomata situated on the abaxial leaf side, average (abaxial, adaxial) stomatal length and average stomatal width. Data include 54 introgression lines and the two parents (Solanum lycopersicum ‘M82’, Solanum pennellii LA716). Significant independent contributions are indicated by asterisks (*P < 0·05).
When examining the influence of stomatal anatomy on the RWC at 4 h of desiccation (taken as an indication of stomatal responsiveness), it was found that stomatal length exerted the most pronounced effect (47 %; Fig. 7B). Stomatal density and width effects were less prominent (Fig. 7B). The distribution of stomata on the two leaf surfaces was not related to leaflet weight loss (Fig. 7B).
QTL analysis
A QTL analysis for five functional and 13 anatomical traits of stomata was carried out (Table 1; Supplementary Dataset). We detected 64 QTLs in the ILs at a significance level <0·05 (Table 1; Supplementary Dataset). In some instances, a QTL was seen in the donor parent but not observed in any of the ILs. Conversely, QTLs found for traits in the ILs were not seen in the recurrent parent. All of the QTLs were in the direction towards S. pennellii apart from abaxial stomatal length in IL2-4. Neighbouring ILs were frequently found to harbour a QTL for the same trait. This could probably be due to the same underlying genomic region, as neighbouring ILs frequently have overlapping regions of their introgressions in common.
Table 1.
Overview of QTLs identified
| Genotype | Functional traits |
Anatomical traits† |
||||||||
|---|---|---|---|---|---|---|---|---|---|---|
| SRWC | TRSRWC | ChangeT | RWC4h | AdSL | AdPA/SA | AbPA/SA | Adgs | Abgs | Tgs | |
| 1-2 | ** | * | *** | * | ** | |||||
| 1-2-4 | ** | * | * | |||||||
| 1-4-18 | * | |||||||||
| 2-2 | * | |||||||||
| 2-3 | ** | * | *** | ** | * | |||||
| 2-4 | * | *** | ** | *** | * | |||||
| 2-5 | *** | * | ||||||||
| 2-6 | *** | * | ** | |||||||
| 2-6-5 | *** | ** | ** | * | * | |||||
| 3-1 | * | ** | *** | *** | * | |||||
| 4-1 | ** | * | ||||||||
| 4-3-2 | * | * | * | |||||||
| 5-2 | * | |||||||||
| 7-4 | * | * | ||||||||
| 7-5-5 | * | ** | * | * | ||||||
| 8-1 | * | * | ||||||||
| 8-2 | * | ** | ** | ** | ||||||
| 11-2-6 | * | ** | * | * | ||||||
| 12-1-1 | * | * | * | |||||||
| 12-3 | ** | * | ** | |||||||
| 12-3-1 | ** | * | ||||||||
| 12-4 | * | |||||||||
| LA716 | *** | |||||||||
SRWC, stabilization relative water content (%); TRSRWC, transpiration rate at stabilization RWC (mmol m−2 s−1); ChangeT, change in transpiration rate (stable relative to initial; %); RWC4h, RWC at 4 h (%); AdSL, adaxial stomatal length (µm); AdPA/SA, adaxial pore area per stomatal area (%); AbPA/SA, abaxial pore area per stomatal area (%); Adgs, adaxial gs (mmol m−2 s−1); Abgs, abaxial gs (mmol m−2 s−1); Tgs, total gs (mmol m−2 s−1).
*Significant at the 0·05 probability level; **significant at the 0·01 probability level; ***significant at the 0·001 probability level.
†The analysis was also carried out for (1) abaxial stomatal density (mm−2); (2) adaxial stomatal density (mm−2); (3) total stomatal density (mm−2); (4) percentage of stomata on the abaxial leaf side (%); (5) abaxial stomatal length (µm); (6) abaxial stomatal width (µm); and (7) adaxial stomatal width (µm), where lack of significance (P > 0·05) was found in the ILs (see Supplementary Dataset).
DISCUSSION
The anatomical features of stomata (i.e. density and pore dimensions), their distribution on the two leaf surfaces, as well as pore width regulation all influence operating gs. Here, our aim was to identify the main drivers of genetic variability in operating gs and its distribution between the two leaf sides, and to investigate links between functional and anatomical traits.
Functional and anatomical components of operating gs
Stomatal size sets the spatial limits of maximum pore area (Franks and Beerling, 2009), an ellipsis defined by pore length and width. Pore area is dynamically adjusted by changes in pore width, because pore length is rather rigid during opening and closure of stomata (Lawson et al., 1998). Maximum stomatal pore width can be approximated only under very low evaporative demand, low carbon dioxide concentration and high light intensity (Drake et al., 2013; Dow et al., 2014a). Across most environmental conditions, stomatal widths are narrower than maximum. Under the assumption that larger stomata have larger pores, maximum (potential) gs is frequently calculated by taking into account the stomatal (and not pore) size (Franks and Beerling, 2009; Milla et al., 2013). For instance, it is a typical approach of estimating gs in metadata analyses, where stomatal size is employed to approximate the unknown (unmeasured) pore dimensions.
In accordance with previous findings (Taylor et al., 2012; Giday et al., 2013), larger stomata generally had larger operating pore areas (Fig. 3A). However, stomata of the same size often showed 3 - to 4-fold differences in pore area. Therefore, maximum gs, computed based on stomatal size, is a very poor indicator of operating gs (estimated based on pore dimensions) even in relatively unstressed leaves held under well-controlled conditions (Supplementary Data Fig. S3C).
The mean operating/maximum gs ratio across all genotypes was 0·25 ± 0·01 (Supplementary Data Table S3), which may indicate that guard cells utilize only a small portion of their operating capacity. Interestingly, a similar operating/maximum gs ratio (i.e. approx. 0·2) was recently reported across Arabidopsis genotypes under typical ambient conditions (Dow et al., 2014a). The apparent conservation of this ratio at around 0·25 provides a powerful insight into how operating gs rates are calibrated against maximum gs. At this degree of stomatal opening, guard cells might be most effective in adjusting gs in response to changes in ambient conditions (Franks et al., 2012; Dow et al., 2014a).
Our results indicate that pore width, set by functional properties and ambient conditions, ranged between 5 and 28 % of stomatal width between ILs (Fig. 8B). This means that calculating pore width (or depth) based on stomatal width may deviate considerably from the measured value (Fig. 8B, C). This deviation may change depending on the prevailing conditions. Among ILs, pore length varied between 48 and 67 % of stomatal length (Fig. 8A). Therefore, a noticeable difference between calculated pore length (based on stomatal length) and the measured value is to be expected. In this way, this anatomical component contributes to the variation in the relationship between stomatal size and pore area. These results indicate that the difference between maximum and operating gs lies not only in the functional properties of stomata and the prevailing conditions (Franks et al., 2012; Dow et al., 2014a), but also in anatomical components of stomata.
Fig. 8.
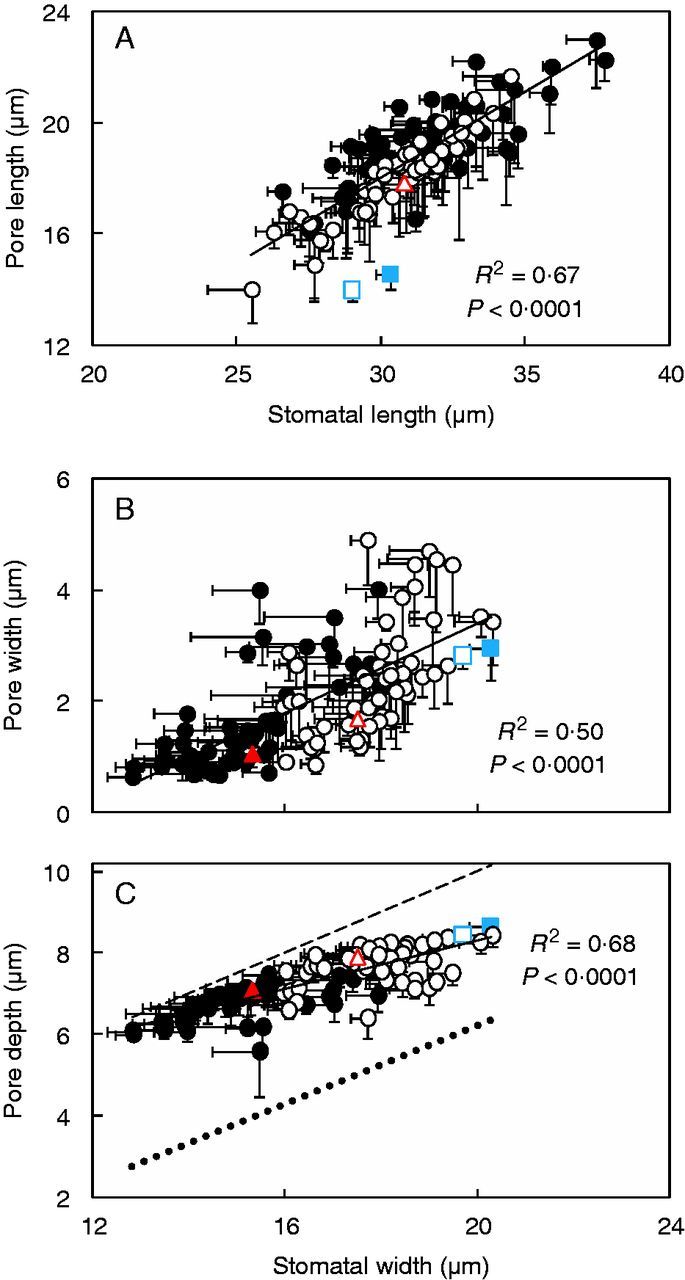
Pore dimensions as a function of stomatal size of both adaxial (filled symbols) and abaxial (open symbols) leaf sides in 54 introgression lines and the two parents, indicated by the coloured symbols (triangle, Solanum lycopersicum ‘M82’; square, Solanum pennellii LA716). The lines represent the following regressions: y = 0·6153x − 0·4432 (A), y = 0·4x − 4·6187 (B) and y = 0·3x + 2·3038 (C), respectively. In (C), the dashed line depicts the 1:2 relationship (i.e. pore depth = stomatal width/2). To facilitate comparisons, the end correction [summed with pore depth in the denominator of Eqn (1)] is provided as a dotted line (y = 0·4827x − 3·4287, R2 = 0·44; P < 0·0001) in (C). One (dotted) line was fitted in the whole data set (i.e. when calculated based on measured and estimated pore area), since the slopes of the two lines were not significantly different (P = 0·84). Imprints were conducted 2 h following the onset of the light period. Data are means ± s.e.m. (n = 4).
Pore area per stomatal area is a key element of genetic variation in operating gs, whereas stomatal density distribution mainly drives gs partitioning between leaf sides
A considerable variation in the pore area per stomatal area was detected (Fig. 3B). Differences in the pore area per stomatal area have only been noted between species exhibiting different stomatal morphologies (Franks and Farquhar, 2007). This trait was by far the most important in establishing operating gs differences between the 54 assessed ILs (Fig. 6). Therefore, selection for increased pore area per stomatal area, rather than for stomatal size or density, will facilitate breeding efforts towards enhanced operating gs.
Gas exchange is affected not only by operating gs, but also by its partitioning between the two leaf surfaces. More uniform gs partitioning among leaf sides favours carbon dioxide diffusion inside the leaf (Parkhurst and Mott, 1990; Muir et al., 2014), without affecting the rate of water loss (water-saturated air in the sub-stomatal cavities). However, even gs partitioning among leaf sides was noted only in the wild parent (Fig. 5). In the remaining ILs and the elite line, operating gs was mostly situated on the abaxial leaf side. It seems that an even gs partitioning remains an unexploited trait in tomato, which may lead to yield improvement, through its promoting effects on carbon dioxide intake.
Total gs partitioning is determined by stomatal density distribution and stomatal pore area at each leaf side (Ticha, 1982). Both stomatal density and pore area contributed to higher abaxial than adaxial gs (Figs 1 and 4D), with the former having a much more prominent effect in most (37 out of 55) of the assessed genotypes (data not shown). In all cases, most stomata (59–69 %) were situated on the abaxial leaf surface (Fig. 1). The only exception was the wild parent, showing even stomatal distribution (Fig. 1, and also described by Kebede et al., 1994; Koenig et al., 2013). These findings indicate that stomatal density distribution is a key trait affecting gs partitioning among leaf sides. The findings of Milla and co-authors (2013) hint in the same direction, by showing that domestication generally affected maximum gs partitioning among leaf sides via changes in stomatal density.
Anatomical traits partly explain variation in pore width regulation
The wild parent, originating from desert habitats, had stomata that were very responsive to desiccation (Supplementary Fig. S5, and also described by Kebede et al., 1994). In contrast to this, the elite line showed poor regulation of water loss, an indication that it was selected under favourable water environments. Incorporating enhanced stomatal responsiveness into cultivated varieties from wild germplasm may improve plant tolerance to limited water supply. Tighter pore opening regulation not only may minimize loss of water, conserving available resources, but also may prevent early onset of damaging water potentials during dry periods (Resco et al., 2009; Scoffoni et al., 2012; Giday et al., 2014; Sellin et al., 2014).
Stomatal density partly accounted for the variation in leaf weight loss, whereas stomatal distribution among the two leaf surfaces did not have any effect (Fig. 7B). However, the most relevant factor explaining genetic differences in leaf weight loss was stomatal length (Fig. 7B). A negative correlation between size and responsiveness of stomata has been proposed to occur both among and within species (Drake et al., 2013; Giday et al., 2013). The higher surface area to volume ratio of smaller stomata compared with that of larger stomata has been suggested to account for this response (Raven, 2014).
QTLs for functional and anatomical stomatal traits
The QTL analysis identified genetic regions which could be responsible for the observed traits. Notably, 21 from the 64 QTLs identified were located on chromosome 2 (Table 1). Given that there were many neighbouring ILs from chromosome 2 used in this study, it is likely that some of these traits have a common genetic background. This could also be true for neighbouring QTLs found on chromosomes 1 and 12, as these also share overlapping regions (Table 1). Our analysis did not identify the QTL for adaxial stomatal density in IL10-3 reported previously by Chitwood et al. (2013). This could be due to the different growth conditions between the two experiments, which has been shown to have a striking effect not only on the detection of a QTL, but also on the direction of the QTL effects (Gailing et al., 2008; Steinhauser et al., 2011). Our experiment was carried out in a controlled environment, while Chitwood et al. (2013) grew the plants in the field. We did however see a tendency in the same direction, but the robustness of the QTLs to various conditions would need to be confirmed. In most cases, QTLs were detected in the ILs but not the donor parent (S. pennellii). Previous studies have also reported up to 15 % of detected QTLs to be transgressive beyond the recurrent parent (Chitwood et al., 2013).
Our data show an association between anatomical (i.e. length) and functional (i.e. response to desiccation) features of stomata (Fig. 7B). We found only one QTL for stomatal length and several other QTLs for traits relevant to stomatal response to desiccation (Table 1). Overall, there was no common QTL between anatomical and functional stomatal features. These results highlight that anatomical features of stomata are likely to be controlled by different genes from those responsible for co-ordinating responses to water loss and desiccation. In other words, although there is a physiological association, there is no particular reason to expect that regulation of transpiration should overlap at the genetic network level with stomatal morphometric parameters. Control of water loss is probably dependent on genetic networks that regulate turgor and hydraulic conductivity at the cell and leaf level, whereas anatomical traits mostly depend on cell and tissue developmental pathways.
The identified QTLs for functional and anatomical stomatal traits could prove invaluable in improving the knowledge of how regulation of gas fluxes works under different growth scenarios. Narrowing down these QTLs to causal DNA regions will be greatly facilitated by the recently published genomes of both parents (Bolger et al., 2014).
Conclusions
Leaf conductance to water vapour is related to the size, density and distribution of stomata between the two leaf sides, as well as to pore area and pore width regulation. Here we evaluated the main determinants of genetic differences in operating gs and its partitioning to the leaf surfaces, and analysed causal links between those traits and stomatal sensitivity to desiccation. The ability of stomata to control water loss was partly explained by their length. Operating (based on pore dimensions) and maximum (based on stomatal dimensions) gs were very different (by 45–91 %) in non-stressed leaves maintained under stable conditions. Part of this discrepancy was explained by anatomical components. Operating gs ranged over a factor of five, with pore area per stomatal area, a thus far neglected parameter, primarily underlying gs differences between ILs. The partitioning of gs, however, was mainly driven by the distribution of stomata between the two leaf sides.
SUPPLEMENTARY DATA
Supplementary data are available online at www.aob.oxfordjournals.org and consist of the following. Table S1: shoot biomass and biomass allocation following 4 weeks of growth in 54 introgression lines and the two parents. Table S2: stomatal and pore anatomical features of both adaxial and abaxial leaf sides in the 54 introgression lines and the two parents. Table S3: operating and maximum stomatal conductance of both adaxial and abaxial leaf sides in the 54 introgression lines and the two parents. Figure S1: image taken from the adaxial epidermis of the introgression line 3-1. Figure S2: stomatal length to width ratio (indicative of shape) as a function of stomatal length of both adaxial and abaxial leaf sides in 54 introgression lines and the two parents. Figure S3: operating vs. maximum stomatal conductance in 54 introgression lines and the two parents. Figure S4: transpiration rate as a function of relative water content during leaflet desiccation of the two most extreme introgression lines with regard to stomatal responsiveness to desiccation. Figure S5: relative water content (RWC) of stabilization, transpiration rate at stabilization RWC and percentage of change in the transpiration rate (stable relative to initial) as a function of RWC at 4 h after leaflet desiccation in 54 introgression lines and the two parents. Dataset: P-values (obtained with QTL analysis) for selected stomatal features (referred to in Table 1).
ACKNOWLEDGEMENTS
The valuable comments of four anonymous reviewers are greatly acknowledged. This work was partly funded by the European Plant Phenotyping Network (EPPN-European Union FP7 Capacities Programme) through a post-doctoral grant to D.F. (grant agreement 284443), and by the GreenGrowing project through a doctoral fellowship to H.G. M.B was funded by the BMBF (FKZ 0315961).
LITERATURE CITED
- Ainsworth EA, Rogers A. 2007. The response of photosynthesis and stomatal conductance to rising [CO2]: mechanisms and environmental interactions. Plant, Cell and Environment 30: 258–270. [DOI] [PubMed] [Google Scholar]
- Aliniaeifard S, van Meeteren U. 2014. Natural variation in stomatal response to closing stimuli among Arabidopsis thaliana accessions after exposure to low VPD as a tool to recognize the mechanism of disturbed stomatal functioning. Journal of Experimental Botany. doi:10.1093/jxb/eru370. [DOI] [PMC free article] [PubMed] [Google Scholar]
- Berry JA, Beerling DJ, Franks PJ. 2010. Stomata: key players in the earth system, past and present. Current Opinion in Plant Biology 13: 233–240. [DOI] [PubMed] [Google Scholar]
- Bolger A, Scossa F, Bolger ME, et al. 2014. The genome of the stress-tolerant wild tomato species Solanum pennellii. Nature Genetics 46: 1034–1038. [DOI] [PMC free article] [PubMed] [Google Scholar]
- Brodribb TJ, Holbrook M. 2006. Declining hydraulic efficiency as transpiring leaves desiccate: two types of response. Plant, Cell and Environment 29: 2205–2215. [DOI] [PubMed] [Google Scholar]
- Brown HT, Escombe F. 1900. Static diffusion of gases and liquids in relation to the assimilation of carbon and translocation in plants. Philosophical Transactions of the Royal Society B: Biological Sciences 67: 124–128. [Google Scholar]
- Chen C, Xiao YG, Li X, Ni M. 2012. Light-regulated stomatal aperture in Arabidopsis. Molecular Plant 5: 566–572. [DOI] [PubMed] [Google Scholar]
- Chitwood DH, Kumar R, Headland LR, et al. 2013. A quantitative genetic basis for leaf morphology in a set of precisely defined tomato introgression lines. The Plant Cell 25: 2465–2481. [DOI] [PMC free article] [PubMed] [Google Scholar]
- Cowan IR, Milthorpe FL. 1968. Plant factors influencing the water status of plant tissues. In: TT Kozlowski, ed. Water deficits and plant growth, Vol. I New York: Academic Press, 137–193. [Google Scholar]
- Dow GJ, Bergmann DC, Berry JA. 2014a. An integrated model of stomatal development and leaf physiology. New Phytologist 201: 1218–1226. [DOI] [PubMed] [Google Scholar]
- Dow GJ, Berry JA, Bergmann DC. 2014b. The physiological importance of developmental mechanisms that enforce proper stomatal spacing in Arabidopsis thaliana. New Phytologist 201: 1205–1217. [DOI] [PubMed] [Google Scholar]
- Drake PL, Froend RH, Franks PJ. 2013. Smaller, faster stomata: scaling of stomatal size, rate of response, and stomatal conductance. Journal of Experimental Botany 64: 495–505. [DOI] [PMC free article] [PubMed] [Google Scholar]
- Eshed Y, Zamir D. 1995. An introgression line population of Lycopersicon pennellii in the cultivated tomato enables the identification and fine mapping of yield associated QTL. Genetics 141: 1147–1162. [DOI] [PMC free article] [PubMed] [Google Scholar]
- Fanourakis D, Carvalho SMP, Almeida DPF, van Kooten O, van Doorn WG, Heuvelink E. 2012. Postharvest water relations in cut rose cultivars with contrasting sensitivity to high relative air humidity during growth. Postharvest Biology and Technology 64: 64–73. [Google Scholar]
- Fanourakis D, Heuvelink E, Carvalho SMP. 2013. A comprehensive analysis of the physiological and anatomical components involved in higher water loss rates after leaf development at high humidity. Journal of Plant Physiology 170: 890–898. [DOI] [PubMed] [Google Scholar]
- Flexas J, Medrano H. 2002. Drought-inhibition of photosynthesis in C3 plants: stomatal and non-stomatal limitations revisited. Annals of Botany 89: 183–189. [DOI] [PMC free article] [PubMed] [Google Scholar]
- Franks PJ, Beerling DJ. 2009. Maximum leaf conductance driven by CO2 effects on stomatal size and density over geologic time. Proceedings of the National Academy of Sciences, USA 106: 10343–10347. [DOI] [PMC free article] [PubMed] [Google Scholar]
- Franks PJ, Farquhar GD. 2001. The effect of exogenous abscisic acid on stomatal development, stomatal mechanics, and leaf gas exchange in Tradescantia virginiana. Plant Physiology 125: 935–942. [DOI] [PMC free article] [PubMed] [Google Scholar]
- Franks PJ, Farquhar GD. 2007. The mechanical diversity of stomata and its significance in gas-exchange control. Plant Physiology 143: 78–87. [DOI] [PMC free article] [PubMed] [Google Scholar]
- Franks PJ, Drake PL, Beerling DJ. 2009. Plasticity in maximum stomatal conductance constrained by negative correlation between stomatal size and density: an analysis using Eucalyptus globulus. Plant, Cell and Environment 32: 1737–1748. [DOI] [PubMed] [Google Scholar]
- Franks PJ, Leitch IJ, Ruszala EM, Hetherington AM, Beerling DJ. 2012. Physiological framework for adaptation of stomata to CO2 from glacial to future concentrations. Philosophical Transactions of the Royal Society B: Biological Sciences 367: 537–546. [DOI] [PMC free article] [PubMed] [Google Scholar]
- Gailing O, Heyser RL, Polle A, Finkeldey R. 2008. Quantitative trait loci affecting stomatal density and growth in a Quercus robur progeny: implications for the adaptation to changing environments. Global Change Biology 14: 1934–1946. [Google Scholar]
- van Gardingen PR, Jeffree CE, Grace J. 1989. Variation in stomatal aperture in leaves of Avena fatua L. observed by low-temperature scanning electron microscopy. Plant, Cell and Environment 12: 887–898. [Google Scholar]
- Giday H, Kjaer KH, Fanourakis D, Ottosen CO. 2013. Smaller stomata require less severe leaf drying to close: A case study in Rosa hydrida. Journal of Plant Physiology 170: 1309–1316. [DOI] [PubMed] [Google Scholar]
- Giday H, Fanourakis D, Kjaer KH, Fomsgaard IS, Ottosen CO. 2014. Threshold response of stomatal closing ability to leaf abscisic acid concentration during growth. Journal of Experimental Botany 65: 4361–4370. [DOI] [PMC free article] [PubMed] [Google Scholar]
- Harrison MT, Tardieu F, Dong Z, Messina CD, Hammer GL. 2014. Characterizing drought stress and trait influence on maize yield under current and future conditions. Global Change Biology 20: 867–878. [DOI] [PubMed] [Google Scholar]
- Jones HG. 2014. Plants and microclimate: a quantitative approach to environmental plant physiology, 3rd edn. Cambridge: Cambridge University Press. [Google Scholar]
- Kaiser H. 2009. The relation between stomatal aperture and gas exchange under consideration of pore geometry and diffusional resistance in the mesophyll. Plant, Cell and Environment 32: 1091–1098. [DOI] [PubMed] [Google Scholar]
- Kebede H, Martin B, Nienhuis J, King G. 1994. Leaf anatomy of two Lycopersicon species with contrasting gas exchange properties. Crop Science 34: 108–113. [Google Scholar]
- Kimbara J, Yoshida M, Ito H, et al. 2012. A novel class of sticky peel and light green mutations causes cuticle deficiency in leaves and fruits of tomato (Solanum lycopersicum). Planta 236: 1559–1570. [DOI] [PubMed] [Google Scholar]
- Koenig D, Jiménez-Gómeza JM, Kimura S, et al. 2013. Comparative transcriptomics reveals patterns of selection in domesticated and wild tomato. Proceedings of the National Academy of Sciences, USA 110: 2655–2662. [DOI] [PMC free article] [PubMed] [Google Scholar]
- Kusumi K, Hirotsuka S, Kumamaru T, Iba K. 2012. Increased leaf photosynthesis caused by elevated stomatal conductance in a rice mutant deficient in SLAC1, a guard cell anion channel protein. Journal of Experimental Botany 63: 5635–5644. [DOI] [PMC free article] [PubMed] [Google Scholar]
- Lawson T, Blatt MR. 2014. Stomatal size, speed, and responsiveness impact on photosynthesis and water use efficiency. Plant Physiology 164: 1556–1570. [DOI] [PMC free article] [PubMed] [Google Scholar]
- Lawson T, James W, Weyers J. 1998. A surrogate measure of stomatal aperture. Journal of Experimental Botany 49: 1397–1403. [Google Scholar]
- Lawson T, Simkin AJ, Kelly G, Granot D. 2014. Mesophyll photosynthesis and guard cell metabolism impacts on stomatal behaviour. New Phytologist 203: 1064–1081. [DOI] [PubMed] [Google Scholar]
- Lu Z, Radin JW, Turcotte EL, Percy R, Zeiger E. 1994. High yields in advanced lines of Pima cotton are associated with higher stomatal conductance, reduced leaf area and lower leaf temperature. Physiologia Plantarum 92: 266–272. [Google Scholar]
- Mac Nally R. 2000. Regression and model-building in conservation biology, biogeography and ecology: the distinction between and reconciliation of ‘predictive’ and ‘explanatory’ models. Biodiversity and Conservation 9: 655–671. [Google Scholar]
- Martins SCV, Galmés J, Cavatte PC, Pereira LF, Ventrella MC, DaMatta FM. 2014. Understanding the low photosynthetic rates of sun and shade coffee leaves: bridging the gap on the relative roles of hydraulic, diffusive and biochemical constraints to photosynthesis. PLoS One 9: e95571. [DOI] [PMC free article] [PubMed] [Google Scholar]
- Meinzer FC. 1993. Stomatal control of transpiration . Trends in Ecology and Evolution 8: 289–294. [DOI] [PubMed] [Google Scholar]
- Milla R, de Diego-Vico N, Martín-Robles N. 2013. Shifts in stomatal traits following the domestication of plant species. Journal of Experimental Botany 64: 3137–3146. [DOI] [PubMed] [Google Scholar]
- Muir CD, Hangarter RP, Moyle LC, Davis PA. 2014. Morphological and anatomical determinants of mesophyll conductance in wild relatives of tomato (Solanum sect. Lycopersicon, sect. Lycopersicoides; Solanaceae). Plant, Cell and Environment 37: 1415–1426. [DOI] [PubMed] [Google Scholar]
- Parkhurst DF, Mott KA. 1990. Intercellular diffusion limits to CO2 uptake in leaves: studies in air and helox. Plant Physiology 94: 1024–1032. [DOI] [PMC free article] [PubMed] [Google Scholar]
- Pieruschka R, Huber G, Berry JA. 2010. Control of transpiration by radiation. Proceedings of the National Academy of Sciences, USA 107: 13372–13377. [DOI] [PMC free article] [PubMed] [Google Scholar]
- Poorter H, Fiorani F, Stitt M, et al. 2012. The art of growing plants for experimental purposes: a practical guide for the plant biologist. Functional Plant Biology 39: 821–838. [DOI] [PubMed] [Google Scholar]
- Price AH, Cairns JE, Horton P, Jones HG, Griffiths H. 2002. Linking drought-resistance mechanisms to drought avoidance in upland rice using a QTL approach: progress and new opportunities to integrate stomatal and mesophyll responses. Journal of Experimental Botany 53: 989–1004. [DOI] [PubMed] [Google Scholar]
- Radin JW, Lu Z, Percy RG, Zeiger E. 1994. Genetic variability for stomatal conductance in Pima cotton and its relation to improvements of heat adaptation. Proceedings of the National Academy of Sciences, USA 91: 7217–7221. [DOI] [PMC free article] [PubMed] [Google Scholar]
- Raven JA. 2014. Speedy small stomata? Journal of Experimental Botany 65: 1415–1424. [DOI] [PubMed] [Google Scholar]
- Resco V, Ewers BE, Sun W, Huxman TE, Weltzin JF, Williams DG. 2009. Drought-induced hydraulic limitations constrain leaf gas exchange recovery after precipitation pulses in the C3 woody legume, Prosopis velutina. New Phytologist 181: 672–682. [DOI] [PubMed] [Google Scholar]
- Rosegrant MW, Ringler C, Zhu T. 2009. Water for agriculture: maintaining food security under growing scarcity. Annual Review of Environment and Resources 34: 205–222. [Google Scholar]
- Scoffoni C, McKown AD, Rawls M, Sack L. 2012. Dynamics of leaf hydraulic conductance with water status: quantification and analysis of species differences under steady state. Journal of Experimental Botany 63: 643–658. [DOI] [PMC free article] [PubMed] [Google Scholar]
- Sellin A, Niglas A, Õunapuu-Pikas E, Kupper P. 2014. Rapid and long-term effects of water deficit on gas exchange and hydraulic conductance of silver birch trees grown under varying atmospheric humidity. BMC Plant Biology 14: 72. [DOI] [PMC free article] [PubMed] [Google Scholar]
- Skirycz A, Inze D. 2010. More from less: plant growth under limited water. Current Opinion in Biotechnology 21: 197–203. [DOI] [PubMed] [Google Scholar]
- Slavik B. 1974. Methods of studying plant water relations. London: Chapman and Hall. [Google Scholar]
- Steinhauser M-C, Steinhauser D, et al. 2011. Identification of enzyme activity quantitative trait loci in a Solanum lycopersicum × Solanum pennellii introgression line population. Plant Physiology 157: 998–1014. [DOI] [PMC free article] [PubMed] [Google Scholar]
- Tardieu F. 2011. Any trait or trait-related allele can confer drought tolerance: just design the right drought scenario. Journal of Experimental Botany 63: 25–31. [DOI] [PubMed] [Google Scholar]
- Taylor SH, Franks PJ, Hulme SP, et al. 2012. Photosynthetic pathway and ecological adaptation explain stomatal trait diversity amongst grasses. New Phytologist 193: 387–396. [DOI] [PubMed] [Google Scholar]
- Ticha I. 1982. Photosynthetic characteristics during ontogenesis of leaves, VII. Stomata density and sizes. Photosynthetica 16: 375–471. [Google Scholar]
- Tuberosa R. 2012. Phenotyping for drought tolerance of crops in the genomics era. Frontiers in Physiology 3: 347. [DOI] [PMC free article] [PubMed] [Google Scholar]
- Weyers JD, Johansen LG. 1985. Accurate estimation of stomatal aperture from silicone rubber impressions. New Phytologist 101: 109–115. [DOI] [PubMed] [Google Scholar]
- Xu X, Martin B, Comstock JP, et al. 2008. Fine mapping a QTL for carbon isotope composition in tomato. Theoretical and Applied Genetics 117: 221–233. [DOI] [PubMed] [Google Scholar]
Associated Data
This section collects any data citations, data availability statements, or supplementary materials included in this article.