

Abstract
Background and Aims Apomixis in plants generates clonal progeny with a maternal genotype through asexual seed formation. Hieracium subgenus Pilosella (Asteraceae) contains polyploid, highly heterozygous apomictic and sexual species. Within apomictic Hieracium, dominant genetic loci independently regulate the qualitative developmental components of apomixis. In H. praealtum, LOSS OF APOMEIOSIS (LOA) enables formation of embryo sacs without meiosis and LOSS OF PARTHENOGENESIS (LOP) enables fertilization-independent seed formation. A locus required for fertilization-independent endosperm formation (AutE) has been identified in H. piloselloides. Additional quantitative loci appear to influence the penetrance of the qualitative loci, although the controlling genes remain unknown. This study aimed to develop the first genetic linkage maps for sexual and apomictic Hieracium species using simple sequence repeat (SSR) markers derived from expressed transcripts within the developing ovaries.
Methods RNA from microdissected Hieracium ovule cell types and ovaries was sequenced and SSRs were identified. Two different F1 mapping populations were created to overcome difficulties associated with genome complexity and asexual reproduction. SSR markers were analysed within each mapping population to generate draft linkage maps for apomictic and sexual Hieracium species.
Key Results A collection of 14 684 Hieracium expressed SSR markers were developed and linkage maps were constructed for Hieracium species using a subset of the SSR markers. Both the LOA and LOP loci were successfully assigned to linkage groups; however, AutE could not be mapped using the current populations. Comparisons with lettuce (Lactuca sativa) revealed partial macrosynteny between the two Asteraceae species.
Conclusions A collection of SSR markers and draft linkage maps were developed for two apomictic and one sexual Hieracium species. These maps will support cloning of controlling genes at LOA and LOP loci in Hieracium and should also assist with identification of quantitative loci that affect the expressivity of apomixis. Future work will focus on mapping AutE using alternative populations.
Keywords: Hieracium, Pilosella, apomixis, apospory, parthenogenesis, linkage map, molecular markers, SSR, LOSS OF APOMEIOSIS, LOA, LOSS OF PARTHENOGENESIS, LOP
INTRODUCTION
Apomixis is the process by which flowering plants propagate asexually through seed, thereby producing genetically identical progeny with a maternal genotype. There are over 400 apomictic species in 35 families, ∼75 % of these species belong to the eudicotyledonous Asteraceae and Rosaceae and the monocotyledonous Poaceae, but apomixis is largely absent in crop species (Carman, 1997). Transferring apomixis into major crops for use as a technology in plant breeding has long been sought as a means of fixing desirable traits such as heterosis, and to increase the efficiency of delivering new agricultural crops. Attempts to introgress apomixis into crops through wide crosses have been largely unsuccessful (Pupilli and Barcaccia, 2012). Biotechnology has the potential to engineer apomixis into a wide range of sexual crop species but requires a thorough understanding of the molecular mechanisms underlying apomixis in plants. This requires isolation and characterization of the genetic elements that facilitate apomixis. No apomixis genes have yet been identified, although dominant apomixis loci have been defined in many apomictic species (Ozias-Akins and Van Dijk, 2007).
Species of Hieracium subgenus Pilosella (Asteraceae) consist of sexually reproducing diploid and polyploid species, and apomictic species that are almost invariably polyploid. However, diploid Hieracium subgenus Pilosella apomicts have been generated under experimental conditions (Bicknell, 1997; Bicknell et al., 2003). Three developmental components facilitate apomictic seed formation in Hieracium ovules. The first component is the formation of a chromosomally unreduced female gametophyte (embryo sac) solely by mitosis, without prior meiosis. In a process known as apospory, the unreduced embryo sac forms from an aposporous initial (AI) cell, which differentiates close to cells undergoing meiosis and megaspore selection, soon after sexual reproduction has initiated. The formation of the aposporous embryo sac results in the demise of the sexually derived cells (Koltunow et al., 2011b). The second and third components of apomixis are the fertilization-independent formation of an embryo from the diploid egg in the embryo sac (parthenogenesis) and fertilization-independent (autonomous) endosperm formation, which collectively enable viable seed development without fertilization (Koltunow et al., 2011b; Ogawa et al., 2013).
Two independent dominant loci controlling apomixis were identified in a deletion mutagenesis study of the Hieracium subgenus Pilosella species Hieracium praealtum (aneuploid isolate R35). The LOSS OF APOMEIOSIS (LOA) locus regulates apospory and suppresses the sexual pathway whilst the LOSS OF PARTHENOGENESIS (LOP) locus facilitates both fertilization-independent embryogenesis and endosperm formation in this isolate (Catanach et al., 2006). Deletion of both LOA and LOP loci in R35 results in complete reversion to sexual reproduction, demonstrating that apomixis is superimposed over a functional sexual reproductive pathway (Koltunow et al., 2011b). A recent study involving crosses between sexual and apomictic Hieracium subgenus Pilosella species outside of the R35 apomictic background has led to the genetic uncoupling of autonomous endosperm (AutE) formation from both apospory and fertilization-independent embryo formation (Ogawa et al., 2013). Therefore, the tight linkage of the two qualitative components controlling fertilization-independent seed formation appears to be species-dependent.
Apomictic Hieracium subgenus Pilosella species are described as facultative for apomixis because a small proportion of progeny are still derived via the sexual pathway (Bicknell and Koltunow, 2004; Hand et al., 2014). These sexually derived progeny form after instances of failure of the AI cell to differentiate in an ovule, allowing a chromosomally reduced embryo sac to form via the meiotic route. Subsequent seed formation may or may not require fertilization, depending on whether the components for autonomous seed formation have been inherited in the embryo sac (Koltunow et al., 2011a, b). Fertilization-independent development of progeny from meiotically derived eggs results in a reduction in ploidy relative to the apomict parent; these progeny are termed polyhaploids. Conversely, eggs formed in aposporous embryo sacs can also be fertilized by sperm cells from a compatible species, which results in progeny with higher ploidy relative to the maternal parent (Bicknell et al., 2003). Although the qualitative components of apomixis are conferred by single dominant loci, variability in the penetrance, frequency and temporal–spatial occurrence of apomictic events is modulated by additional, unlinked genetic factors. Plant hormones and ovule development pathways also appear to play a role (Koltunow et al., 2000, 2011b; Tucker et al., 2012; Kotani et al., 2014).
The LOA locus has been the most extensively studied of the three qualitative loci known to regulate apomixis in Hieracium. Sequence-characterized amplified region (SCAR) markers linked to the LOA locus were used to identify genomic sequences within an R35 bacterial artificial chromosome (BAC) library, and chromosome walking has extended these sequences to generate two separate contigs (contigs A and B) of ∼2 Mb that flank the LOA locus (Catanach et al., 2006; Okada et al., 2011; Kotani et al., 2014). Contig sequence and fluorescence in situ hybridization (FISH) analyses indicated that the LOA region is gene-poor, subtelomeric and surrounded by an extensive hemizygous repeat region in R35. These analyses also suggest that the LOA locus is likely to be conserved in other Hieracium subgenus Pilosella species, including tetraploid Hieracium piloselloides (D36) (Okada et al., 2011). Markers linked to the LOP locus region in R35 have also been generated, although markers linked to AutE remain to be identified and the chromosomal locations of these loci are yet to be determined (Catanach et al., 2006; Koltunow et al., 2011b; Ogawa et al., 2013). The majority of apomixis loci in other apomictic plants exhibit suppressed recombination, which has hindered the positional cloning of these loci (Ozias-Akins and Van Dijk, 2007). Analyses of LOA-linked markers in F1 hybrids derived from crossing various Hieracium subgenus Pilosella species has shown that recombinantion occurs at the LOA locus, albeit at low levels, and demonstrates that map-based cloning is a viable strategy for identifying apomixis loci in Hieracium (Okada et al., 2011).
A collection of molecular markers and a whole-genome linkage map would facilitate mapping of the qualitative and quantitative loci that control or modulate apomixis in Hieracium. Few whole-genome linkage maps have been constructed for apomictic species (Ortiz et al., 2001; Stein et al., 2007). Genic markers are ideal for the construction of linkage maps as they have higher rates of transferability than genomic markers and theoretically increase the likelihood of identifying causal genes when mapping traits. Simple sequence repeat (SSR) markers are desirable for plant genetic analyses, given their multi-allelic nature, co-dominant inheritance and wide genome distribution. Most informative are expressed-sequenced tagged (EST) SSRs or transcript SSRs, which are derived from transcripts and therefore potentially functionally relevant to the traits of interest (Park et al., 2005). For an apomictic species, transcripts influencing the events of apomixis are highly likely to be present within the ovule during stages of chromosomally unreduced embryo sac development and fertilization-independent seed formation during the transition from ovule to seed.
As linkage mapping is dependent upon meiotic events that are typically obtained through a cross, the generation of a mapping population involving an apomictic species is complicated by the clonal nature of reproduction, which proceeds without meiosis. However, if the apomict produces viable meiotically reduced pollen, as occurs in Hieracium subgenus Pilosella species, crosses are possible using the apomict as a pollen donor and a sexual plant as the maternal parent. This system has successfully been used in Hieracium to generate interspecific mapping populations, even though recombination occurs at low levels at the LOA and LOP loci (Okada et al., 2011; Ogawa et al., 2013).
An alternative way to enrich for recombination in apomictic Hieracium is to positively select for the rare progeny derived from meiosis. Bicknell et al. (2003) have previously developed recombinant Hieracium polyhaploid populations following the transgenic introduction of the cytosine deaminase (codA) selectable marker gene into an apomict. Apomictically derived seeds containing codA are unable to survive following germination on media containing 5-fluorocytosine (5-FC) as it is converted to the cytotoxic 5-fluorouracil (5-FU) by the transgene (Stougaard, 1993; Bicknell et al., 2003). Polyhaploid progeny that lose codA via meiosis and retain the capacity for fertilization-independent seed will grow on 5-FC, selecting for intraspecific meiotically derived progeny with the potential for recombination at apomixis loci (Bicknell et al., 2003; Fig. 1).
Fig. 1.

Generation of the polyhaploid progeny from unfertilized apomict H. praealtum (isolate R35). R35 transformed with the negative selection codA marker forms seed via parthenogenesis of an egg cell. In most instances (∼99 %), the egg cell and resulting embryo will be chromosomally unreduced (2n) due to the absence of meiosis and fertilization and retains the genotype of the maternal parent (apomixis pathway). A fraction of the seed will be formed by parthenogenetic development of a meiotically derived egg cell that is chromosomally reduced (n) and the codA gene will segregate in the progeny. The codA-mediated conversion of 5-fluorocytosine (5-FC) to cytotoxic 5-fluorouracil (5-FU) ensures that only seeds without the codA transgene will survive when grown on medium containing 5-FC. Therefore, only meiotically derived progeny are selected for the mapping population. The LOA locus segregates in the surviving seed (represented by ‘? LOA’). All polyhaploid seed will contain LOP, as this locus encodes both parthenogenesis and endosperm formation components in the R35 background. LOA, LOSS OF APOMEIOSIS; LOP, LOSS OF PARTHENOGENESIS.
Here we generated a collection of 14 684 Hieracium SSR markers from transcripts isolated from ovule-specific cell types and assayed them in both a traditional genetic cross and a polyhaploid population. We have constructed the first genetic linkage maps for apomictic and sexual Hieracium species. The linkage maps produced in this work provide a valuable resource for the identification of apomixis loci as well as quantitative trait loci that modify the penetrance of apomixis in apomictic and sexual backgrounds.
MATERIALS AND METHODS
Plant materials and growth conditions
Four Hieracium subgenus Pilosella accessions were used in this study: aneuploid apomict H. aurantiacum A35 (4x − 1 = 35); tetraploid apomict H. piloselloides D36 (4x = 2n = 36); aneuploid apomict H. praealtum R35 (4x − 1 = 35); and tetraploid sexual H. pilosella P36 (4x = 2n = 36). Plants were maintained vegetatively by micropropagation in culture and later transferred to soil to permit flowering (Koltunow et al., 1998).
Isolation of ovule tissue
Enlarging AI cells with undivided nuclei, early aposporous embryo sacs containing two to four nuclei and random groups of sporophytic ovule cells not undergoing these events were previously isolated from R35 by laser capture microdissection (Okada et al., 2013). Embryo sacs were also hand-dissected from two γ-deletion mutants (m115 and m138) derived from R35 at stage 8 of capitulum development (Koltunow et al., 1998). Mutant m115 was a phenotypically sexual plant, having lost both LOA and LOP loci. Mutant m138 retained LOA but lost LOP and formed chromosomally unreduced aposporous embryo sacs (Koltunow et al., 2011b). The embryo sacs were hand-dissected from m115 (n = 5) and m138 (n = 24) ovules in 8 % mannitol under an inverted Olympus CK2 microscope using two BD Ultra-fine II insulin syringes (for example images see Koltunow et al., 2011a). Dissected embryo sacs were frozen in PicoPure RNA extraction buffer (Life Technologies).
RNA isolation and sequencing
RNA from laser capture micro-dissected cells was obtained previously by Okada et al. (2013). RNA was extracted from hand-dissected embryo sacs and amplified as described by Okada et al. (2013). RNA sequencing was performed by the Australian Genome Research Facility using the Illumina HiSeq2000. Raw 100-base-pair Illumina sequences were processed for quality and trimmed using a custom C script. Raw sequences were trimmed for library adapter sequences, low quality (as denoted by low Illumina Phred score) and ambiguous bases (N calls) using a custom C script. Trimmed sequences with <70 bases were discarded. Quality Illumina reads were assembled to contigs using ABySS (Birol et al., 2009) across a range of six different k-mer values (k = 26, 29, 32, 35, 38, 41) and k = 35 was selected to maximize the N50 contig size. Contigs were further clustered and merged using the CLC Bio Genomics Workbench version 4.6 to generate non-redundant reference contigs of Hieracium ovule cells. The transcriptome sequence data of isolated Hieracium ovule cells will be released as part of an additional study that is currently in preparation for publication.
Development of SSR markers, SCAR markers and genotyping of mapping populations
Assembled contigs were analysed for SSRs, and primers were designed from the flanking sequences of di-, tri- or tetra-nucleotide SSR motifs. SSR identification and primer design were performed as described previously (Shirasawa et al., 2010). SSRs were assessed for polymorphism by amplification from four Hieracium subgenus Pilosella accessions: R35, D36, P36 and A35. PCR and subsequent polyacrylamide gel electrophoresis analyses were performed as described in Shirasawa et al. (2010). DNA isolation, oligonucleotide sequences and PCR conditions (Supplementary Data Table S1) used to assay SCAR markers linked to the LOA and LOP loci and to test for the presence of the codA transgene were as described previously (Koltunow et al., 2011b; Okada et al., 2011; Ogawa et al., 2013). Oligonucleotide sequences for all SSR markers designed in this study are provided in Supplementary Data Table S2.
Generation of mapping populations
Two mapping populations were generated for genetic linkage analyses. First, a P36 × D36 two-way pseudo-testcross population was generated by crossing two heterozygous individuals: sexual P36 as the maternal parent and apomict D36 as the pollen donor. The total population consisted of 952 individuals and each plant was initially screened with four LOA-linked SCAR markers (4-T7, LOA267, 21-T7 and LOA275). A total of 95 individuals were then selected for linkage mapping based on their LOA marker genotype and consisted of 54 and 42 plants with the LOA-linked SCAR markers present and absent, respectively. The development of a P36 × D36 linkage map was undertaken as the autonomous endosperm (AutE) locus was uncoupled from fertilization-independent embryo formation and LOA using this cross (Ogawa et al., 2013). A genetic linkage map of D36 may therefore also be useful for the future mapping of the AutE locus.
Second, an R35 polyhaploid mapping population was generated by growing 136 121 seeds from a transgenic R35 parent line containing the codA negative selectable marker, unlinked to either LOA and LOP, on medium containing 200 mg/L of 5-FC. Deamination of the non-toxic 5-FC substrate to cytotoxic 5-FU by the codA transgene enabled negative selection against the prevalent apomictic progeny and isolation of the meiotically derived progeny without codA as previously described (Bicknell et al., 2003). This screen recovered 466 progeny that had lost the codA marker during meiosis and 95 of these were utilized for linkage mapping. As with the P36 × D36 population, the final selection of plants was based on LOA genotype and consisted of 45 plants that contained all the LOA-linked markers, 44 plants with no LOA-linked markers and six plants that were recombinant between LOA-linked contigs A and B.
Construction of genetic linkage maps
The SSR marker genotypes of each sample were scored with the Polyans program (http://www.kazusa.or.jp/polyans). Linkage analysis of segregated genotypic data obtained in this study was performed using JoinMap version 4 (Van Ooijen, 2006), in which genotype codes of the ‘CP’ and ‘HAP’ of the JoinMap program were used for the P36 × D36 and R35 polyhaploid mapping populations, respectively. The loci were roughly classified using the JoinMap Grouping Module with logarithm of the odds (LOD) scores of 4·0–10·0. Marker order and genetic distance were calculated using a regression mapping algorithm with the following parameters: Haldane’s mapping function, recombination frequency ≤0·30 and LOD score ≥2·0. The graphical linkage maps were drawn using MapChart (Voorrips, 2002). The SSRs that detected multiple loci were used to define homoeologous linkage groups within the tetraploid map. Linkage groups with three or more homoeoalleles from a single SSR were deemed to be homoeologous groups. Analysis of SSR amplicon size dissimilarities between R35, D36, A35 and P36 species was performed with a correlation-based dissimilarity matrix using the pvclust package (Suzuki and Shimodaira, 2006) for R software (http://www.r-project.org).
Cytological phenotyping
In order to validate the linkage maps, the apospory (LOA) and autonomous seed development (LOP) phenotypes were determined for a subset of progeny and mapped on the linkage maps. These two phenotypes were determined using cytological methods and capitulum stages described previously (Koltunow et al., 1998, 2011b). Specifically, the LOA phenotype was determined by formation of AI cells at stage 4 of capitulum development and the LOP phenotype was identified by the presence of embryos and endosperm at stage 10. A minimum of 80 ovules from unpollinated florets obtained from five different capitula per plant were scored at each stage. Phenotyping was performed for 38 and 42 progeny of the P36 × D36 and R35 polyhaploid linkage mapping populations, respectively. The LOA and LOP phenotypes were scored as qualitative traits (presence or absence) and were mapped using the same methods as described for the SSR and SCAR marker loci.
Analysis of macrosynteny between Hieracium and related species
The R35 transcript contigs used to develop the SSR markers were analysed to identify potential macrosynteny with the genomes of lettuce (Lactuca sativa), sunflower (Helianthus annuus), tomato (Solanum lycopersicum) and Arabidopsis thaliana. TBLASTX was used to compare the nucleotide sequences of R35 transcripts with the nucleotide sequences of DNA markers mapped on each linkage group of genetic maps for lettuce and sunflower (Bowers et al., 2012; Truco et al., 2013). A threshold e-value of 1e–05 was used for the TBLASTX searches. Syntenic linkage groups were identified when more than a third of the BLAST-identified orthologues for a given Hieracium linkage group originated from a single lettuce or sunflower linkage group. Only linkage groups with ≥15 orthologues were considered in the synteny analysis. Syntenic linkage groups were drawn using MapChart (Voorrips, 2002).
BLASTX with a threshold e-value of 1e–10 was used to identify similarities between predicted amino acid sequences of the Hieracium transcripts and protein sequences encoded by the Arabidopsis and tomato genomes (The Arabidopsis Genome Initiative, 2000; The Tomato Genome Consortium, 2012). A synteny block was defined as a region where three or more conserved homologues were located within a 20-cM region in the R35 linkage map and a 20-Mb DNA stretch in the Arabidopsis or tomato genome.
RESULTS
Transmission of apomixis-linked markers
Two mapping populations were generated and subsets of each population were utilized for the development of Hieracium genetic linkage maps to facilitate mapping of apomixis loci. Preliminary screening of the P36 × D36 mapping population with four LOA-linked SCAR markers indicated 20·1 and 79·9 % of progeny contained the majority or none of the LOA-linked SCAR markers, respectively. The reduced transmission frequency of LOA-linked SCAR markers is consistent with previous observations of segregation distortion of the LOA locus in Hieracium (Catanach et al., 2006; Okada et al., 2011). Preliminary marker analysis of 412 polyhaploid R35 progeny with four LOA-linked SCAR markers indicated that 42 % of the plants had all four LOA-linked SCAR markers tested, 56·6 % plants had none of the SCAR markers and 1·4 % were recombinant between LOA-linked SCAR markers in contigs A and B. The segregation of these LOA-linked markers in the polyhaploid progeny indicated they were meiotically derived and confirmed the suitability of this population for mapping the LOA locus.
Within the P36 × D36 mapping population, linkage analysis of phenotyped progeny confirmed the LOA and LOP SCAR markers derived from R35 were linked to the apospory and autonomous seed development traits in the D36 background, with the sole exception of the LOP278 SCAR marker, which showed no significant linkage to autonomous seed development (data not shown). Sequencing of the LOP278 PCR amplicon in the D36 parent indicated that this marker amplified multiple loci in this species and the LOP278 SCAR marker was consequently excluded from subsequent analyses. The conservation of most LOA and LOP markers linked to the apospory and autonomous seed development traits in both R35 and D36 suggested that the LOA and LOP loci were likely to be present in D36, and is consistent with previous results (Okada et al., 2011).
All R35 polyhaploids were expected to contain the LOP locus as the generation of polyhaploid seeds without crossing requires the apomixis component of autonomous seed development. The presence of LOP in the polyhaploid mapping population was supported by amplification of the LOP93 SCAR marker in each of the 95 progeny, but the absence of LOP segregation precludes the use of this population for the mapping of the LOP locus. PCR analysis of the R35 polyhaploid linkage mapping population also revealed that two apomictic individuals had escaped selection and contained the codA gene, and they were excluded from further analyses.
SSR marker development and polymorphism analysis in four Hieracium accessions
A total pool of 102 053 Hieracium transcript sequence contigs from isolated AI cells, embryo sacs and somatic ovule cells from R35 were analysed to identify potential SSR markers. As a result, 14 684 non-redundant SSR markers were generated and designated as Hieracium expressed sequence (HES) markers (Supplementary Data Table S2). The SSR motifs identified in the HES markers consisted of 9339 (63·6 %) trinucleotide repeats, 1879 (12·8 %) dinucleotide repeats and 3466 (23·6 %) tetranucleotide repeats (Supplementary Data Fig. S1).
Polymorphism analysis using 3000 of the 14 684 HES markers was performed using four Hieracium species (R35, D36, A35 and P36) (Supplementary Data Table S2). Successful PCR amplification was obtained with 2025 (67·5 %), 390 (13·0 %), 145 (4·8 %) and 62 (2·1 %) markers from four, three, two and one species, respectively. The remaining 378 (12·6 %) markers did not amplify from any species. Amplification in A35, R35, D36 and P36 occurred with 2431, 2563, 2385 and 2243 markers, respectively. Of these, 785, 965, 857 and 737 markers showed double bands in A35, R35, D36 and P36, respectively, while the remainder were single bands.
The 2025 HES markers that amplified from all four species were used to investigate the genetic relationships between the four Hieracium species. Polymorphism analysis of the marker bands in pair-wise comparisons of the four species indicated that R35 and A35 were the most genetically similar whereas D36 and P36 were most dissimilar (Supplementary Data Table S3).
Construction of the P36 and D36 genetic linkage maps
A total of 1566 markers were screened in the P36 × D36 F1 progeny and 407 markers showed clear segregating amplification products. While 164 markers identified a single polymorphic locus, the remaining markers generated double, triple, quadruple or quintuple polymorphic loci. The segregating SSR loci were identified in either D36 (395 loci), P36 (242 loci) or both parents (121 loci). A total of 758 polymorphic loci were generated from 424 markers, including the 17 SCAR markers linked to the LOA and LOP loci. Following genotyping of the 95 P36 × D36 F1 progeny, 19 individuals displayed genotype patterns almost identical to the maternal genotype (P36). These progeny were likely to have been derived from self-fertilization of P36, possibly caused by the mentor effect, whereby self-incompatibility has abated due to the influence of cross-pollination from another species (D36) (Krahulcová et al., 1999). The 19 selfed P36 progeny were excluded from the final dataset used for map construction.
Of the polymorphic loci, 210 were assigned to 16 linkage groups (LGs) of D36 covering 1650 cM, while 75 were assigned to 11 LGs of P36 covering 918 cM (Table 1; Supplementary Data Fig. S2). A total of 490 (65 %) polymorphic loci failed to map, suggesting that many of the polymorphic loci may be derived from non-allelic repetitive, paralogous or homoeologous sequences in the Hieracium genome. The 16 D36 and 11 P36 linkage groups were designated LGD01 to LGD16 and LGP01 to LGP11, respectively, in decreasing order of map distance (cM). The average locus density was 8·5 and 14·3 cM/locus in the D36 and P36 maps, respectively. Segregation distortion was observed for 59·0 and 38·7 % of the mapped marker loci in D36 and P36, respectively (Table 2).
Table 1.
Number and type of markers screened and mapped for both populations
| Marker type | Markers screened |
Polymorphic markers |
Mapped loci (%) |
|||
|---|---|---|---|---|---|---|
| P36 × D36 | R35 | P36 × D36 | R35 | P36 × D36 | R35 | |
| SSR | 1566 | 965 | 407 | 403 | 285 (35 %) | 518 (81 %) |
| LOA SCAR | 15 | 15 | 15 | 15 | 15 (100 %) | 15 (100 %) |
| LOP SCAR | 2 | NA | 2 | NA | 2 (100 %) | NA |
NA, not applicable.
Table 2.
Map lengths and number of mapped loci on each genetic map
| D36 |
P36 |
R35 |
||||||||||||
|---|---|---|---|---|---|---|---|---|---|---|---|---|---|---|
| Linkage group | Map length (cM) | No. of loci | Locus density (cM/locus) | Loci with segregation distortion (%) | Linkage group | Map length (cM) | No. of loci | Locus density (cM/locus) | Loci with segregation distortion (%) | Linkage group | Map length (cM) | No. of loci | Locus density (cM/locus) | Loci with segregation distortion (%) |
| LGD01 | 232·4 | 37 | 6·5 | 43·2 | LGP01 | 144·3 | 14 | 11·1 | 50·0 | LGR01 | 153·1 | 42 | 3·7 | 38·1 |
| LGD02 | 178·9 | 17 | 11·2 | 41·2 | LGP02 | 141·5 | 24 | 6·2 | 29·2 | LGR02 | 149·4 | 61 | 2·5 | 44·3 |
| LGD03 | 145·3 | 13 | 12·1 | 53·8 | LGP03 | 115·6 | 5 | 28·9 | 40·0 | LGR03 | 139·2 | 72 | 2·0 | 61·1 |
| LGD04 | 144·7 | 33 | 4·5 | 75·8 | LGP04 | 108·3 | 5 | 27·1 | 60·0 | LGR04A | 126·6 | 20 | 6·7 | 45·0 |
| LGD05 | 144·6 | 8 | 20·7 | 87·5 | LGP05 | 87·0 | 4 | 29·0 | 50·0 | LGR04B | 35·5 | 14 | 2·7 | 100·0 |
| LGD06 | 133·8 | 18 | 7·9 | 44·4 | LGP06 | 74·4 | 4 | 24·8 | 50·0 | LGR05 | 115·8 | 53 | 2·2 | 32·1 |
| LGD07 | 103·1 | 13 | 8·6 | 46·2 | LGP07 | 71·9 | 5 | 18·0 | 20·0 | LGR06A | 133·9 | 29 | 4·8 | 6·9 |
| LGD08 | 96·7 | 9 | 12·1 | 77·8 | LGP08 | 70·8 | 4 | 23·6 | 75·0 | LGR06B | 15·7 | 12 | 1·4 | 100·0 |
| LGD09 | 90·9 | 5 | 22·7 | 60·0 | LGP09 | 52·0 | 3 | 26·0 | 33·3 | LGR07 | 102·0 | 31 | 3·4 | 48·4 |
| LGD10 | 87·8 | 4 | 29·3 | 25·0 | LGP10 | 43·4 | 4 | 14·5 | 0·0 | LGR08 | 90·9 | 10 | 10·1 | 50·0 |
| LGD11 | 81·2 | 29 | 2·9 | 55·2 | LGP11 | 8·8 | 3 | 4·4 | 33·3 | LGR09A | 90·4 | 57 | 1·6 | 73·7 |
| LGD12 | 75·9 | 4 | 25·3 | 75·0 | LGR09B | 93·3 | 19 | 5·2 | 68·4 | |||||
| LGD13 | 50·2 | 4 | 16·7 | 50·0 | LGR10 | 81·9 | 23 | 3·7 | 95·7 | |||||
| LGD14 | 43·0 | 8 | 6·1 | 100·0 | LGR11 | 78·5 | 12 | 7·1 | 75·0 | |||||
| LGD15 | 27·3 | 3 | 13·7 | 100·0 | LGR12 | 73·4 | 23 | 3·3 | 95·7 | |||||
| LGD16 | 14·2 | 5 | 3·6 | 100·0 | LGR13 | 72·7 | 9 | 9·1 | 55·6 | |||||
| LGR14 | 61·7 | 10 | 6·9 | 50·0 | ||||||||||
| LGR15 | 44·0 | 21 | 2·2 | 33·3 | ||||||||||
| TOTAL/AVER. | 1650·0 | 210 | 8·5 | 59·0 | 918·0 | 75 | 14·3 | 38·7 | 1658·0 | 518 | 3·3 | 55·2 | ||
Construction of the R35 genetic linkage map
Screening of the polyhaploid R35 population was performed with 965 SSR markers that amplified two high-intensity DNA products in R35. Of these, 403 markers exhibited polymorphic banding patterns. While 258 markers identified a single polymorphic locus, the remaining generated double, triple and quadruple polymorphic loci, which included high- and low-intensity bands. In addition, 15 SCAR markers also detected polymorphism in the progeny. In total, 642 polymorphic loci were generated from 418 markers. Following genotyping, 14 individuals were identified in which most markers displayed 3:1 segregation ratios that were distorted from the 1:1 ratio seen in the other polyhaploid progeny. As the codA transgene was absent in these 14 progeny, they were probably tetraploid progeny meiotically derived from self-fertilization of R35. These 14 individuals were excluded from the final R35 polyhaploid dataset used for map construction.
Of the 642 polymorphic loci, 518 (81 %) were successfully assigned to 18 R35 LGs with a cumulative total map length of 1658 cM (Table 1, Fig. 2). The average locus density of the map was 3·3 cM/locus. Segregation distortion was observed for 55·2 % of the mapped marker loci (Table 2). As all the Hieracium species used in this study are allotetraploid, the polyhaploid R35, D36 and P36 parental linkage maps each represent nine pairs of homoeologous linkage groups. SSRs with multiple polymorphic alleles were used to define potential homoeologous groups. However, only three homoeologues (LGR04B, LGR06B and LGR09B) could be detected in the polyhaploid R35 linkage map (Fig. 2). A lack of additional homoeologous loci prevented the identification of further homoeologous pairs in this population and in the D36 and P36 parental maps. Similarly, a lack of bridging loci between the R35, D36 and P36 parental maps prevented their integration into a single map.
Fig. 2.


Genetic linkage map for the apomict H. praealtum (isolate R35) created using the polyhaploid R35 population generated as described in Fig. 1. Identified homoeologues are designated A and B. LOA-linked SCAR markers are designated in bold type with markers from contigs A and B shown in orange and green type, respectively. The locus associated with the LOA phenotype is shown in pink type and is underlined. The centiMorgan distances are indicated at left.
Mapping of apomixis associated markers
An aim of this study was to increase the marker density at the LOA and LOP loci to support a map-based cloning approach. SCAR markers associated with the LOA locus used in this study were derived from a physical map of two LOA-linked contigs, A and B. Therefore, the physical order of the markers is known and can be compared with the order in which they were mapped on each linkage group. Within the R35 polyhaploid population, 15 out of 96 progeny displayed recombination in the region of the LOA locus as determined by the LOA-linked SCAR markers, and six of these recombinants had exchanges between contigs A and B. All assignable LOA SCAR markers mapped to LGR15 and clustered within two contig-specific groups separated by ∼10 cM (Fig. 3). Limited recombination within each of the LOA-associated contigs resulted in the genetic marker order not fully reflecting the physical order of the LOA SCAR markers, particularly within the contig A cluster.
Fig. 3.
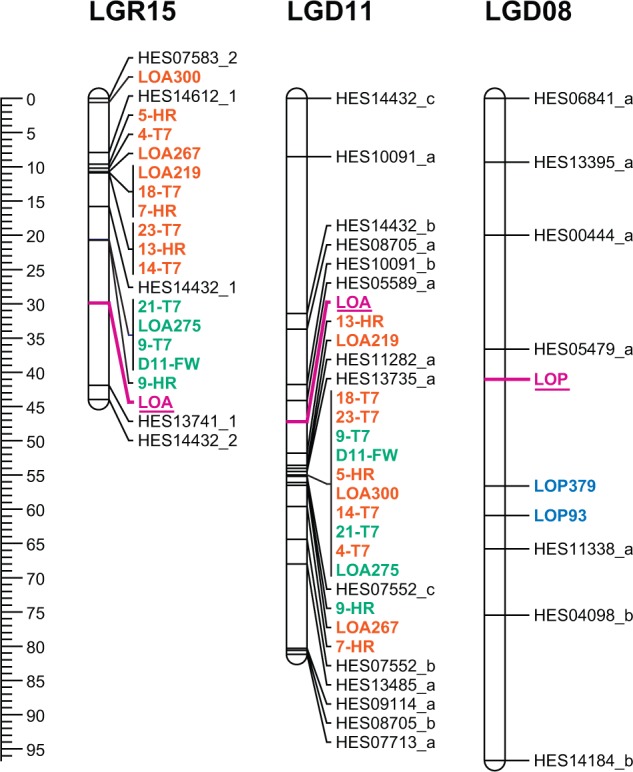
Linkage groups that contain the LOA and LOP apomixis loci. LOA was mapped onto the R35 (LGR15) and D36 (LGD11) maps, whereas LOP was mapped onto the D36 map (LGD08) only. LOA- and LOP-linked SCAR markers are depicted in bold type. LOA-linked SCAR markers from contigs A and B are shown in orange and green type, respectively. LOP-linked SCAR markers are shown in blue type. The LOA and LOP traits are shown in pink type and are underlined. The centiMorgan distances are indicated at left.
The LGR15 linkage group contained an additional five SSR loci and had the lowest SSR marker density in the R35 linkage map. Two SSR loci (HES14612_1 and HES07583_2) were present on the gap-distal flank of contig A, one locus (HES14432_1) was located between contigs A and B and the remaining two loci (HES13741_1 and HES14432_2) were placed on the end of the linkage group (42 and 44 cM respectively) (Fig. 3).
Within the P36 × D36 population, all assignable LOA SCAR markers mapped to LGD11 (Fig. 3). Only six of the 96 progeny displayed recombination between LOA SCAR markers, resulting in the genetic order of LOA SCAR markers being largely unresolved and inconsistent with the known physical marker order (Fig. 3). In contrast to the polyhaploid R35 population, an absence of recombination between contigs A and B in the P36 × D36 population did not permit resolution of LOA SCAR markers into contig-specific groups. In addition to the LOA-associated SCAR markers, 14 SSR loci were mapped to the LGD11 linkage group. Three of these loci were interspersed among the LOA SCAR markers, while six and five EST-SSR loci were positioned above and below the LOA loci on the linkage group, respectively.
LOA SCAR marker order was not conserved between the LOA-containing linkage groups LGR15 and LGD11 (Fig. 3) because of the differing levels of recombination within this region in both mapping populations. LGR15 and LGD11 also shared one EST SSR locus in HES14432, which was positioned near LOA-linked loci in both instances. This EST SSR marker could therefore be valuable for assisting LOA map-based cloning in both populations. The LOP-linked SCAR markers could only be mapped using the P36 × D36 population. LGD08 contained both of the LOP markers and an additional seven SSR loci (Fig. 3).
Validation of the apomictic linkage maps
In order to validate the linkage maps, LOA and LOP phenotype data were also mapped as qualitative traits. In each case, the LOA and LOP phenotypes mapped to the same linkage group as the associated SCAR markers. On the R35 map, the LOA phenotype mapped to LGR15 at 29·9 cM, between contig B-associated SCAR markers and the SSR locus HES13741_1 (Fig. 3). On the D36 map, the LOA phenotype mapped to LGD11 at 47 cM between the LOA SCAR markers and the SSR locus HES00589_a (Fig. 3). The LOP phenotype could only be mapped to the D36 map as it did not segregate within the R35 polyhaploid population. The LOP phenotype mapped to LGD08 at 41 cM and was positioned between the SSR locus HES05479_a (37 cM) and the LOP-linked SCAR marker, LOP379 (57 cM) (Fig. 3).
Partial macrosynteny exists between Hieracium and lettuce genomes
Next, we used sequences underlying the SSR loci of the R35 linkage map to investigate whether macrosynteny exists between Hieracium and the genomes of lettuce, sunflower, tomato and/or A. thaliana. Of these four species, Hieracium is most closely related to lettuce and both species share the same base chromosome number (n = 9). Comparative analysis between Hieracium and lettuce revealed partial macrosynteny for six linkage groups (Fig. 4), as defined when the majority of orthologue pairs originate from a single linkage group. Marker order was not always conserved, although this was possibly a result of unresolved marker order in the R35 map rather than an indication of genome rearrangement. No regions within the lettuce linkage groups were identified as syntenic to LGR15, which contained the LOA markers. Synteny was also investigated between the lettuce genome and the LOP locus containing linkage group LGD08, although no evidence of synteny was observed.
Fig. 4.

Identified putative syntenic regions between the H. praealtum (R35) and lettuce genetic linkage maps. The centiMorgan distances are indicated at left.
Despite the greater number of mapped contigs available for comparative analysis from the sunflower linkage map (22 482) compared with lettuce (12 841), fewer matches to Hieracium transcripts were identified with BLAST using the sunflower dataset. Only 193 putative orthologue pairs were identified using sunflower compared with 362 with the lettuce dataset (Supplementary Data Table S4). Furthermore, no evidence of macrosynteny was found between the Hieracium and sunflower linkage maps. Similarly, no evidence of macrosynteny was found between Hieracium and the genomes of tomato and Arabidopsis using this current R35 linkage map (Supplementary Data Table S4).
DISCUSSION
Development of a collection of genic markers for Hieracium
In this study, the first genetic linkage maps of both apomictic and sexual Hieracium species have been generated to provide a resource for identifying and characterizing apomixis loci. The choice of transcript-associated SSR markers for constructing the maps was based upon their genic nature, high levels of polymorphism and cross-species transferability (Ellis and Burke, 2007). The SSR markers were designed from transcripts isolated from ovule tissue as the events of apomixis occur in this female reproductive organ. The genetic map is therefore composed of loci that are potentially involved in apomixis pathways. SSR marker primer design proved successful, with 68 % (2025) of the primer pairs tested amplifying products in all four Hieracium species, which also demonstrates their cross-species transferability in Hieracium despite being designed from a single species (R35).
The SSR markers developed in this study will also be useful for future applications. including genetic diversity and population structure analyses involving Hieracium species. Few resources currently exist for the study of population genetics in wild Hieracium. While a small number of SSR markers have been developed previously (Zini and Komjanc, 2008), analyses currently utilize a combination of karyotype and isozyme/allozyme analyses and maternally derived chloroplast sequences to understand the complex population structures of Hieracium (Krahulec et al., 2008; Šingliarová et al., 2008; Krahulcová et al., 2009). An initial assessment of genetic diversity among the four species included in this work demonstrated the utility of this newly developed SSR marker collection. Previous studies based on strong conservation of LOA-linked markers, cytogenetic analysis of the LOA-associated chromosomal structure, chloroplast DNA (cpDNA) haplotype and morphology suggested that R35 was more closely related to D36 than to A35 or P36 (Koltunow et al., 2011b; Okada et al., 2011). Surprisingly, electrophoretic analysis of SSR allele amplicons from these four Hieracium species indicated that R35 and A35 appeared to have greater genetic similarity to each other relative to D36 and P36. The conservation of the LOA locus and associated chromosomal structure in R35 and D36 contrasts with the apparent overall genome sequence divergence between these two species and makes it tempting to speculate that there may be strong selective pressure to conserve the LOA locus and surrounding chromosomal structure. However, genetic diversity was inferred by the presence of differentially sized SSR amplicons between species; this approach is potentially limited by size homoplasy, whereby PCR amplicons of different alleles of the same molecular weight cannot be resolved electrophoretically (Estoup et al., 2002).
SSR marker segregation distortion
Distorted marker segregation ratios were observed in the progeny of the interspecific cross between P36 (39 %) and D36 (59 %) and in the progeny derived intraspecifically from R35 (55 %). These distorted markers were not evenly distributed over the R35, D36 or P36 linkage maps. Marker transmission distortion is a common phenomenon in genome analyses and can be caused by linkage to loci that affect gametophytic or zygotic fitness (Xu, 2008). In addition, marker segregation distortion may have also resulted from non-allelic repetitive, paralogous and/or homoeologous sequences in the Hieracium allotetraploid genome. Segregation distortion typically increases with the genetic distance between the parental plant lines used to generate mapping populations (Leppälä et al., 2013). Thus, the interspecific background of the P36 and D36 parental lines is likely to be a factor for the marker segregation distortion observed in these hybrid progeny. Biased selection of the P36 × D36 F1 progeny based on LOA genotype may have also influenced marker segregation in this population.
The marker segregation distortion evident in the R35 linkage map was comparable to the distortion seen in the D36 map despite the polyhaploid progeny being intraspecifically derived from R35. Marker segregation among the R35 polyhaploid progeny may be affected by the negative selection process whereby loci linked to the codA insertion site are selected against. Also, chromosomal reduction in the polyhaploid progeny may have unmasked deleterious recessive alleles throughout the genome, created gene dosage effects or affected the fitness conferred by various loci.
The success of genetic map construction relates to the genome complexity of each mapping population
The use of codA-transgenic Hieracium to select for polyhaploid progeny was a successful strategy for generating a mapping population with reduced genome complexity. The simpler genome constitution of the polyhaploid individuals resulted in a higher proportion of polymorphic, segregating markers (45 %) identified in this population compared with the P36 × D36 population (27 %). For marker loci to segregate within the P36 × D36 population, they needed to be polymorphic between and within the two parents, whereas more segregating loci were found within the polyhaploid F1 progeny as the loci only needed to be heterozygous within R35 itself. The reduced genome complexity in the polyhaploid population enabled the construction of a more comprehensive genetic map for R35 in which 18 linkage groups were identified. By contrast, the P36 and D36 genetic maps had lower marker densities and fewer linkage groups. The reduced proportion of polymorphic markers that mapped in the P36 × D36 population relative to the polyhaploid R35 population (33 and 81 % respectively; Table 2) reflected the large tetraploid and highly heterozygous genome constitutions of both P36 and D36.
The R35 genetic map was unsuitable for mapping of the LOP or AutE apomixis loci as these traits did not segregate within the polyhaploid R35 population. A genetic map constructed from the P36 × D36 population was used to successfully map the LOP locus, and is potentially valuable for the future mapping of the AutE apomixis locus, as the AutE trait was uncoupled from apospory and fertilization-independent embryo formation in this background. To improve the P36 and D36 genetic maps, a greater number of markers is required. Approaches such as genotyping by sequencing (GBS) and restriction site-associated sequencing (RAD-seq) have been used to develop larger panels of markers and derive genetic maps from plant species with complex polyploid and/or highly heterozygous genomes (Ma et al., 2012; Poland et al., 2012). A similar approach could be used to improve future versions of the P36 and D36 genetic maps.
Future mapping approaches could also potentially involve the development of Hieracium lines with simpler genome constitutions. For example, selfed P36 progeny were obtained in this study due to the breakdown of self-incompatibility, which could be exploited to generate inbred sexual P36 mapping lines. Furthermore, doubled haploid lines could be generated by colchicine treatment of apomictic R35 or D36 polyhaploids to develop tetraploid plants with reduced heterozygosity. Crossing of inbred sexual P36 lines with doubled haploid apomictic lines has the potential to overcome the difficulties associated with the highly heterozygous Hieracium genome and would facilitate mapping of the LOA, LOP and other apomixis loci.
The reference Hieracium genetic maps will facilitate map-based cloning of apomixis loci
An aim of this study was to identify additional markers that are linked to the LOA and LOP loci within R35 and D36. Mapping of the LOA and LOP phenotypes as qualitative traits onto the same linkage group as the LOA- and LOP-associated markers validated the map positions of these markers, and additional linked SSR loci were also identified on these linkage groups. Such SSR loci could therefore be potentially used as new starting points for chromosome walking to assist in the isolation of the LOA and LOP causal regions. It is worth noting that the genetic distance between the LOA-linked markers is likely to be exaggerated on these maps, given that plants within both mapping populations were selected based on the presence or absence of LOA-linked SCAR markers, to compensate for the low transmission of the LOA locus and to increase the number of recombinants in the LOA region.
The genetic linkage maps will be useful for future mapping of the autonomous endosperm component of apomixis in Hieracium. The AutE trait was recently genetically uncoupled from the process of parthenogenesis by identification of two individuals that form reduced embryo sacs via the sexual pathway and require fertilization for embryogenesis, but are able to form endosperm without fertilization (Ogawa et al., 2013). As one of these individuals (AutE196) is an F1 progeny of the P36 × D36 cross, future efforts will focus on using markers from the D36 linkage map to ultimately map the AutE locus within a backcross population. The D36 and P36 linkage maps will be valuable for providing information on the genomic position of AutE and whether or not it is tightly linked to the LOP locus.
The linkage maps reported here can also be used for the future mapping of apomixis-modifying genetic elements. Although the three major identified apomixis loci in Hieracium are dominant, other factors are thought to alter the apomixis and/or sexual pathways leading to variable penetrance of each of the three apomixis components. Although incomplete penetrance of apomixis occurs at relatively low levels in wild-type apomictic lines (Koltunow et al., 2011b), reduced apomixis penetrance is typically much more pronounced in naturally sourced and experimental Hieracium hybrids (Krahulec et al., 2008; Krahulcová et al., 2009, 2011; Okada et al., 2011; Ogawa et al., 2013). By including sexual R35 mutant m115 in the RNA sequencing and marker design process here, transcripts associated with the sexual reproduction pathway are likely to have also been captured, which may prove useful when mapping suppressive elements in the sexual background that play a role in reducing apomixis penetrance in hybrids. Segregation of modifying elements in meiotically derived progeny indicates that modifiers can be potentially mapped. Identifying modifiers alongside the causal sequences underlying the major dominant loci will be important if apomixis is to be successfully engineered into crops.
The lettuce genome may be useful for comparative mapping of apomixis traits in Hieracium
Construction of these Hieracium linkage maps with genic markers has also provided the first opportunity to examine synteny between the Hieracium genome and other model species. Hieracium is a member of the Asteraceae, which is a relatively poorly resourced plant family with respect to genomic resources, as no full genome sequences have been published for any Asteraceae species. Of the four species for which synteny was examined, Hieracium is most closely related to lettuce, with both species classified within the Cichorieae tribe. The partial synteny identified between the Hieracium and lettuce genomes is consistent with this relationship. Putative blocks of synteny have recently been reported between the genomes of lettuce and another member of the Cichorieae tribe, root chicory (Cichorium intybus var. sativum) (Muys et al., 2014). Hieracium, lettuce and chicory have the same base chromosome number (n = 9), and the evidence of synteny here and in the study of Muys et al. (2014) suggests that the genome content within the Cichorieae may have been conserved over evolutionary time. By contrast, a genome duplication event is thought to have occurred in an ancestor of modern-day sunflower, after its divergence from the Cichorieae (Barker et al., 2008). As a result, sunflower contains almost twice the number of chromosomes (n = 17). The fewer orthologous gene pairs identified and lack of synteny between the genomes of Hieracium and sunflower, tomato and Arabidopsis implies that sequence divergence has occurred between these species.
The partial synteny between Hieracium and lettuce observed in this work is encouraging and suggests that the genome of other Cichorieae species may be valuable for the comparative mapping of apomixis loci in Hieracium. A genome sequencing project has commenced for lettuce and is likely to be a valuable resource for identifying DNA sequences orthologous to important Hieracium apomixis loci. Although apomixis is not known to exist within lettuce, it remains possible that loci responsible for apomixis represent mutated gene(s) that are present in non-apomictic species. Synteny with model species has previously been used for the characterization of apomixis-related loci in other apomictic species. Macrosynteny was identified between the apomixis controlling locus (ACL) of Paspalum simplex and the distal end of rice chromosome 12 (Pupilli et al., 2001). However, comparison at the sequence level revealed a lack of conserved microcolinearity between the two regions due to the insertion of transposable elements and small-scale deletions at the ACL (Calderini et al., 2006). The highly repetitive nature of the LOA sequence obtained to date may also hinder comparative mapping approaches for this particular locus. However, the genome architecture surrounding the LOP and AutE loci are not yet known, and these loci may be more suited to the comparative mapping approach.
Conclusions and future directions
The collection of expressed SSR markers and genetic linkage maps generated in this work is among the first reported for a model apomict species and will support future applications, including map-based cloning of the three major apomixis loci and other quantitative loci that affect apomixis expression. The highly heterozygous and tetraploid genome constitution of apomictic Hieracium complicates map construction; however, the polyhaploid mapping population generated here was a successful approach for reducing genome complexity and resulted in a more comprehensive genetic map. The linkage maps also provide an opportunity to map candidate genes identified by other approaches, which include ovule-specific cell transcriptome comparison between apomictic and sexual plants during the crucial developmental stages of apomixis. Together, the findings indicate that genes identified with these approaches will assist in the elucidation of the underlying genetic control of apomixis in Hieracium.
SUPPLEMENTARY DATA
Supplementary data are available online at www.aob.oxfordjournals.org and consist of the following. Table S1: SCAR marker primer sequences and PCR conditions. Table S2: Hieracium SSR marker primer sequences and polymorphism analysis. Table S3: dissimilarity matrix of the four Hieracium species constructed using SSR allele scores. Table S4: details of orthologues of Hieracium transcripts from lettuce, sunflower, tomato and Arabidopsis as determined by BLAST analysis. Figure S1: distributions of the SSR motifs of the Hieracium SSR markers. Figure S2: a genetic map for the tetraploid apomict H. piloselloides D36 and the tetraploid sexual H. pilosella P36.
ACKNOWLEDGEMENTS
We thank R. Bicknell (Plant and Food Research Ltd New Zealand) for donating the transgenic R35 codA line and S. Sasamoto, S. Nakayama, T. Fujishiro, M. Kato, Y. Kishida, M. Kohara, C. Minami, K. Nanri and H. Tsuruoka (Kazusa DNA Research Institute) for their technical assistance. This research was supported by a Science Industry Endowment Fund (grant number RP01-006) to A.M.G.K. K.S., T.O., S.T. and A.M.G.K. designed the experiments. K.S., M.L.H., S.T.H., T.O., S.D.J., J.M.T., A.S., H.S., H.H. and S.I. carried out the experiments and analysed the data. K.S., M.L.H., S.T.H. and A.M.G.K. interpreted the data and wrote the paper.
LITERATURE CITED
- Barker MS, Kane NC, Matvienko M, et al. 2008. Multiple paleopolyploidizations during the evolution of the Compositae reveal parallel patterns of duplicate gene retention after millions of years. Molecular Biology and Evolution 25: 2445–2455. [DOI] [PMC free article] [PubMed] [Google Scholar]
- Bicknell RA. 1997. Isolation of a diploid, apomictic plant of Hieracium aurantiacum. Sexual Plant Reproduction 10: 168–172. [Google Scholar]
- Bicknell RA, Koltunow AM. 2004. Understanding apomixis: recent advances and remaining conundrums. Plant Cell 16: S228–S245. [DOI] [PMC free article] [PubMed] [Google Scholar]
- Bicknell RA, Lambie SC, Butler RC. 2003. Quantification of progeny classes in two facultatively apomictic accessions of Hieracium. Hereditas 138: 11–20. [DOI] [PubMed] [Google Scholar]
- Birol I, Jackman SD, Nielsen CB, et al. 2009. De novo transcriptome assembly with ABySS. Bioinformatics 25: 2872–2877. [DOI] [PubMed] [Google Scholar]
- Bowers JE, Nambeesan S, Corbi J, et al. 2012. Development of an ultra-dense genetic map of the sunflower genome based on single-feature polymorphisms. PLoS ONE 7: e51360. [DOI] [PMC free article] [PubMed] [Google Scholar]
- Calderini O, Chang SB, De Jong H, et al. 2006. Molecular cytogenetics and DNA sequence analysis of an apomixis-linked BAC in Paspalum simplex reveal a non pericentromere location and partial microcolinearity with rice. Theoretical and Applied Genetics 112: 1179–1191. [DOI] [PubMed] [Google Scholar]
- Carman JG. 1997. Asynchronous expression of duplicate genes in angiosperms may cause apomixis, bispory, tetraspory, and polyembryony. Biological Journal of the Linnean Society 61: 51–94. [Google Scholar]
- Catanach AS, Erasmuson SK, Podivinsky E, Jordan BR, Bicknell R. 2006. Deletion mapping of genetic regions associated with apomixis in Hieracium. Proceedings of the National Academy of Sciences of the USA 103: 18650–18655. [DOI] [PMC free article] [PubMed] [Google Scholar]
- Ellis JR, Burke JM. 2007. EST-SSRs as a resource for population genetic analyses. Heredity 99: 125–132. [DOI] [PubMed] [Google Scholar]
- Estoup A, Jarne P, Cornuet JM. 2002. Homoplasy and mutation model at microsatellite loci and their consequences for population genetics analysis. Molecular Ecology 11: 1591–1604. [DOI] [PubMed] [Google Scholar]
- Hand ML, Vít P, Krahulcová A, et al. 2014. Evolution of apomixis loci in Pilosella and Hieracium (Asteraceae) inferred from the conservation of apomixis-linked markers in natural and experimental populations. Heredity in press. doi:10.1038/hdy.2014.61. [DOI] [PMC free article] [PubMed] [Google Scholar]
- Koltunow AM, Johnson SD, Bicknell RA. 1998. Sexual and apomictic development in Hieracium. Sexual Plant Reproduction 11: 213–230. [Google Scholar]
- Koltunow AM, Johnson SD, Bicknell RA. 2000. Apomixis is not developmentally conserved in related, genetically characterized Hieracium plants of varying ploidy. Sexual Plant Reproduction 12: 253–266. [Google Scholar]
- Koltunow AMG, Johnson SD, Okada T. 2011a. Apomixis in hawkweed: Mendel's experimental nemesis. Journal of Experimental Botany 62: 1699–1707. [DOI] [PubMed] [Google Scholar]
- Koltunow AMG, Johnson SD, Rodrigues JCM, et al. 2011b. Sexual reproduction is the default mode in apomictic Hieracium subgenus Pilosella, in which two dominant loci function to enable apomixis. Plant Journal 66: 890902. [DOI] [PubMed] [Google Scholar]
- Kotani Y, Henderson ST, Suzuki G, et al. 2014. The LOSS OF APOMEIOSIS (LOA) locus in Hieracium praealtum can function independently of the associated large-scale repetitive chromosomal structure. New Phytologist 201: 973–981. [DOI] [PubMed] [Google Scholar]
- Krahulcová A, Chrtek J, Krahulec F. 1999. Autogamy in Hieracium subgen. Pilosella. Folia Geobotanica 34: 373–376. [Google Scholar]
- Krahulcová A, Rotreklová O, Krahulec F, Rosenbaumová R, Plačková I. 2009. Enriching ploidy level diversity: the role of apomictic and sexual biotypes of Hieracium subgen. Pilosella (Asteraceae) that coexist in polyploid populations. Folia Geobotanica 44: 281–306. [Google Scholar]
- Krahulcová A, Krahulec F, Rosenbaumová R. 2011. Expressivity of apomixis in 2n + n hybrids from an apomictic and a sexual parent: insights into variation detected in Pilosella (Asteraceae: Lactuceae). Sexual Plant Reproduction 24: 63–74. [DOI] [PubMed] [Google Scholar]
- Krahulec F, Krahulcová A, Fehrer J, Bräutigam S, Schuhwerk F. 2008. The structure of the agamic complex of Hieracium subgen. Pilosella in the Šumava Mts and its comparison with other regions in Central Europe. Preslia 80: 1–26. [Google Scholar]
- Leppälä J, Bokma F, Savolainen O. 2013. Investigating incipient speciation in Arabidopsis lyrata from patterns of transmission ratio distortion. Genetics 194: 697–708. [DOI] [PMC free article] [PubMed] [Google Scholar]
- Ma X-F, Jensen E, Alexandrov N, et al. 2012. High resolution genetic mapping by genome sequencing reveals genome duplication and tetraploid genetic structure of the diploid Miscanthus sinensis. PLoS ONE 7: e33821. [DOI] [PMC free article] [PubMed] [Google Scholar]
- Muys C, Thienpont C-N, Dauchot N, Maudoux O, Draye X, Cutsem PV. 2014. Integration of AFLPs, SSRs and SNPs markers into a new genetic map of industrial chicory (Cichorium intybus L. var. sativum). Plant Breeding 133: 130–137. [Google Scholar]
- Ogawa D, Johnson SD, Henderson ST, Koltunow AM. 2013. Genetic separation of autonomous endosperm formation (AutE) from two other components of apomixis in Hieracium. Plant Reproduction 26: 113–123. [DOI] [PubMed] [Google Scholar]
- Okada T, Ito K, Johnson SD, et al. 2011. Chromosomes carrying meiotic avoidance loci in three apomictic eudicot Hieracium subgenus Pilosella species share structural features with two monocot apomicts. Plant Physiology 157: 1327–1341. [DOI] [PMC free article] [PubMed] [Google Scholar]
- Okada T, Hu Y, Tucker MR, et al. 2013. Enlarging cells initiating apomixis in Hieracium praealtum transition to an embryo sac program prior to entering mitosis. Plant Physiology 163: 216–231. [DOI] [PMC free article] [PubMed] [Google Scholar]
- Ortiz JPA, Pessino S, Bhat V, Hayward MD, Quarin CL. 2001. A genetic linkage map of diploid Paspalum notatum. Crop Science 41: 823–830. [Google Scholar]
- Ozias-Akins P, Van Dijk PJ. 2007. Mendelian genetics of apomixis in plants. Annual Review of Genetics 41: 509–537. [DOI] [PubMed] [Google Scholar]
- Park YH, Alabady MS, Ulloa M, et al. 2005. Genetic mapping of new cotton fiber loci using EST-derived microsatellites in an interspecific recombinant inbred line cotton population. Molecular Genetics and Genomics 274: 428–441. [DOI] [PubMed] [Google Scholar]
- Poland JA, Brown PJ, Sorrells ME, Jannink J-L. 2012. Development of high-density genetic maps for barley and wheat using a novel two-enzyme genotyping-by-sequencing approach. PLoS ONE 7: e32253. [DOI] [PMC free article] [PubMed] [Google Scholar]
- Pupilli F, Barcaccia G. 2012. Cloning plants by seeds: inheritance models and candidate genes to increase fundamental knowledge for engineering apomixis in sexual crops. Journal of Biotechnology 159: 291–311. [DOI] [PubMed] [Google Scholar]
- Pupilli F, Labombarda P, Caceres ME, Quarín CL, Arcioni S. 2001. The chromosome segment related to apomixis in Paspalum simplex is homoeologous to the telomeric region of the long arm of rice chromosome 12. Molecular Breeding 8: 53–61. [Google Scholar]
- Shirasawa K, Asamizu E, Fukuoka H, et al. 2010. An interspecific linkage map of SSR and intronic polymorphism markers in tomato. Theoretical and Applied Genetics 121: 731–739. [DOI] [PMC free article] [PubMed] [Google Scholar]
- Šingliarová B, Chrtek J, Jr, Mráz P. 2008. Loss of genetic diversity in isolated populations of an alpine endemic Pilosella alpicola subsp. ullepitschii: effect of long-term vicariance or long-distance dispersal? Plant Systematics and Evolution 275: 181–191. [Google Scholar]
- Stein J, Pessino S, Martínez E, et al. 2007. A genetic map of tetraploid Paspalum notatum Flügge (bahiagrass) based on single-dose molecular markers. Molecular Breeding 20: 153–166. [Google Scholar]
- Stougaard J. 1993. Substrate-dependent negative selection in plants using a bacterial cytosine deaminase gene. Plant Journal 3: 755–761. [Google Scholar]
- Suzuki R, Shimodaira H. 2006. Pvclust: an R package for assessing the uncertainty in hierarchical clustering. Bioinformatics 22: 1540–1542. [DOI] [PubMed] [Google Scholar]
- The Arabidopsis Genome Initiative. 2000. Analysis of the genome sequence of the flowering plant Arabidopsis thaliana. Nature 408: 796–815. [DOI] [PubMed] [Google Scholar]
- The Tomato Genome Consortium. 2012. The tomato genome sequence provides insights into fleshy fruit evolution. Nature 485: 635–641. [DOI] [PMC free article] [PubMed] [Google Scholar]
- Truco MJ, Ashrafi H, Kozik A, et al. 2013. An ultra-high-density, transcript-based, genetic map of lettuce. G3: Genes|Genomes|Genetics 3: 617–631. [DOI] [PMC free article] [PubMed] [Google Scholar]
- Tucker MR, Okada T, Johnson SD, Takaiwa F, Koltunow AMG. 2012. Sporophytic ovule tissues modulate the initiation and progression of apomixis in Hieracium. Journal of Experimental Botany 63: 3229–3241. [DOI] [PMC free article] [PubMed] [Google Scholar]
- Van Ooijen J. 2006. JoinMap4, software for the calculation of genetic linkage maps in experimental populations. Wageningen: Kyazma. [Google Scholar]
- Voorrips RE. 2002. Mapchart: software for the graphical presentation of linkage maps and QTLs. Journal of Heredity 93: 77–78. [DOI] [PubMed] [Google Scholar]
- Xu S. 2008. Quantitative trait locus mapping can benefit from segregation distortion. Genetics 180: 2201–2208. [DOI] [PMC free article] [PubMed] [Google Scholar]
- Zini E, Komjanc M. 2008. Identification of microsatellite markers in Hieracium pilosella L. Conservation Genetics 9: 487–489. [Google Scholar]
Associated Data
This section collects any data citations, data availability statements, or supplementary materials included in this article.