

Abstract
What can be expected in normal aging, and where does normal aging stop and pathological neurodegeneration begin? With the slow progression of age-related dementias such as Alzheimer’s Disease (AD), it is difficult to distinguish age-related changes from effects of undetected disease. We review recent research on changes of the cerebral cortex and the hippocampus in aging and the borders between normal aging and AD. We argue that prominent cortical reductions are evident in fronto-temporal regions in elderly even with low probability of AD, including regions overlapping the default mode network. Importantly, these regions show high levels of amyloid deposition in AD, and are both structurally and functionally vulnerable early in the disease. This normalcy-pathology homology is critical to understand, since aging itself is the major risk factor for sporadic AD. Thus, rather than necessarily reflecting early signs of disease, these changes may be part of normal aging, and may inform on why the aging brain is so much more susceptible to AD than is the younger brain. We suggest that regions characterized by a high degree of life-long plasticity are vulnerable to detrimental effects of normal aging, and that this age-vulnerability renders them more susceptible to additional, pathological AD-related changes. We conclude that it will be difficult to understand AD without understanding why it preferably affects older brains, and that we need a model that accounts for age-related changes in AD-vulnerable regions independently of AD-pathology.
Keywords: normal aging, Alzheimer’s disease (AD), default mode network (DMN), cerebral cortex, hippocampus, amyloid
1. Introduction
The major risk factor for Alzheimer’s Disease (AD) is age, with a sharp increase in incidence after 60 years (Kawas et al., 2000). This has inspired many researchers to propose that to understand AD, we must understand its inherent relationship to aging (Herrup, 2010). Why is the aging brain so susceptible to AD, compared to the middle-aged or young brain? What features distinguish normal brain changes from those seen in early AD? How should we understand the fact that three of the major symptoms of AD observed in vivo – disruption of episodic memory function (Koivisto et al., 1995, Nyberg et al., 2012), brain atrophy (Raz et al., 2005, Driscoll et al., 2009, Fjell et al., 2009a) and accumulation of amyloid protein (Morris et al., 2010) – are also found in many presumably healthy elderly? Given these commonalities, it can be argued that AD cannot be understood separately from its major risk factor – age. However, we suggest that this statement can also be reversed: if we understand why the older brain is susceptible to AD, we may have a better chance of understanding brain aging itself. With the aging of the population, a comprehensive understanding of normal, non-demented changes in brain and cognition is arguably as important as understanding AD.
How the link between aging and AD should be understood is thus a major question in contemporary neuroscience. However, it is not obvious that studying the relationship between the two is the best starting point for understanding either phenomenon. Some argue that AD should be viewed as a disease with distinct etiology and neuropathology, separate from normal aging, and that it is less fruitful to view AD in light of normal age changes (Nelson et al., 2011). AD may be driven by factors less related to aging per se, for instance differences in amyloid precursor protein expression (APP) (Nelson et al., 2011), from which the presumably most toxic form of amyloid (Aβ42) originates. However, we have still not understood the role of amyloid in brain atrophy and cognitive decline. Current models of the role of amyloid in AD, as for instance reflected in the proposed diagnostic guidelines from the National Institute of Aging - Alzheimer’s Association (NIA-AA) (Jack et al., 2011, Sperling et al., 2011a) and the popular ‘dynamic biomarker model’ (Jack et al., 2010a, Jack et al., 2013), suggest that the influence of amyloid is greatest in very early phases – at a stage where cognitive and clinical symptoms are not yet detected. When accelerated brain atrophy and cognitive decline become evident, the therapeutic window for anti-amyloid drugs may very well be closed. Thus, it is absolutely necessary to study the relationship between amyloid, brain integrity and memory in healthy elderly if the role of amyloid in neurodegeneration and cognitive decline is to be understood. Animal models of AD are not characterized by the massive brain atrophy that correlates with memory problems in AD patients, and therefore can provide only limited insight into relationships between amyloid, brain integrity and episodic memory decline in non-demented older adults.
In the present paper, we review recent research on cortical and hippocampal changes in normal aging, the relationship between changes in normal aging vs. early AD, and the role played by amyloid. First, we will discuss the characteristics of presumably normal brain aging. What kind of macroscopic brain changes can be expected in older adults without dementia, and what consequences do these brain changes have for cognitive function? We try to identify and evaluate some of the proposed major organizing principles for brain aging, such as the theory of retrogenesis or the principle of “last in, first out”. In the cognitive domain, we focus especially on episodic memory, which is of interest because it is affected both in normal aging and very early in AD. Second, we investigate similarities and differences in the pattern of brain atrophy between normal aging and AD, with a special focus on comparisons between AD patients and elderly individuals with low AD-risk. Finally, we discuss the role of amyloid in brain atrophy and cognition, and evaluate current available knowledge related to the question of why brain aging is associated with the dramatic increase in AD-risk.
2. What is normal in normal aging?
2.1 Magnitude, pattern and timing of change
Reductions in specific cognitive abilities like mental speed (Salthouse, 1996), executive function (Connelly et al., 1991, Schretlen et al., 2000, Rabbitt et al., 2001) and episodic memory (Salthouse, 2003, Buckner, 2004, Nyberg et al., 2012) are commonly experienced in aging, while verbal abilities and world knowledge are typically maintained (Park and Reuter-Lorenz, 2009). However, there is disagreement about whether longitudinal changes in older adults reflect continuous ongoing processes starting in young adulthood or whether changes begin in middle age or beyond. Closely related to this is an unsettled discussion about whether changes observed in cross-sectional studies reflect real ongoing change within individuals (Salthouse, 2009) or arise from methodological artifacts (Schaie, 2009, Nyberg et al., 2012). Cross-sectional studies may suffer from cohort effects, and, potentially more seriously, different recruitment bias across age-groups. For instance, most studies are based on convenience samples, and there may be systematic differences in individuals who are recruited for, and agree to participate in, research at younger ages and older ages. For example, young participants are often college students, middle-aged participants may be more likely to be unemployed or under-employed, and older participants may be recruited from senior centers. The older age group may be biased by participants motivated to volunteer due to concerns about their cognitive abilities, or, alternatively, only the superior functioning older adults volunteer or are accepted into the study due to strict exclusion criteria. Thus these three age groups may differ in critical characteristics, which may affect the estimated age-trajectories. This is referred to as covariance between age and sampling bias. Longitudinal studies are, in principle, not affected by this bias and can measure change over time within individuals. However, longitudinal studies too have limitations that can influence the results – such as selective attrition and test-retest effects that may be larger than the change across time points (Salthouse, 2012). Adding to this, few longitudinal studies sample the entire adult age-span, precluding estimations of change rates as a function of age.
Despite the limitations of cross-sectional and longitudinal study designs, there is a consensus that episodic memory, which is of special focus in the present review, declines from about the age of 50–60 years on a population basis (Nyberg et al., 2012), although earlier decrements cannot be ruled out. In a very interesting study, longitudinal trajectories in episodic memory were mapped over 15 years in more than 1500 participants from the Betula study (Josefsson et al., 2012). Using a random-effects pattern-mixture model, the authors were able to divide the participants into three groups in terms of memory change – maintainers (18%), those who showed age-typical decline (68%) and decliners (13%) (see Figure 1). Physical activity, being female and living with someone increased the likelihood of being a maintainer, while lower education, not being employed and being male increased likelihood of being a decliner. Further, the authors corrected the age-memory reduction function for the effects of selective attrition. Correcting for selective attrition revealed a much steeper decline in episodic memory with increasing age than merely analyzing the available raw data. This indicates that studies may actually under-estimate the true age-decline due to selective attrition in longitudinal designs, or, likely, covariance between selection biases and age in cross-sectional. Carefully conducted longitudinal studies yield opportunities for correcting for these biases, revealing truer age-functions.
Figure 1. Longitudinal episodic memory decline in aging.
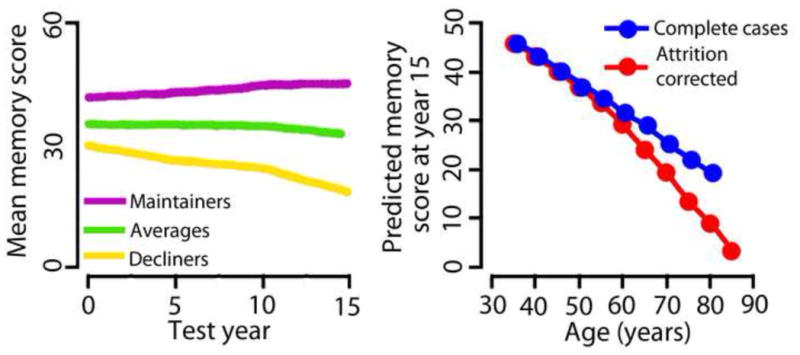
Left panel: By using a random-effects pattern-mixture model, Josefsson and colleagues (2012), found individual differences both in initial memory scores (offset at time 0) and change over time in their large sample (n > 1500) of initially healthy participants, with some maintaining their functional level (18%), some showing age-average decline (68%), while some declined (13%). The researchers were able to identify environmental and genetic factors predicting group membership. Right panel: Correcting for selective attrition reveal a much steeper decline in episodic memory with increasing age than analyzing the full sample of available data. Figures modified from Josefsson et al. (2012).
A popular view is that at least some portion of the age-changes in cognitive function is caused by structural brain changes. Cross-sectional correlations between brain volume and cognitive function cannot alone be used to justify such claims, and other types of cross-sectional evidence, e.g. cross-sectional mediation analysis, also have caveats (Rabbitt, 2011, Raz and Lindenberger, 2011, Salthouse, 2011). Detailed mapping of regional longitudinal brain changes, which then can be correlated with longitudinal cognitive changes, is a more promising avenue for understanding the neurobiological foundation for age-related decrements in cognitive function.
Compared to cognitive testing, an advantage with MRI is that re-test effects are likely to be minute, and follow-up examinations at short intervals are highly feasible. With high-quality MR-scans and state-of-the-art analysis tools (Reuter et al., 2010, Holland and Dale, 2011, Holland et al., 2012b, Reuter et al., 2012), brain changes can be detected reliably and monitored over intervals as short as one year or less even in healthy elderly (Fjell et al., 2009a, Murphy et al., 2010). Although longitudinal studies cannot fully replace cross-sectional studies in brain aging research for a number of practical reasons, such as the relatively short life-expectancy of MR-scanners and continual advances in technology, repeated MRIs yield a unique tool to monitor brain changes naturally occurring among older adults.
Reductions in gross brain volume over time are now well-documented, with annual decreases on the order of 0.2 – 0.5% (Scahill et al., 2003, Ezekiel et al., 2004, Enzinger et al., 2005, Fotenos et al., 2005, Hedman et al., 2012). Significant longitudinal change has been observed across almost the entire cerebral cortex (Driscoll et al., 2009, Fjell et al., 2009a), but with substantial heterogeneity across regions. Traditionally, the frontal lobes have been regarded as especially vulnerable to normal age-changes, inspiring frontally-based theories of cognitive aging (West, 1996, Robbins et al., 1998, Rabbitt, 2005). Evidence is accumulating, however, that in healthy older adults, temporal areas undergo reductions over time of comparable magnitude to the frontal changes (Driscoll et al., 2009, Fjell et al., 2009a, Raz et al., 2010, Pfefferbaum et al., 2013). Annual atrophy rates of 0.79% to 2.0% for the hippocampus (Jack et al., 1998, Scahill et al., 2003, Ezekiel et al., 2004, Raz et al., 2005, Du et al., 2006, Fjell et al., 2009a) and of 0.3% to 2.4% for the entorhinal cortex (Du et al., 2003, Ezekiel et al., 2004, Raz et al., 2005, Du et al., 2006, Fjell et al., 2009a) have been reported. Thus, age-related atrophy is not restricted to the frontal lobes.
Age-related changes in cortical volume are illustrated in Figure 2, which shows one-year percentage change in healthy elderly participants from the Alzheimer’s Disease Neuroimaging Initiative (ADNI) (see www.adni-info.org). These participants remained free of a mild cognitive impairment (MCI) or AD diagnosis for three years following the baseline scan. As can be seen, cortical volume reductions are found across most of the brain surface, with annual change rates of around 0.5% in most regions. Figure 2 also shows this annual change expressed in standard deviations, highlighting the relative degree of change across different regions (Z-transformed maps). The frontal and the temporal lobes stand out with the highest degree of relative change, with substantial change observed also in the medial parietal area (precuneus and the adjacent retrosplenial and posterior cingulate cortices). This predominant fronto-temporal pattern of atrophy is in accordance with the results of several independent longitudinal studies using different methods for quantification of brain change. As we discuss below, this has implications for how we should understand the macro-structural correlates of decline in specific cognitive abilities in normal aging, and how we should conceptualize the differences between normal aging and age-related neurodegenerative disease like AD.
Figure 2. Longitudinal cortical volumetric reductions in aging.
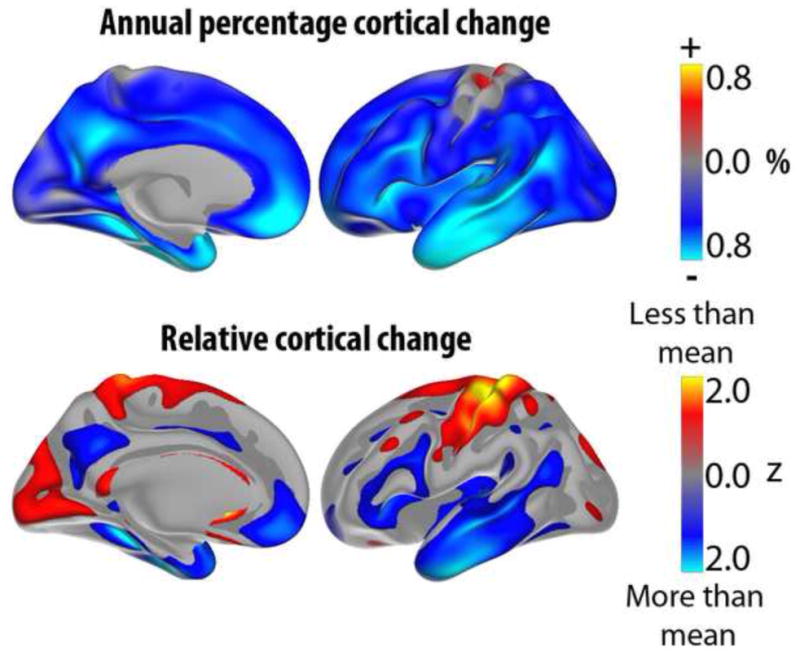
Upper panel shows annual percent volume reduction of the cerebral cortex in a longitudinal sample of 132 healthy elderly (55–91 years at baseline) from ADNI (Alzheimer’s Disease Neuroimaging Initiative). Lower panel shows the same data, but the values have been re-scaled to yield a mean of zero and a standard deviation of one, to allow better visualization of regional distribution of change. Blue-cyan colors represent areas that are reduced more in one year than the rest of the cortex, while red-yellow colors represent areas of less than average reduction. The often-observed fronto-temporal pattern of relative increased atrophy is evident, with medial parietal cortex/posterior cingulate as additional regions with high rates of atrophy in aging. Data from (Fjell et al., 2013a).
Longitudinal studies can track within-person changes in brain structures over time. However, no longitudinal MR-studies can follow the same participants over extended time-periods.. Thus, to investigate the effect of age across the life-span on brain changes, combinations of longitudinal and cross-sectional designs seem to be the optimal solution. Among such studies, several have found modest acceleration of regional decline with increasing age (Raz et al., 2004a, Raz et al., 2004b, Raz et al., 2005, Du et al., 2006, Driscoll et al., 2009, Fjell et al., 2009a, Raz et al., 2010, Schuff et al., 2010, Thambisetty et al., 2010, Holland et al., 2012a, Taki et al., 2013, Pfefferbaum et al., 2013). Thus, there is a tendency that the rate of atrophy in specific brain regions is higher in older adults than in middle-aged adults. However, very few longitudinal studies have sampled the entire adult life-span, and this hinders direct comparisons between young and older adults although important exceptions exist (e.g. (Raz et al., 2005, Taki et al., 2013, Pfefferbaum et al., 2013)). This is the major strength of the cross-sectional design. Dozens of cross-sectional studies have reported that different macro-structural measures of the cerebral cortex are negatively correlated with age across the adult lifespan. Negative correlations between cortical thickness and age have been reported in all regions (Fjell et al., 2013d), exceeding −.70 in the most vulnerable areas. As long as the MR scans are of good quality, the method used to quantify cortical reductions is identical and the sample size is reasonably large, high consistency can be observed across studies (Fjell et al., 2009b). In Figure 3, Pearson correlations between age and cortical thickness in a large sample of healthy adults are shown. Strong correlations are seen in the frontal cortex, both laterally and medially, but also in other regions, such as the lateral temporal cortex.
Figure 3. Age-thickness correlations.
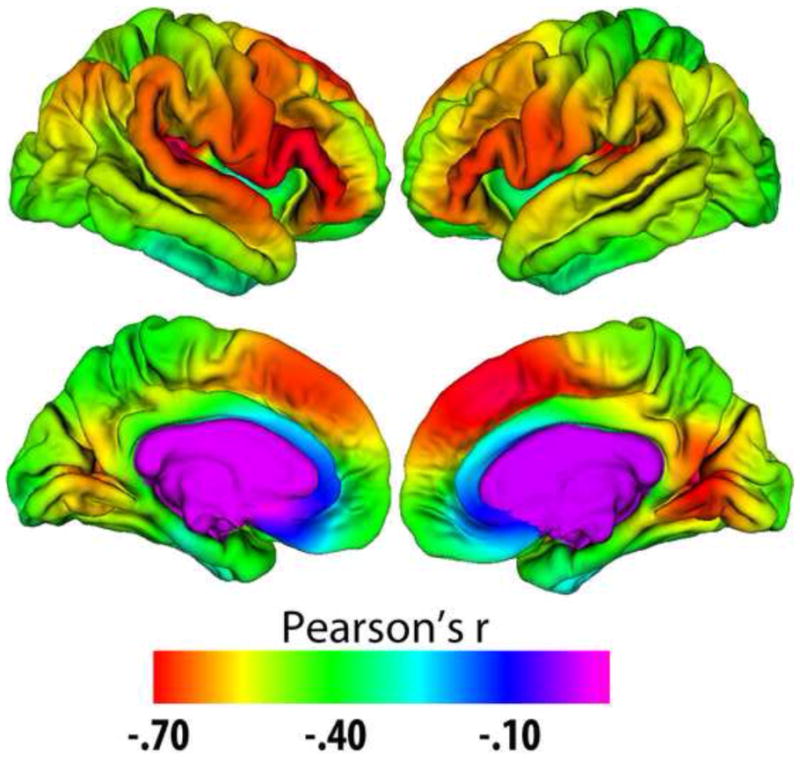
Correlations between age and cortical thickness in a healthy multi-site adult life-span sample (n = 1100, age 18–94). Correlations exceed −.40 in large regions, approaching −.70 in the prefrontal and lateral temporal cortex. Data from (Fjell et al., 2012).
Cross-sectional studies of cortical thickness and volume usually find mainly linear age-relationships, although tendencies towards accelerating or reduced estimated decline with increasing age are sometimes reported for specific regions, such as accelerated decline of the entorhinal and the lingual cortex with age, and decreasing decline in anterior parts of the cingulate (Fjell et al., 2013d) (see Figure 4). This is in contrast to the trajectory for hippocampal volume, which almost invariably shows accelerated decline with higher age across studies. In Figure 5, typical age-trajectories for the volume of the hippocampus and for the rest of the cerebral cortex observed in cross-sectional studies are illustrated. While total cortical volume declines almost linearly from 20 years, hippocampus is relatively stable until about the age of 60 years, after which the trajectory indicates prominent loss.
Figure 4. Accelerated entorhinal decline in aging.
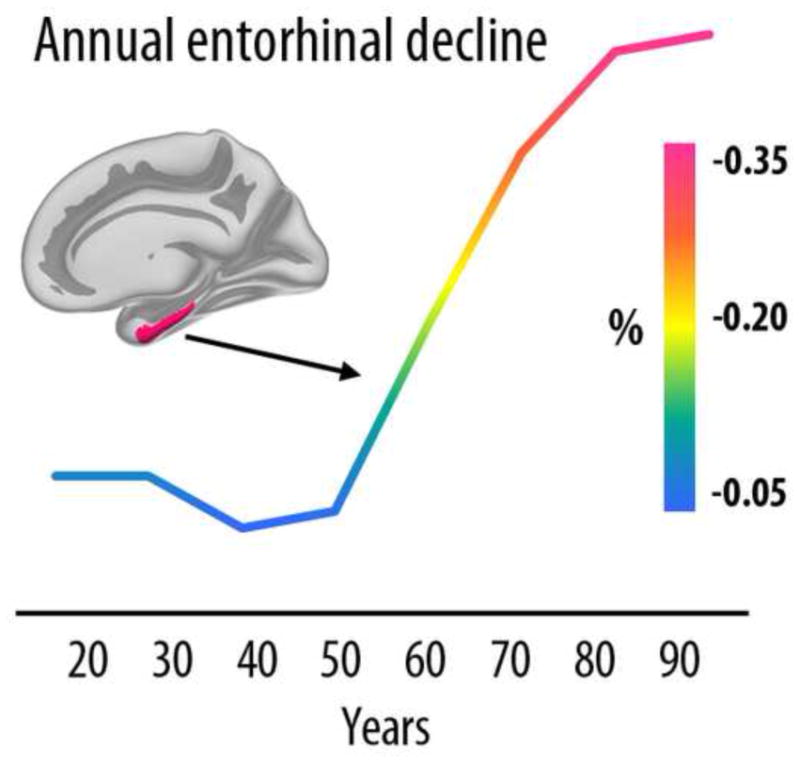
Cross-sectional estimates of annual rate of cortical thinning in the entorhinal cortex across the adult life indicate a marked increase in atrophy from 50 years. Age-related acceleration of decline in elderly has been confirmed with longitudinal data. Data from (Fjell et al., 2012).
Figure 5. Life-span trajectories of volumetric reductions.
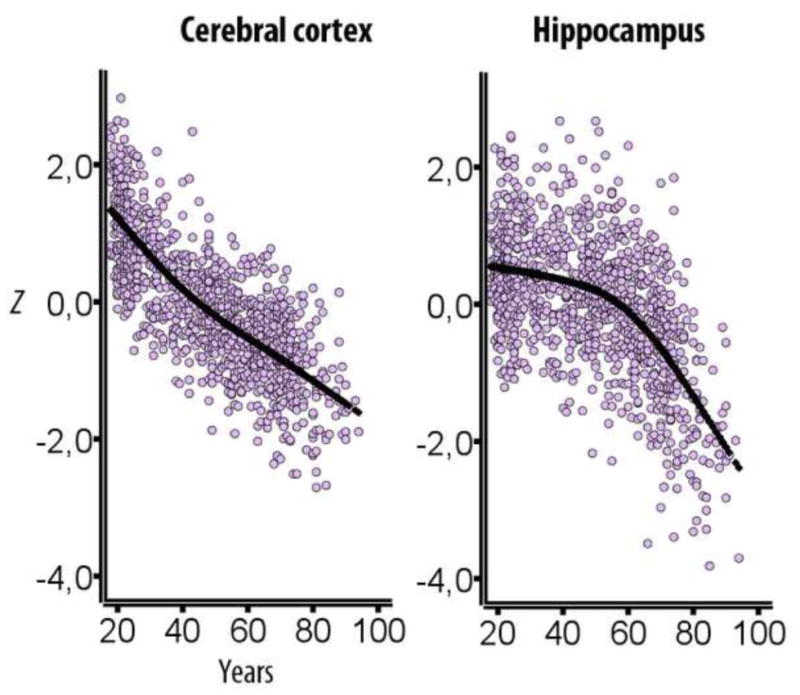
Cross-sectional estimates of adult life-span trajectories of total cerebral cortex volume and total hippocampal volume. Volume is expressed in units of standard deviations. Data from (Fjell et al., 2013c).
More longitudinal studies including participants from the entire adult lifespan are expected, and will likely advance our knowledge about this critical question over the next few years. A challenge, however, is that the potential cross-sectional fallacy of covariance between sampling bias and age, i.e. that the oldest participants are not representative of the younger population, will carry over to the combined cross-sectional and longitudinal design. However, a way to account for this effect by use of multiple samples has been suggested (see e.g. (Schaie and Hofer, 2001)).
Two recent studies have used longitudinal data to demonstrate flaws in apparent cross-sectional trends. Nyberg et al. followed a sample of elderly over six years, measuring brain activation during a semantic categorization task (Nyberg et al., 2010b). The cross-sectional analyses indicated frontal over-recruitment in aging. In contrast, the longitudinal analyses revealed frontal reductions over time, and showed that the cross-sectional over-recruitment could be accounted for by a select sample of high-performing elderly. We recently made a similar observation in a combined longitudinal and cross-sectional study of cortical thickness change in aging (Fjell et al., 2013d). In a sample of healthy elderly adults from ADNI, we observed a positive correlation between thickness and age in the cingulate cortex, especially the anterior parts. This has been found previously in several independent cross-sectional samples (Salat et al., 2002, Fjell et al., 2009b). However, when we examined the follow-up data for the same participants, consistent thinning was found throughout the cerebral cortex, including the entire anterior cingulate. The results are illustrated in Figure 6. In addition, there was a general down-scaling of estimated change in the cross-sectional compared to the longitudinal results. This indicates that cross-sectional studies may under-estimate rather than exaggerate real change, an observation also made previously (Raz et al., 2005). Similar observations have been made for cognitive functions like episodic memory, where cross-sectional studies have found almost linear decline from 20 to 80 years of age but practice-adjusted longitudinal data have shown preservation of function until 60 years of age (Nyberg et al., 2012). Actually, if the true age-trajectory is non-linear, cross-sectional results may over-estimate the age-effect in the first part of adult life and under-estimate it in the second part.
Figure 6. Cross-sectional vs. longitudinal results.
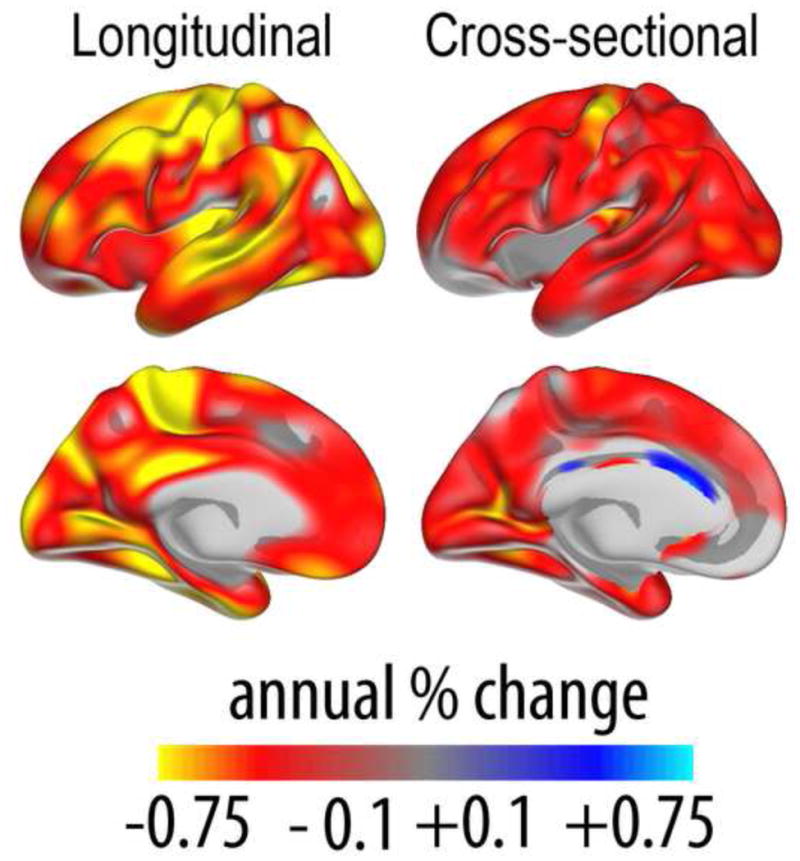
Left panel shows percentage annual change in cortical thickness measured longitudinally in a sample of healthy elderly (n = 207, 60–93 years). The right panel shows percentage annual change in cortical thickness estimated cross-sectionally in the same sample of participants. As can be seen, the apparent thickening of the anterior cingulate cortex in the cross-sectional analyses is not confirmed by the longitudinal results, indicating that this likely arises from issues with selective sampling. Also, estimated change is smaller in the cross-sectional compared to the longitudinal results. In other respects, the results are more similar. Data from (Fjell et al., 2012).
With such discrepancies between cross-sectional and longitudinal results in mind, it is important to be cautious about inferences from one to the other. Still, the differences are not always as prominent as in these examples, and cross-sectional and longitudinal results often converge (Fjell et al., 2013d). Thus confirming results by use of both cross-sectional and longitudinal analyses will strengthen conclusions.
2.2 How best to quantify brain change?
Surface-based segmentation techniques allow structural cortical changes to be measured along several different dimensions, such as thickness, area, volume, gyrification and signal intensity or gray matter – white matter contrast. In recent years, more researchers have been conscious of the differences between these measures. Volume is the more complicated measure to interpret, since it is the product of two genetically independent metrics (thickness and area) (Panizzon et al., 2009), and is affected by fundamentally different neurobiological properties during development and evolution (Rakic, 2009, Rakic et al., 2009, White et al., 2010). Area has expanded tremendously during evolution, without comparable increase in thickness: a twofold difference in cortical thickness between rodents and primates does not measure up to the 1000-fold difference in total cortical surface area between mice and humans (Rakic, 2009). In human adults, weak (Winkler et al., 2010) or even negative (Hogstrom et al., 2012) correlations between thickness and area have been observed. It has been suggested that myelin growth, both intracortically and in subcortical regions, may stretch the cortex tangentially to the surface (Seldon, 2005). This is hypothesized to contribute to disentangling of neighboring neuronal columns and enabling the relevant parts of the cortex to better differentiate afferent signal patterns increasing functional specialization (Seldon, 2007). This model provides one possible mechanistic and functional account for a negative relationship between cortical thickness and surface area. Few studies have systematically compared differences in age-vulnerability between cortical thickness, area and volume, but there are indications that thickness is more affected than area (Hogstrom et al., 2012) (see Figure 7). In sum, although volume may be a sensitive measure of atrophy and age-related differences, the underlying neurobiological causes leading to volume reduction are difficult to identify due to the independence of the two constituting measures of cortical thickness and area.
Figure 7. Different effects of age on cortical surface area, thickness and gyrification.
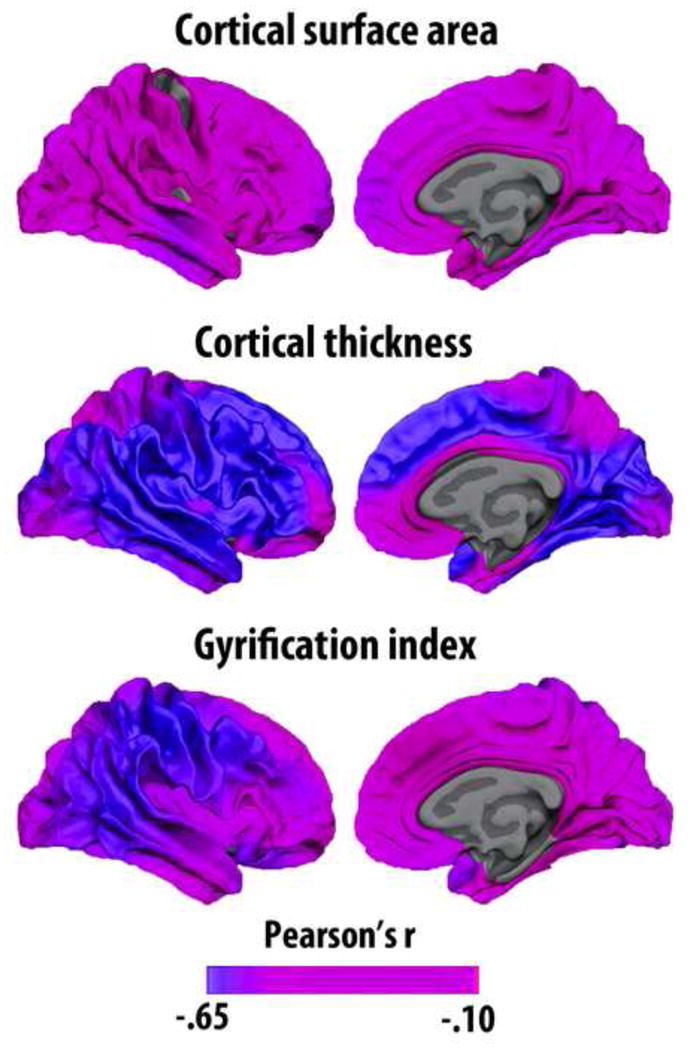
Different structural features of the cerebral cortex have different genetic architecture and are reflecting different neurobiological events. Cortical surface area, thickness and gyrification are all negatively related to age, but to a different degree and with somewhat different regional distribution of effects. The results are displayed on the white matter surface of the brain. Gyrification index is defined as the ratio between the buried cortex and the visible, outer surface cortex. Data from (Hogstrom et al., 2012).
There is discussion about whether changes in glucose metabolism in aging as evidenced by [F-18]fluorodeoxyglucose positron emission tomography (FDG-PET) occurs prior to, at the same time as, or is a consequence of atrophy. While this discussion is outside the scope of this paper, it can be noted that glucose metabolism is reduced in normal aging, e.g. in anterior regions such as the anterior cingulate (Yoshizawa et al., 2013), and it is suggested that hypermetabolism in specific regions, e.g. anterior cingulate, as well as functional connectivity, are positively related to of cognitive reserve (Arenaza-Urquijo et al., 2013a). However, the relationship between degeneration, cognitive function and metabolism is not simple, as other studies have found hypermetabolism in amyloid positive non-demented elderly, e.g. in the bilateral superior temporal gyrus (Johnson et al., 2013). In a comprehensive study of age-changes in atrophy and metabolism based on the ADNI database, age- and symptom-severity dependent glucose metabolism both in temporal, parietal and precuneus regions was found in a sample of AD patients and healthy controls (Dukart et al., 2013). The authors further suggested a dissociation with larger effects on metabolism compared to atrophy in early phases of AD and the opposite pattern at more advanced stages. Targeted investigations into the relationship between changes in metabolism and atrophy has the potential to yield important insights into the cerebral changes in normal aging and their cognitive correlates.
2.3 Principles of regional cortical age-changes: Development and evolution
As reviewed above, cortical reductions are relatively global in normal aging, not being confined to specific regions. Still, substantial heterogeneity is seen, with several studies identifying fronto-temporal areas as especially prone to the effects of aging. Attempts have been made to explain the regional differences in age-vulnerability based on different overarching principles. While some of these proposed principles capture critical aspects of brain aging, all also have substantial weaknesses. One popular view is that late-maturing regions are most vulnerable to age-changes, often referred to as the “last in, first out” or “retrogenesis” hypothesis. These areas tend to have a more complex cortical architecture than areas that develop early. The finding that late-maturing medial frontal areas, such as the medial orbitofrontal cortex (Gogtay et al., 2004, Tamnes et al., 2012), are highly vulnerable to aging has lead to the hypothesis of an anterior-to-posterior gradient of age vulnerability, which has been invoked to explain the decline in executive function often observed in healthy elderly samples (Gunning-Dixon and Raz, 2003, Head et al., 2009). For instance, while degeneration of the medial temporo-parietal memory network is characteristic for AD, change in a fronto-striatal network supporting executive functions has been proposed as a hallmark of healthy aging (Buckner, 2004, Head et al., 2005) (see Figure 8). Decline of executive functioning can impact memory function, and contribute to memory problems in non-demented elderly. This can occur even in MCI patients. It has been shown that MCI patients with higher executive function perform better on episodic memory tests, with higher memory performance related to thicker cortices in regions outside the medial temporal lobe, including prefrontal regions (Chang et al., 2010). From this view, even though reduction in episodic memory function is seen in both AD and healthy aging, this reduction could have partially different brain structural causes. Thus, the “last in, first out” model has many similarities to the traditional “frontal theory of aging” (West, 1996, Robbins et al., 1998, Rabbitt, 2005).
Figure 8. Fronto-striatal vs. temporo-parietal networks.
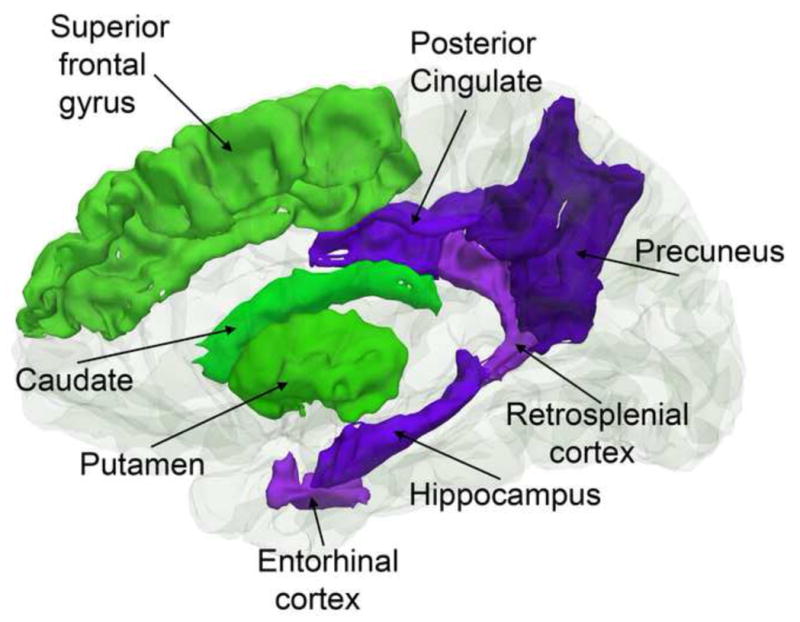
While normal aging affects both a fronto-striatal network important for cognitive control and executive function (green structures), AD has additional effects on a temporo-parietal network important for episodic memory function (purple structures).
Although the “last in, first out” model is consistent with some of the data on brain aging, there are important discrepancies between the available data on cortical maturation and aging. This becomes especially evident when maturation and aging of the medial temporal lobes are compared. Medial temporal lobe structures are typically found to undergo relatively modest maturation after school age is reached (Shaw et al., 2008, Ostby et al., 2009, Tamnes et al., 2012, van Soelen et al., 2012), yet are strongly impacted by age, especially after 60 years (see Figures 4 and 5). Thus, in this respect, “the last in, first out” theory of brain maturation does not account for one of the most important features of cortical brain aging – the vulnerability of medial temporal regions.
The ”last in, first out” hypothesis is based on a view that more complex brain areas, supporting higher-order cognitive functions such as executive functions, take longer to develop, follow more complex developmental trajectories (Shaw et al., 2008) and are more vulnerable to the negative effects of normal aging. A version of this hypothesis takes human evolution as a starting point instead of ontogenetic development, applying the same principles of cortical complexity and age-vulnerability. Human cortical surface area has expanded tremendously during evolution (Kaas, 2008), more than what can be explained by body size alone – a phenomenon referred to as encephalization (Fonseca-Azevedo and Herculano-Houzel, 2012). The adaptive benefits of improved general intellectual function likely underlie this expansion (Gibson, 2002, Sherwood et al., 2008). Cortical expansion during evolution is spatially heterogeneous, with large scaling effects in some regions and minute effects in others (Van Essen and Dierker, 2007). Interestingly, Hill et al. recently demonstrated similarities between cortical expansion in evolution and development (Hill et al., 2010) - evolutionary high expanding cortical areas tended to show high developmental expansion in childhood, suggesting that evolutionary factors have shaped ontogenetic cortical development. To a certain extent, cortical regions supporting mental capacities in which humans excel compared to other primates have expanded the most (Haug, 1987, Sherwood et al., 2008, Fjell et al., 2013b), and it has been suggested that human-specific cognitive adaptations are correlated with enlargement of the neocortex (Sherwood et al., 2008). Thus, it is possible that high-expanding cortical regions during evolution will have a protracted ontogenetic developmental course, tend to support higher-order late-maturing cognitive functions, and be more vulnerable to decline in normal aging.
In Figure 9, cortical area expansion maps from macaque to humans, previously published in (Bardet et al., 2007, Hill et al., 2010), and longitudinal atrophy maps from healthy ADNI participants, are projected onto the same cortical surface and displayed on the same scale (Z scores). As can be seen, there is overlap between high-expanding cortical areas during evolution and areas that undergo rapid decline during normal aging. Contrasting annual percentage decline in regions of high, medium or low evolutionary expansion revealed clear differences in a dose-dependent manner. Annual percentage change in cortical volume increase from 0.23 to 0.41 and 0.53 from low to medium to high expansion regions. Overlap between evolutionary expansion and cortical age-vulnerability was most prominent on the lateral surface, with high expansion and high rate of atrophy in the lateral temporal cortex, inferior regions of the parietal cortex and most of the lateral prefrontal cortex.
Figure 9. Evolutionary expansion and volume decline in aging.
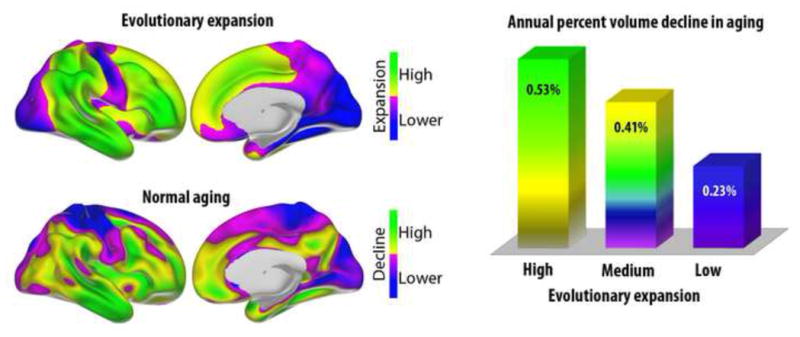
Upper panel shows regions of high vs. lower cortical expansion from macaque monkeys to humans (maps re-computed from (Hill et al., 2010)). Lower panel shows regions of high vs. lower volumetric reduction in aging (based on the data from Figure 2). There is overlap between evolutionary high-expanding regions in temporal and frontal cortex and regions with high decline in aging. The right panel shows annual volumetric decline in regions of high (z ≥ 0.5 SD), medium (−0.5 < z < 0.5) and low (z ≤ −0.5) evolutionary expansion. As can be seen, annual decline in aging is related to degree of expansion during evolution (for all comparisons, p < .05, corrected).
Medially, however, there are important differences. High expansion and high rate of atrophy are seen in parts of the superior frontal cortex and the anterior cingulum. Interestingly, the medial temporal lobes, including entorhinal and parahippocampal cortices, as well as posterior cingulate/retrosplenial cortex and the precuneus, show a high degree of decline in normal aging, but relatively low expansion during evolution. Also, the most anterior part of the cingulate cortex, the subgenual cortex (Broadman area 25) shows substantial age-decline without high evolutionary expansion. Several of these areas belong to the allocortex or archicortex, which is phylogenetically older and has a cellular organization that deviates from the typical six-layered structure of most of the rest of the neocortex. For instance, parts of the cingulate cortex have a less distinct laminar differentiation (Vogt et al., 1995), lacking the internal granular layer (IV). These evolutionary low-expanding, age-vulnerable cortical regions overlap well with the Papez circuit, important in normal memory function, and also with areas previously found to show simpler developmental trajectories (Shaw et al., 2008).
A note of caution must also be included in a discussion of phylogenetic brain expansion, because it is challenging to draw inferences about brain evolution from inter-species comparisons. For instance, it has been argued that comparison of proportional size of different brain areas across species conflate selective enlargement with allometric scaling, and consequently that it is invalid to infer that humans are specialized for frontal lobe functions in particular compared to other species (Barton and Venditti, 2013). Due to allometric constraints on connectivity caused by the fast increase in white matter during evolution, prefrontal volume is be expected to take up a higher proportion of the brain in humans than in non-human primates with smaller brains. In a recent paper, Barton and Venditti argued that the widely held assumption that human brain evolution involved relative expansion of the frontal lobes may lack support, and that “… unless one is willing to take seriously the hypothesis that lemurs have more of the qualities bestowed by the frontal cortices than do humans, or that llamas possess more than monkeys, it must be concluded that testing the hypothesis that any species is specialized for frontal functions (…) requires scaling to be taken into account.” (Barton and Venditti, 2013) (p. 9001–9002).
2.4 Principles of regional cortical age-changes: Default Mode Network
Interestingly, the more recently described default mode network (DMN) is almost completely encapsulated in the high-declining regions in Figure 2. DMN (Raichle et al., 2001) has received much attention recently (Snyder and Raichle, 2012), and its robust appearance across studies indicates that it plays a major role in human brain function (Buckner, 2012). For a delineation of some important DMN regions, see Figure 10. The DMN consists of a specific set of brain areas that decrease activity during performance of a wide range of tasks, and that are typically also active also during periods of rest or introspection (Snyder and Raichle, 2012). The different DMN structures are densely interconnected to each other and limbic structures by polysynaptic connections, with few connections to sensory and motor areas (Binder et al., 2009, Buckner, 2012). Structural and functional aspects of DMN are affected both in normal aging (Lustig et al., 2003, Andrews-Hanna et al., 2007, Addis et al., 2011) and AD (Greicius et al., 2004, Walhovd et al., 2010, Jones et al., 2011). DMN maps onto a network of core brain areas involved in episodic memory and imagination (Buckner and Carroll, 2007, Schacter et al., 2007), and is therefore highly relevant for the understanding of episodic memory problems in aging. Recent normative studies (Laird et al., 2009, Andrews-Hanna et al., 2010) have pointed to at least seven important regions within the default mode and episodic memory/simulation network: rostral middle frontal, inferior parietal cortex and middle temporal cortex on the lateral side, and medial orbitofrontal cortex, precuneus, entorhinal cortex and the hippocampus on the medial side (although the roles played by hippocampus and enthorinal cortex are debated (see (Nyberg et al., 2010a, Squire et al., 2010, Cooper et al., 2011, Yeo et al., 2011)). Early on it was suggested (Andreasen et al., 1995) that the network primarily consists of association cortices that have undergone especially large evolutionary changes from nonhuman primates to humans, have the most complex columnar organization and are slow to reach mature levels of myelin (Catani and ffytche, 2005). However, while this is true for some of the structures involved, especially on the lateral surface as shown above, a characterization of the DNM structures overall as unique to higher-order evolution would not be correct. Rather, some of these structures, such as the hippocampus, the entorhinal cortex and the retrosplenial cortex, share considerable similarities, likely both structurally and functionally, across several species. These structures belong to the medial temporal lobe DMN subsystem (Andrews-Hanna et al., 2010), critical for the ability to navigate in space in many species. At the same time, this is a capability that is affected relatively early in AD. Also the medial parietal cortex, including the precuneus, belonging to the midline core of the DMN in the same classification, has expanded relatively little during evolution (see Figure 9). Thus, there are considerable areas anatomically not overlapping across the DMN and evolutionary cortical expansion maps. Although DMN likely serves important functions for human cognition and mental life, resting-state networks overlapping the midline core of DMN have also been identified in monkeys. In a recent study, functional networks were directly compared between humans and monkeys, and both inter-species corresponding and human-specific networks were identified (Mantini et al., 2013). In sum, the theory of DMN as localized in evolutionary recent cortical areas does not seem justified.
Figure 10. Aging of the default mode network.
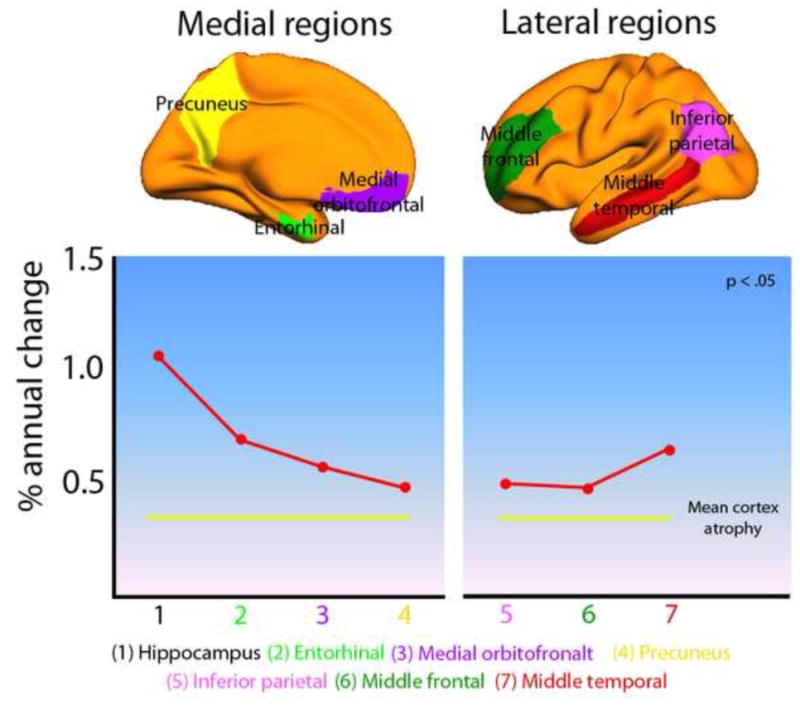
Annual percentage change in brain volume for six selected areas of the default mode network (DMN) in 132 healthy elderly (based on data from Figure 2). Both the medial and the lateral DMN changed significantly more than the whole brain rate of 0.44% (mean atrophy in the medial DMN: 0.70%, t [131] = 4.75, p < 10−5; mean atrophy in the lateral DMN: 0.53%, t [131] = 2.10, p < .05). Compared to the average cortical change (not including hippocampus) of 0.39%, the age-vulnerability of DMN is even larger.
Naturally, DMN is a prime target for investigation into the structural correlates of reduced cognitive function in both normal aging and AD. As can be seen from Figure 10, rates of yearly cortical volume reduction in these areas are higher than in most other cortical regions, indicating that the DMN is vulnerable to normal aging. This is also true for the posterior cingulate/retrosplenial/precuneus and MTL, which have been relatively low-expanding in evolution. A speculative suggestion may be that these areas support fundamental aspects of episodic memory that would have large adaptive benefits during early evolution, such that they are relatively well developed even in non-human primates. Recent studies have compared resting state (Hutchison and Everling, 2012) and task-related functional networks between humans and non-human primates (Mantini et al., 2012, Miyamoto et al., 2013), showing functionally correspondent networks across species. Corballis recently argued for the existence of evolutionary continuity in the capacity for mental time travel (Corballis, 2013a, b), which is closely connected to hippocampal and medial parietal cortical function. Although the discussion of whether this capacity exists in non-human primates is far from settled (Suddendorf, 2013), a natural conclusion from available evidence is that DMN is vulnerable to age-changes for reasons not grounded in evolutionary expansion.
Several studies have shown that longitudinal brain changes especially in MTL are correlated with changes in cognitive capacities, episodic memory function in particular (Rodrigue and Raz, 2004, Murphy et al., 2010, Persson et al., 2012, Fjell et al., 2013d, Nyberg et al., 2012). Thus, the DMN seems to provide a better account of the distribution of structural cortical changes in normal aging than the frontal or the “last in, first out” theories. Of special interest is the vulnerability of DMN to AD (Lustig et al., 2003), and the high overlap between DMN and areas of Aβ deposition and PET-FDG hypo metabolism (Buckner et al., 2005). We discuss this in more detail in Section 4.
3. Normal aging versus Alzheimer’s Disease: How to tell the difference?
Age-related dementia typically has a slow and gradual onset, with atrophy manifest years in advance of clinical symptoms (Davatzikos et al., 2009, Jack et al., 2010a, Jack et al., 2013). Some have even suggested that cortical decline in aging is caused by undetected disease and is not a feature of normal aging (Burgmans et al., 2009). An important implication of the apparent temporal gap between detectable cerebral and cognitive expression of dementia is that cases with undetected disease in presumably normal samples could bias inferences about normal brain aging (Sliwinski and Buschke, 1999). This is a particular concern since the proportion of elderly with undetected neurodegenerative disease is expected to increase with the age of the population, potentially leading to invalid conclusions of accelerated age-related decline in cortical areas vulnerable to disease pathology, especially the entorhinal cortex and hippocampus (Braak and Braak, 1985, Jack et al., 1997, McDonald et al., 2009). However, it is also possible that stringent screening criteria could result in an over-representation of very high-functioning elderly in convenience samples (Nyberg et al., 2010b), thereby reducing the amount of incipient dementia in aging-studies of the oldest old. The contribution of latent pathology to age-related decline in apparently normal aging thus remains an open question. However, differences in AD biomarkers, such as patterns of atrophy and amyloid deposition may shed light on this issue.
The pattern of atrophy in AD is not random, but usually evolves slowly, following a specific pathway that first involves the entorhinal cortex and the hippocampus, then spreads out to association areas in medial parietal, lateral temporal and frontal regions, eventually affecting all regions of cortex. In Figure 11, rate of atrophy in healthy controls versus patients with MCI or AD from ADNI is shown. Even at the stage of MCI, annual atrophy is several times higher than in normal aging, with further increases in atrophy rate with progression to a full AD diagnosis.
Figure 11. Differences in cortical atrophy rates between healthy elderly and Mild Cognitive Impairment/Alzheimer’s Disease.
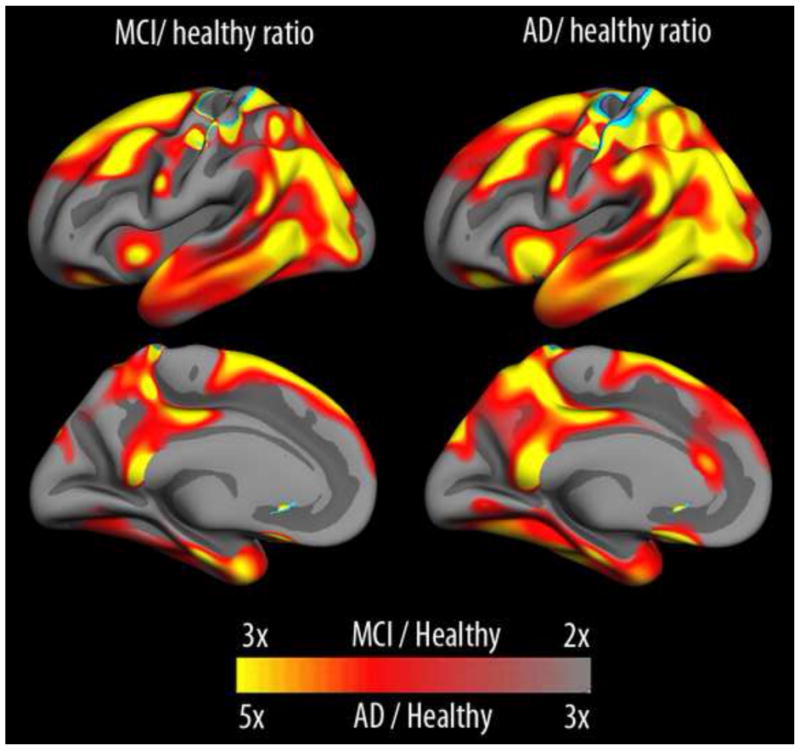
In mild cognitive impairment (MCI), rates of cortical volumetric reductions are more than double that seen in healthy aging across large areas of the cerebral cortex, and rates more than three times larger are seen in AD. Please note that the scale is different between MCI/healthy and AD/healthy to allow appreciation of the regional patterns of effects across groups. Data from the Alzheimer’s Disease Neuroimaging Initiative.
The organized pattern of brain changes in early AD can be used to differentiate between non-demented elderly with lower vs. higher risk of progression to MCI or AD (Driscoll et al., 2009, McEvoy et al., 2009, McEvoy et al., 2011). For instance, Driscoll and colleagues identified a pattern of brain changes typical for AD patients, including temporal and orbitofrontal cortex, and argued that the differential patterns of decline in participants who subsequently developed MCI differed from that of participants who remained cognitively stable. The finding that both those who progress to AD and those who remained cognitively stable showed accelerated tissue loss indicates that atrophy does not necessarily signify impending dementia, and thus may not necessarily reflect latent AD. Likewise, McEvoy and colleagues used linear discriminant analysis to identify a pattern of regional atrophy by comparing healthy controls with AD patients, and found accelerated atrophy in the temporal cortex, isthmus of the cingulate and orbitofrontal cortex. These results could later be used to predict conversion to AD in ADNI’s MCI participants.
These two examples show that magnitude of atrophy in collections of brain areas can be used to distinguish normal aging from AD. Still, when looking at atrophy maps in normal aging, e.g. Figure 2, it is evident that temporal regions, both medial and lateral, are among those that decline the most. Even though hippocampus and entorhinal cortex are the areas that best distinguish AD from controls in terms of atrophy rates (Fjell et al., 2010b), and these temporal areas figured prominently in the AD risk patterns in the studies described above, low-risk elderly also show accelerated change in these areas. Similar results have been reported for hippocampus in several independent studies (Driscoll et al., 2009, Fjell et al., 2009a, Raz et al., 2010, Pfefferbaum et al., 2013). Thus, MTL atrophy is common in normal aging and AD. This is illustrated in Figure 12 (Fjell et al., 2013a). When the large differences in magnitude of atrophy are removed by standardizing the atrophy maps within each diagnostic group, two interesting features become apparent. First, both the low-risk healthy elderly and MCI/AD patients are characterized by elevated atrophy in the temporal lobes, medially and laterally. Atrophy in the temporal lobe exceeded two standard deviations above mean cortical atrophy in all groups. A second interesting feature is the relatively high level of atrophy in the orbitofrontal cortex in the normal controls. In the patients, these areas do not stand out as more atrophic than the rest of the cortex. Thus, the fronto-temporal pattern of atrophy in the low-risk elderly is replaced by an even more distinct temporal pattern of atrophy in the patients. Relatively high levels of atrophy in the medial parietal cortex, i.e. precuneus and posterior parts of the cingulate, were also seen across groups. Of interest, the accelerated prefrontal atrophy in the healthy group overlaps with one of the cortical regions that has expanded the most during evolution, while not being among the regions most vulnerable to early AD. Thus, it seems that evolutionary expansion, even with the discrepancies found in the medial temporal cortex, characterizes the brain changes in healthy aging better than the atrophy seen in early AD.
Figure 12. Comparison of aging and Mild Cognitive Impairment/Alzheimer’s Disease.
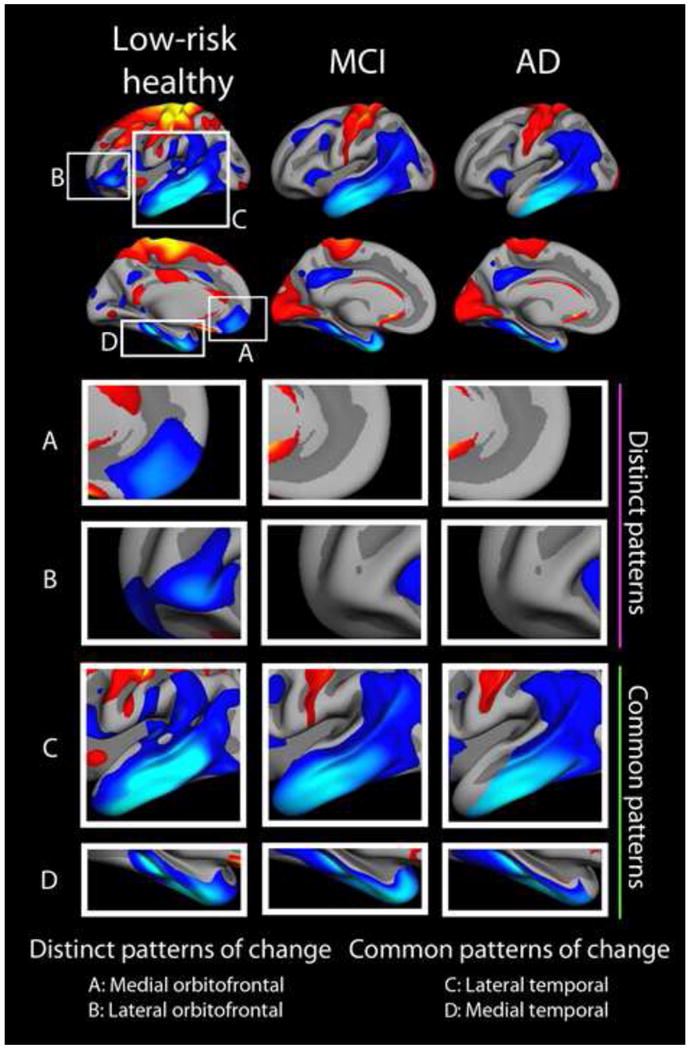
Comparison of the standardized pattern of atrophy in a group of APOE ε4 negative elderly with normal levels of CSF Aβ, mild cognitive impairment (MCI) and AD. Atrophy maps are standardized within each group by Z-transformation, yielding maps showing areas of more (blue-cyan) vs. less (red-yellow) atrophy for each group in terms of standard deviations. Thus, atrophy is scaled within group, and changes are relative to group means. Across groups, we see common patterns of standardized change in the lateral and medial temporal lobe (including the hippocampus, not shown), and a distinct pattern characterizing only healthy elderly in the prefrontal cortex, especially the orbitofrontal part. Figure from (Fjell et al., 2013a). Atrophy across the cortex in the healthy elderly and the AD patients correlated .81, showing substantial overlap in regional vulnerability.
The vulnerability of the temporal lobes in aging and AD naturally prompts the question of whether brain-changes observed in non-demented older adults are in part caused by undetected neurodegenerative processes of an Alzheimer type. At age 79, the probability of significant AD neuropathological changes in the brain is 30–40%, but the likelihood of having been diagnosed with dementia due to AD is only 15% (Nelson et al., 2012). Subtle cognitive symptoms have been identified more than 10 years before dementia diagnosis (Elias et al., 2000), and the currently popular hypothetical biomarker model suggests that brain changes are detectable before the first cognitive symptoms (Jack et al., 2010a, Jack et al., 2013). Thus, the question of whether brain atrophy in typical AD areas, i.e. the temporal lobes, can be attributed to preclinical manifestations of the disease is not a trivial one. However, there are several pieces of evidence indicating that these brain changes indeed constitute a part of normal, non-disease specific aging.
First, Resnick and colleagues followed 92 healthy elderly from the Baltimore Longitudinal Study of Aging for four years, and found significant reductions in brain volume in all cortical lobes (Resnick et al., 2003). Of most interest, these changes were also seen in a subgroup of 24 very healthy participants who experienced no medical condition or cognitive impairment four years after the initial examination. The authors argued that the uniformity of tissue loss across individual participants indicated that these were not pathological changes associated with preclinical dementia, unless all participants had been in such a preclinical stage, which is highly unlikely. Thus, these results constitute evidence that tissue loss in older adults does not need to be caused by undetected, preclinical dementia. A similar conclusion was drawn in the later study by the same group where participants were followed for periods up to ten years after baseline, furthering ruling out the possibility that all participants were in a preclinical stage of AD (Driscoll et al., 2009).
Second, in our own work, we have focused specifically on the fate of AD-prone areas in healthy controls, and attempted to disentangle normal age-changes from changes related to preclinical AD. We quantified one-year cortical thinning in 138 normal elderly from ADNI, and found the expected reductions in the temporal lobe, including the medial temporal lobes and the entorhinal cortex (Fjell et al., 2013d). From the full sample of non-demented participants, subsamples with very low probability of AD were identified. A group of cognitively “super-stable” participants (n = 18) were selected based on a lack of decline over two years on scores of two clinical measures and seven neuropsychological tests. Another group was selected based on their negative CSF Aβ test (n = 28). A final group consisted of those that were both amyloid negative and negative for APOE ε4 (n = 22). Interestingly, rate of cortical thinning in the entorhinal cortex did not differ between the full sample of non-demented older adults and the different low-risk groups. This further supports the view that brain changes in older adults are not necessarily related to early AD-processes, but can be part of the normal aging process, even in areas prone to early AD. Interestingly, in the 94 participants with no change over two years in the two clinical measures, the entorhinal changes correlated with changes in memory performance over time, suggesting that non-AD mechanisms in AD-prone areas may still be causative for cognitive decline. With longer follow-up data from ADNI more recently available, investigation of the same participants up to four years after the initial exam has shown that significant entorhinal and hippocampal atrophy can be detected in groups of elderly at very low risk of AD defined by clinical neuropsychological, genetic and biomarker criteria (Fjell et al., 2013a). An independent study also identified small hippocampal volumes in a group of amyloid negative elderly (Knopman et al., 2013). Further, Oh et al found correlations between age and cortical volume and thickness, including in the medial and lateral temporal lobe, in healthy elderly even when amyloid status as indexed by PIB PET was used as covariate (Oh et al., 2013). Such results can be used to argue that brain atrophy in AD-prone regions can be a part of the normal aging-process. Of course, there is no guarantee that such changes are due to aging or non-AD pathology, and it cannot be ruled out that a component of the net loss may be due to very early AD in individuals stable over several years. Also, a danger associated with low-risk group analyses is that the power to detect differences in decline diminishes with the reduction in sample size. Still, demonstration of cortical atrophy in low-risk older adults makes a strong case that preclinical AD is not the only factor driving brain change in aging.
4. Neuroplasticity in the aging brain – a critical vulnerability factor?
If atrophy in normal aging does not reflect latent AD pathology, a critical question that must be addressed is why it is that AD-prone areas are also highly vulnerable to normal age-changes? These areas include not only the temporal regions, but regions around the medial parietal cortex (the precuneus/posterior cingulate/retrosplenial cortex) – an area that is an important component of the DMN. One speculation is that areas characterized by high degree of life-long plasticity are those most vulnerable to detrimental effects of normal and pathological aging (Neill, 1995, Mesulam, 1999, Bufill and Carbonell, 2004, Rapoport and Nelson, 2011, Neill, 2012, Bufill et al., 2013). The pattern of effects may be explained by the special role of the medial temporal lobes and other parts of DMN in learning and memory, with high demands for life-long plasticity required for these cognitive functions (Aimone et al., 2010, Deng et al., 2010). For instance, neurogenesis in the hippocampus may be important for structural plasticity and network maintenance, and it has been suggested that altered neurogenesis in the hippocampus is an early critical event in AD (Mu and Gage, 2011). Down-regulation of neurogenesis in the aged mouse brain has also been found (Lazarov et al., 2010). As neurogenesis in the adult brain is likely limited to the dendate gyrus of the hippocampus as well as the olfactory bulb, it is unlikely to be a main factor in the changes in brain and cognition associated with aging. However other mechanisms related to neuroplasticity could be at play in other age-vulnerable regions. Dendritic spines may represent a primary site of structural plasticity in the adult brain, and spine plasticity seems to play an important role in long-term memory in rodents (Sanders et al., 2012). Dendritic spine plasticity in the prefrontal cortex is reduced in aged rodents (Bloss et al., 2011), and spine density is likely reduced in aging (Jacobs et al., 1997, Esiri, 2007, Freeman et al., 2008, Benavides-Piccione et al., 2013) (see Figure 13).
Figure 13. Dendritic spine morphology in aging.
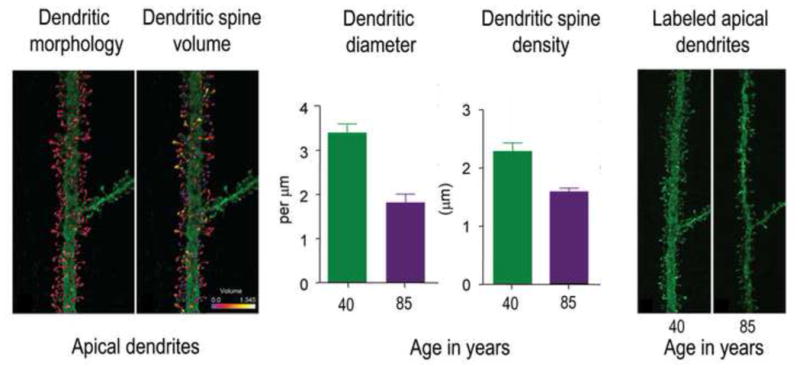
Benavides-Piccione et al (2013) 3D reconstructed 8900 individual dendritic spines from layer III pyramidal neurons in the cingulate cortex from two male humans of age 40 and 85 years, using intracellular injections of Lucifer Yellow in fixed tissue. The left two panels show the 3D reconstruction of the complete morphology of each spine of an apical dendritic segment at 100 μm distance from the soma, and the estimation of the spine volumes shown in color codes (0–1.345 μm3). The middle two panels show mean dendritic diameter and dendritic spine density in apical dendrites in the middle-aged and the older participant. The right two panels show examples of apical dendritic segments from the middle-aged and the older participants. The differences in spine morphology are easily seen. Figure modified with permission from (Benavides-Piccione et al., 2013).
Another interesting feature is that the medial temporal lobe structure dentate gyrus is the only site of adult human neurogenesis besides the olfactory bulb (Eriksson et al., 1998, Lotsch et al., 2013). This is different from other primate species, where new neurons can be added throughout life in regions of the neocortex (Gould et al., 2001, Bernier et al., 2002, Vessal and Darian-Smith, 2010). Thus, the medial temporal lobe is an evolutionary old and at the same time a neuroplastic area within an otherwise much more developed and expanded neocortex. The downside of being lone areas involved in or surrounding this type of plasticity in the human brain may be increased vulnerability and accumulation of negative impacts through life. Lesions in the highly neuroplastic limbic system could then have consequences for association cortices with which they are reciprocally interconnected (Mesulam, 1999).
Thus, although still highly speculative, it may be that certain brain regions are characterized by increased demands for life-long plasticity mechanisms, and that this makes them especially vulnerable to subtle lesions and pathology accumulating through life. The cost of maintained plasticity may be increased vulnerability to factors which can trigger cognitive decline (Bufill et al., 2013). Perturbation of neuroplasticity has previously been proposed as a fundamental principle of a unitary theory that could potentially account for all clinical and neuropathological features of AD, on the assumption that amyloid depositions and neurofibrillary tangles are manifestations of the same underlying phenomenon (Mesulam, 1999). The potential for neuroplasticity is higher in the limbic system than in other parts of the cerebral cortex, which increases its vulnerability to neurofibrillary degeneration. A consequence of this view may be that late-onset AD is not a disease at all, but “the inevitable manifestation of a failure to keep up with the increasingly more burdensome work of plasticity” (Mesulam, 1999) (p. 526). This is in line with a systems vulnerability view on aging and AD, where critical networks are subject to various negative impacts, aging in particular, rather than being selectively targeted in AD (Jagust, 2013).
Somewhat related to the concept of plasticity is an idea based on the observed overlap between regional distribution of deposition of amyloid and the DMN that the level of brain activity itself may be causally related to amyloid deposition (Jagust and Mormino, 2011, Buckner, 2012). Amyloid depositions are part of the histopathological definition of AD, but the role of amyloid in normal aging and in the transition from normal aging to neurodegeneration is still poorly understood, and the target of several large research initiatives
5. Amyloid and brain changes in non-demented older adults: preclinical dementia or a role in normal aging?
Amyloid depositions are part of the histopathological definition of AD, and thus much weight is put on in vivo biomarkers of amyloid in contemporary AD research, as reflected in the NIA-AA proposed diagnostic guidelines for Alzheimer’s disease and its preclinical stages (Jack et al., 2011, Sperling et al., 2011a). The role of amyloid in neurodegeneration is envisioned to be very early in the cascade of detrimental events that culminates with dementia and a clinical diagnosis of AD (Jack et al., 2010a, Jack et al., 2013). Current models posit that brain atrophy in AD progresses years before clinical symptoms (Jack et al., 2011, Sperling et al., 2011a), but that nerve cell degeneration is downstream from even earlier causative events, especially abnormal processing of amyloid-β peptides (Goedert and Spillantini, 2006, Jack et al., 2010a). It has been suggested that, once initiated, the neurodegeneration in AD progresses independently of its amyloid-trigger, leading to the commonly expressed concern that the therapeutic window for anti-amyloid drugs may close when neurodegeneration has started to accelerate (Sperling et al., 2011b). Thus, it is absolutely necessary to better understand the relationship between amyloid, brain integrity and memory in healthy elderly. It has been suggested that older adults with normal cognitive function despite AD-related pathology should be the focus of intense investigation, because they may be in earliest phases of AD (Jagust, 2013). The difficult question is then: What amyloid-related changes in brain and cognition represent AD-related pathology, and what, if any, such changes can be expected as part of the “normal” aging-process?
Aβ-atrophy correlations have been demonstrated in MCI/AD patients(de Leon et al., 2006, Fjell et al., 2010b) and normal controls (Storandt et al., 2009, Fjell et al., 2010a, Becker et al., 2011, Fortea et al., 2011, Arenaza-Urquijo et al., 2013b), eliciting debate about whether brain atrophy related to amyloid in presumably healthy elderly signifies early AD-related changes (Becker et al., 2011, Fortea et al., 2011, Shim and Morris, 2011, Sperling et al., 2011a) or whether they may be part of the normal aging process (Fjell and Walhovd, 2013b). This pertains directly to the question of whether the factors that drive atrophy in AD also play a role in normal aging. In ADNI, relationships between CSF levels of Aβ1-42 and cortical atrophy have been found in MCI patients (Schuff et al., 2009, Fjell et al., 2010b, Jack et al., 2010b, Tosun et al., 2010) and controls (Fjell et al., 2010a, Schott et al., 2010). In the controls, however, CSF Aβ1-42 predicts atrophy only in the subgroup of participants with very low Aβ1-42 levels (an indication of a high level of Aβ deposition in the brain). In these participants, strong Aβ1-42 -atrophy correlations can be observed in large areas of the cortex, but not MTL. This is shown in Figure 14. In MCI, the correlations are weaker, and restricted to the temporal lobes, medial parietal cortex and posterior cingulate. Thus, the pattern of correlation is almost non-overlapping between the healthy older adults and the MCI patients. In contrast, no relationship between atrophy and CSF p-tau levels can be seen in the healthy older adults, while the expected correlation between p-tau and temporal atrophy can be seen in MCI patients. Interestingly, recent studies from ADNI have shown interactions between p-tau levels and Aβ1-42 in clinical decline (Desikan et al., 2012) and entorhinal atrophy (Desikan et al., 2011) in non-demented elderly. In general, the anatomical distribution of tau pathology, initially restricted to MTL, fits better with the spreading of atrophy in AD, and also with the earliest cognitive symptoms of memory and navigation problems. Histopathological data indicate that accumulation of tau-related pathology is an earlier event than Aβ deposition (Braak and Braak, 1997a, b). An interesting feature is that Aβ is only modestly related to age, while at least levels of total tau increases substantially. As age is the number one risk factor for AD, understanding brain events that also increase in intensity with age would set us in a position to better understand why aging plays such a prominent role in AD development. A recent study found that MTL tangle formation in non-demented elderly was independent of neuritic plaques, and proposed an age-related, non-amyloid process contributing to this (Mungas et al., 2014). In addition, they suggested that a primary amyloid-based AD process would make the largest contribution to MTL tangles. Other studies have also demonstrated MTL tangles without neuritic amyloid plaques (Nelson et al., 2009). Thus, there may be both direct amyloid-independent and indirect amyloid-dependent processes causing tangle formation, leading to cerebral and cognitive decrements in aging. Age-related changes in tangle formation in MTL could contribute to explain the high levels of MTL atrophy observed even in healthy elderly at low AD-risk and the consequent decline in episodic memory.
Figure 14. CSF biomarkers and regional atrophy in aging and MCI.
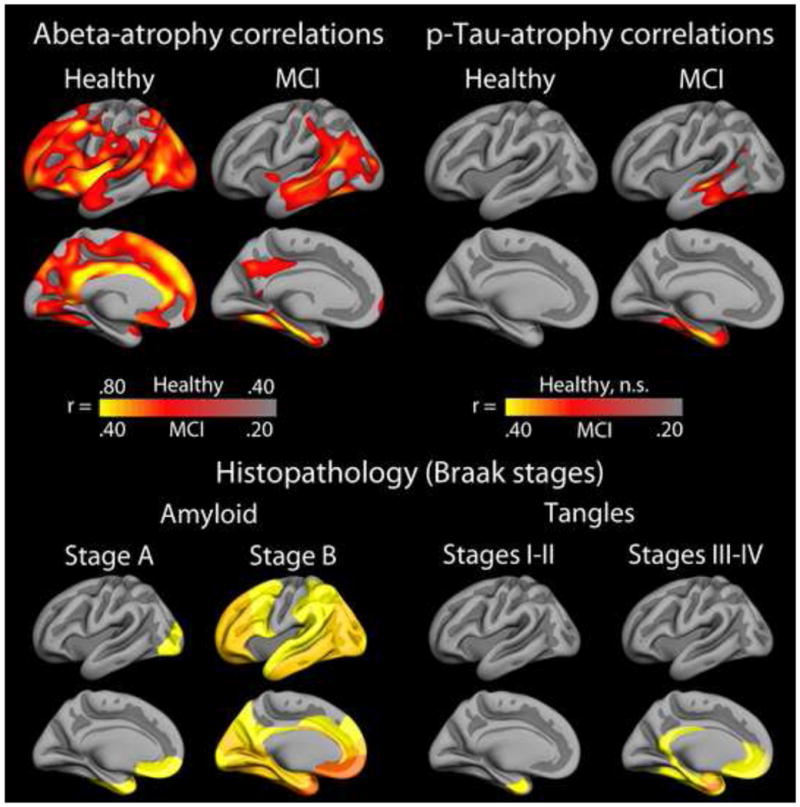
Upper panel: CSF biomarkers of Aβ and p-Tau, indexing brain levels of amyloid and tangle load, respectively, correlate with temporal atrophy in stable MCI patients from ADNI (n = 213). In contrast, the correlations between atrophy and Aβ in amyloid positive healthy elderly (Aβ1-42 < 175 pg/ml (Fjell et al., 2010a)) are seen in other cortical areas exclusively. This may indicate that the relationship between atrophy and amyloid is different in healthy aging and MCI, and that the selective lack of relationship between amyloid beta and atrophy in the medial temporal lobe in controls may represent a key to understand why these participants have not progressed to AD. Lower panel: Histopathological maps from Braak and Braak, projected onto the same template brain. The topographical pattern of accumulated amyloid in AD brains resembles the Aβ-atrophy correlations seen in MCI to a much larger extent than the Aβ-atrophy correlations seen in non-demented elderly.
The relationship between Aβ and tangle formation is also closely related to the discussion of which brain changes in aging result from early AD-related processes and which are AD-independent. Aβ-atrophy correlations in cognitively stable older adults have been interpreted as reflecting early AD (Tosun et al., 2010, Becker et al., 2011, Fortea et al., 2011, Shim and Morris, 2011, Sperling et al., 2011a). However, the healthy older adults shown in Figure 14 are not on the verge of converting to MCI or AD, as evidenced by their status as normal controls two years later, and their normal levels of atrophy and normal memory function (Fjell et al., 2010a). The few other studies testing Aβ-atrophy correlations in healthy elderly in vivo generally show the same lack of medial temporal lobe-relationships in the cerebral cortex, especially in entorhinal cortex (Storandt et al., 2009, Fjell et al., 2010a, Tosun et al., 2010, Becker et al., 2011, Oh et al., 2011, Arenaza-Urquijo et al., 2013b) (see Figure 15 for examples), even though the results sometimes are complex (Bourgeat et al., 2010, Chetelat et al., 2010a, Chetelat et al., 2010b). In contrast, Aβ-atrophy correlations in MCI are found mainly in the temporal lobe, laterally and medially. Correlations between Aβ and hippocampal volume (Mormino et al., 2009, Arenaza-Urquijo et al., 2013b) or atrophy (Fjell et al., 2010a) have been observed, but when compared to correlations with other subcortical structures, Aβ-atrophy relationships often do not stand out as especially strong (Fjell et al., 2010a). This was also found in a longitudinal study from the Australian Imaging, Biomarker and Lifestyle Study of Ageing (AIBL). Healthy controls with higher levels of amyloid deposition showed more hippocampal atrophy, but also more total gray matter loss (Villemagne et al., 2013). As recently reviewed, significant hippocampal atrophy in amyloid-positive cases has been inconsistently observed (Chételat et al., 2013).
Figure 15. Selected studies on amyloid and cortical structure in non-demented older adults.
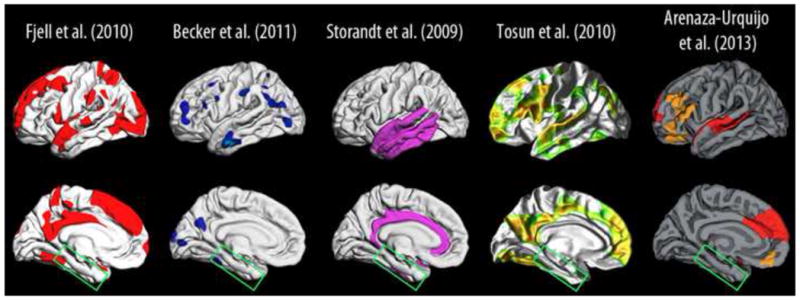
Representative studies of the relationship between amyloid levels (PiB PET or CSF Aβ) and cortical thickness (baseline) or cortical atrophy (longitudinal) in healthy elderly (Storandt et al., 2009, Fjell et al., 2010a, Tosun et al., 2010a, Becker et al., 2011, Arenaza-Urquijo et al., 2013b). Common for these studies was the use of anatomically unbiased surface-based cortical analyses using FreeSurfer (surfer.nmr.mgh.hardard.edu). We extracted the effect sites from the published figures, and projected them onto the same standard brain to allow visual comparison of the results. For some, the colors of the effects were changed to aid discriminability between the different studies. The main conclusions are that Aβ levels are not related to cortical thickness/atrophy on cognitively healthy elderly in typical AD areas in the medial temporal lobe (green box).
One way to reconcile these findings could be to hypothesize that Aβ reflects processes related to brain changes in elderly without AD-symptoms, but that it is only when these processes impact MTL that cognitive decline of the sort observed in early AD/MCI becomes evident. As described above, MTL plays a special role in learning and memory, with high demands for life-long plasticity and neurogenesis required for these cognitive functions. Rodent research has shown that Aβ, although usually in extremely high doses, can affect synaptic function by modulation of maturation and plasticity of newborn neurons in hippocampus (Biscaro et al., 2009, Lilja et al., 2013). Thus, the impact of Aβ on the temporal lobes may cause malfunction that cannot be compensated for by mechanisms of neural plasticity elsewhere in the brain. Although the atrophy-driving mechanisms may be related to Aβ, the causal role of amyloid in neurodegeneration in healthy older adults remains an open question. Such an account may call for a revision of the prevailing view of amyloid biomarkers in normal aging and AD, in that healthy aging and AD may have partly common neural mechanisms for brain atrophy (see also (Glass and Arnold, 2012)). A critical issue may thus be the regional distribution of Aβ, not only the amount (see Figure 16).
Figure 16. A speculative model of Aβ-atrophy relationships in normal aging and MCI.
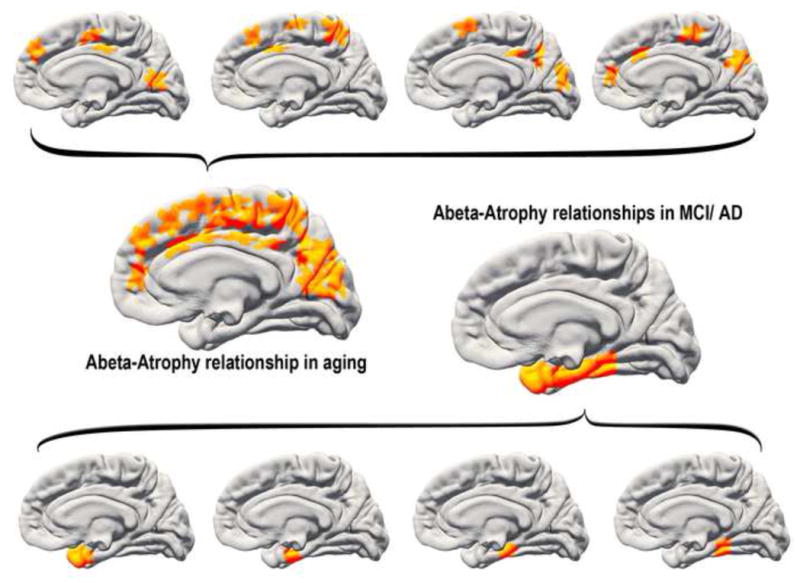
One speculative explanation for the discrepant Aβ-atrophy relationships in healthy aging vs. MCI (see Figure 12) would be to assume that lesions related to amyloid levels can occur in several places in the cortex in aging. Lesions targeting the temporal lobe will tend to yield memory problems that are difficult to compensate for, increasing the likelihood of an MCI diagnosis. In contrast, lesions in other parts of the cortex are less directly related to memory problems and may also be easier to compensate for, thus reducing the likelihood of an MCI/AD diagnosis. This would cause the observed discrepancy in regional distribution of amyloid-atrophy relationships between clinically normal older adults and MCI patients.
Several authors have pointed out the overlap between the DMN and the distribution of amyloid (for a review, see (Buckner, 2012)), and it has been suggested that lifelong patterns of neural activity lead to increased Aβ production and deposition (Jagust and Mormino, 2011). It has been demonstrated that synaptic activity increases amyloid-beta levels in mice (Cirrito et al., 2005), and that neural activity regulates the regional concentration of Aβ, which again drives local Aβ aggregation (Bero et al., 2011). Thus, the cognitive importance of DMN has been envisioned to cause its susceptibility to Aβ (Buckner, 2012), p 11): “AD may be so devastating to higher cognitive function specifically because it targets brain systems expanded in the human brain and important to the default network, robbing the ability to remember and imagine. The clinical insight from this connection is that downstream consequences of normal basal activity and metabolism may facilitate AD pathology.” Further support for the neural activity – amyloid mechanism has come from recent research showing a relationship between brain aerobic glycolysis and Aβ (Vaishnavi et al., 2010, Vlassenko et al., 2010). Education is an often-used proxy for cognitive reserve, which is defined as the ability to maintain cognitive function despite high levels of AD pathology. (Stern et al., 1999, Stern, 2006, 2012). Higher education is typically regarded as facilitating the development or use of alternate strategies to cope with pathology. However, according to the activity-dependent amyloid accumulation view, the situation may be the opposite. Higher education itself could lead to the build-up of amyloid pathology through its effect of promoting life-long intellectual activity.
This theory is intriguing, but prompts difficult questions: First, both targeted, experimental cognitive interventions (Engvig et al., 2010, Zatorre et al., 2012) and lifespan mental activity (Valenzuela et al., 2008) are shown to have positive effects on brain atrophy and cognitive function in elderly. One study even found a relationship between self-reported lifespan cognitive activity and lower amyloid deposition as measured by Pittsburgh Compound-B (PiB) PET (Landau et al., 2012), and the authors suggested that “(…) lifestyle factors found in individuals with high cognitive engagement may prevent or slow deposition of β-amyloid, perhaps influencing the onset and progression of AD.” A recent study by Selkoe and colleagues found that enriched environments increased synaptic plasticity in the hippocampus and yielded better resistance to toxic effects of Aβ oligomers in wild-type mice (Li et al., 2013). The researchers then went one step further, and showed that blocking the β2-adrenergic pathway hindered the positive effects of environmental exploration while stimulating β2-adrenergic signaling yielded the same benefits as environmental enrichment, thus providing a clue to one possible mechanism behind the often-reported positive association between intellectual activity and cognitive function. The idea that neural activity itself may initiate a cascade of neurodegenerative events needs to be reconciled with such findings.
Second, even if the overlap between DMN and early Aβ deposition, as evidenced by amyloid imaging, is causally related to the high activity of certain parts of the DMN (Jagust and Mormino, 2011, Buckner, 2012), it yet not clear whether the life-long pattern of brain activity is higher in the areas with higher Aβ depositions, e.g. the medial posterior parietal cortex, than in the areas with less, such as the medial temporal lobes. The hippocampus and surrounding cortices are involved in encoding of all new information, consolidation of memories, episodic memory retrieval and spatial navigation (Buzsaki and Moser, 2013), and even show a high level of activity during sleep (Grosmark et al., 2012). As can be seen in Figure 14, Aβ deposition is detected in histopathological studies in the medial temporal lobes before advanced AD (Braak stage A), but is usually not found to be among the first regions to show increased amyloid deposition by amyloid PET imaging in non-demented elderly (Sojkova et al., 2011, Mormino et al., 2012). If cognitive activity is directly related to amyloid production and later deposition, we need to understand why amyloid deposition is not more evident in these areas in early phases. One explanation could be that cognitive activity increases brain efficiency –people who perform tasks as experts or who are better trained actually may use fewer neural resources. Thus, people who remain cognitively active throughout life develop more efficient ways of performing mental tasks, and therefore produce less Aβ (Jagust, personal communication). This could possibly unite the seemingly contradictory findings of increased Aβ production with synaptic activity combined with possibly lower levels of Aβ deposition with sustained intellectual activity. Another possibility is that amyloid accumulation in non-demented elderly actually is higher in the medial temporal lobes than in most other parts of the brain. This was suggested by a recent study of network properties of amyloid accumulation in healthy elderly with low amyloid levels, where it was argued that accumulation begins in the amygdala-orbitofrontal-hippocampus formation, before extending to entorhinal cortex and the posterior medial and lateral temporal pole, the medial parietal cortex and the medial and lateral prefrontal cortex (Sepulcre et al., 2013). Recent results from AIBL also indicated substantial longitudinal change in amyloid deposition in the temporal lobe in healthy elderly, even in those with initially little or no detectable amyloid burden (Villain et al., 2012). Still, amyloid deposition as detected by PIB PET generally seems to be most intense in posterior medial parietal cortex and medial frontal cortex.
Finally, although intellectual activity has been shown to have positive effects on brain biomarkers in some studies, there are discrepant findings, and a firm relationship between intellectual activity and amyloid deposition has not yet been established. Results from the large EClipSE (Epidemiological Clinopathological Studies in Europe) initiative did not provide evidence in favor of any relationship between education and amyloid deposition. A relationship was found between education, reduced dementia risk and larger brain weight at death, but with no correlation between education and neurodegenerative or vascular pathologies (Members et al., 2010). Interestingly, higher education levels reduced dementia risk largely independent of severity of pathology, by mitigating the impact of pathology on the clinical expression of dementia before death, consistent with the cognitive reserve hypothesis. A recent publication from the Mayo Clinic Study of Aging did not find any relationship between amyloid deposition, glucose metabolism or hippocampus volume and lifetime or current intellectual activities (Vemuri et al., 2012). The relationships may be complex and affected by several variables. One study found that the relationship between cognitive function and AD histopathological markers was modified by the participants feeling of purpose in life (Boyle et al., 2012).
Another issue is that there is growing agreement that Aβ accumulation in sporadic AD is more related to decreased clearance than increased production (DeMattos et al., 2004, Mawuenyega et al., 2010, Castellano et al., 2011), in contrast to increased Aβ production seen in familial AD (Scheuner et al., 1996). Thus, it may not be increased Aβ production that is the most relevant factor for amyloid deposition, but rather the ability of the brain to keep the Aβ peptides soluble (Robakis, 2010). In sum, we still lack convincing evidence for a relationship between amyloid deposition and intellectual activity in humans.
To summarize, regions with relatively high mental activity are parts of the heteromodal cortex, supporting complex cognition, with a complex architecture and high functional connectivity, with some being late maturing in development and high-expanding in evolution. These areas also show higher levels of atrophy in aging (see Figure 9). Interestingly, prefrontal cortex is high-expanding in evolution and shows high levels of atrophy in normal aging, but is not among the most vulnerable regions in AD. Degeneration in these different age-vulnerable regions likely has a multitude of causes that may affect deposition of amyloid, through increased production or through processes causing reduced ability to prevent oligomerization. The chain of causation is still unknown, however. For instance, with cerebral amyloid angiopathy, amyloid deposition is found in the inner walls of blood vessels in the brain. Cerebrovascular diseases, e.g. small vessel disease with accompanying cerebral microbleeds, thus increase the levels of deposited amyloid in the brain detected by PiB PET (Park et al., 2013). However, the cause of atrophy and degeneration could be directly related to the vascular problems, not amyloid deposition per se. The causal direction between vascular factors and amyloid accumulation is not yet established, and both are related to APOE ε4 (Song et al., 2004). Vascular disease risk factors, such as hypertension are also risk factors for AD and have been shown to affect brain structure (Raz et al., 2005, Salat et al., 2012, Jacobs et al., 2013) and amyloid accumulation (Rodrigue et al., 2013) in non-demented elderly and AD patients (Grimmer et al., 2012). Atrophy in these areas in normal aging may be caused by amyloid-independent events, while a gradual increase in deposition of amyloid may still be seen over time in the same areas. This may or may not be the same mechanisms observed in AD. It has been argued that the important task is not to decide whether the age-changes observed in these areas are disease-related, but to attempt to understand the fundamental mechanisms by which they occur (Jagust and Mormino, 2011). This will have implications for a number of diseases and conditions associated with aging.
Since increased amyloid deposition is observed in AD, related to brain atrophy in both patients and healthy elderly, and has a preference for deposition in regions supporting complex cognitive functions like episodic memory (Buckner, 2012), one could expect amyloid levels to be related to cognitive function in older adults. Testing the relationship between amyloid levels and cognitive function has been a very active area of research, but the results so far have been conflicting, with some studies finding modest relationships while others do not. In a recent meta-analysis, Hedden et al. analyzed amyloid-cognition relationship across 34 independent studies of almost 3500 subjects (Hedden et al., 2013). Episodic memory function was related to amyloid burden, with a correlation of .12, while executive function and global cognition correlated 0.08 and 0.09. The authors concluded that amyloid levels have small but nontrivial associations with cognitive function in older adults.
An important consideration in the interpretation of the in vivo biomarkers of amyloid is that they may not be sensitive to the most relevant form of amyloid. Both CSF levels of Aβ1-42 and amyloid imaging with PIB PET reflect fibrillar Aβ levels and amyloid plaque load in the brain (Blennow et al., 2010). Soluble oligomeric forms of Aβ may be more toxic than fibrillar Aβ(McLean et al., 1999), but are very difficult to measure reliably in CSF (Rosen et al., 2013). Consequently, to be amyloid negative based on in vivo PET imaging or CSF does not guarantee that there are not malign amyloid-processing ongoing in the brain. It has been suggested that there actually could be several interacting pools of amyloid, with a large insoluble pool that is derived from a constantly turning over smaller soluble pools (McLean et al., 1999).
6. Integration, summary and conclusion
As argued above, we believe that a key element in understanding the borders between normal aging and the earliest stages of AD may be related to neuroplasticity; cognitive decline results when the brain is not able to compensate for accumulation of insults. The major genetic risk factor for AD, apolipoprotein ε4 (APOE), is related to neural plasticity. Higher levels of cognitive reserve, as indicated by education level and socio-economic status, are protective of AD diagnosis (Stern, 2012), as individuals with greater reserve can maintain cognitive function in the face of higher levels of brain amyloid (Members et al., 2010). The weak correlations between amyloid level and cognitive function suggest that other mechanisms, such as functional compensation, impact cognitive ability. The view that cognitive function can be maintained in aging by compensatory cognitive processes, and that decline is seen when a person is no longer able to compensate for reduced workings of primary brain structures and circuits, has many supporters in contemporary research (Cabeza et al., 2002, Park and Reuter-Lorenz, 2009, Grady, 2012). According to such a view, the magnitude of brain insults that can be accommodated without cognitive decline and progression to AD varies significantly between individuals, and a key to understanding why may be individual differences in neural and cognitive plasticity. Thus, it is important to understand the mechanisms that cause some older adults to develop AD and some to maintain cognitive function in spite of accumulated brain amyloid. To reach this aim, we need knowledge about individual differences in the relationship between the major neurocognitive events in AD. For instance, it is likely that the relationship between brain atrophy and amyloid load will vary substantially between different groups of participants (Fjell et al., 2010a), and this variation is likely not random. A key to improved diagnosis and prognosis, as well as to a better understanding of the disease mechanisms themselves, is to systematically map individual differences in the relationships between the major events in early AD. For instance, one approach to close in on the borders between healthy aging and AD is to study the characteristics of participants who show
Normal cognition and structural brain integrity as measured by MRI despite elevated levels of AD-biomarkers such as brain amyloid
Reduced cognition and brain integrity in AD-vulnerable regions with normal amyloid biomarkers
High levels of brain maintenance as measured by structural and functional neuroimaging (Nyberg et al., 2012)
There is a dearth of studies focusing directly on the relationship between brain plasticity and aging-and AD-related biomarkers, such as intervention studies with systematic mapping of structural and functional brain characteristics in combination with amyloid imaging. Such studies would have the potential to elucidate the relationship between cognitive function, brain integrity and mechanisms of cognitive and neural plasticity on the borders between normal aging and the earliest phases of AD.
Several overarching principles of age-vulnerability have been proposed, including the “last in, first out” hypothesis. These principles only partially fit existing evidence, as for instance the medial temporal lobes are vulnerable to age-changes but relatively low-expanding in evolution. So far, the best overlap seems to be between cortical age-vulnerability maps and the DMN. As shown in the present review, cortical age-related reductions are often found in AD-prone areas, even in those individuals at low risk of AD. We argue that these structural changes are an inevitable part of the normal aging process, and not necessarily related to neurodegenerative disease. It is likely that the vulnerability of these areas to normal age-changes contributes to their vulnerability to pathological processes involved in AD. The background for this idea is that age affects the brain independently of AD, and there is a growing number of proponents of the view that it is important to understand age-related changes to better understand AD: Herrup has developed a patho-physiological model for AD starting with age as the prime risk factor (Herrup, 2010), Jagust suggested that as brain systems may be vulnerable to aging in “in the absence of even subtle disease”, and that research should thus focus on fundamental causes of neural system vulnerability rather than solely on AD-specific degeneration (Jagust, 2013), and Khachaturian proposed that we should focus less on single etiological factors and rather study the full spectrum of pathogenesis in favor of a system-level approach (Khachaturian, 2011). One idea may be that regions characterized by a high degree of plasticity are vulnerable to normal aging, which renders them even more susceptible to AD-pathology. With the normalcy-pathology homology as starting point, studying the brain regions that are vulnerable to both aging and AD may allow us to disentangle disease-specific mechanisms from normal age-related events.
Highlights.
Reductions of cortical thickness and hippocampal volume is part of normal aging
Fronto-temporal regions are vulnerable, overlapping the default mode network
Difficult to understand Alzheimer without understanding why it affects older brains
Regions of high plasticity may be more vulnerable to both aging and disease
Acknowledgments
We thank Inge K. Amlien for invaluable assistance in the creation of Figures 8–9 and 14–16. The project was financed by The Norwegian Research Council (A.M.F., K.B.W.), the European Research Council (A.M.F. and K.B.W.), the Department of Psychology, University of Oslo (K.B.W., A.M.F., I.A.) and the National Institute on Aging (NIA K01AG029218, LKM; R01 AG031224 AMD).
Data collection and sharing for this project was funded by the Alzheimer’s Disease Neuroimaging Initiative (ADNI) (National Institutes of Health Grant U01 AG024904) and DOD ADNI (Department of Defense award number W81XWH-12-2-0012). ADNI is funded by the National Institute on Aging, the National Institute of Biomedical Imaging and Bioengineering, and through generous contributions from the following: Alzheimer’s Association; Alzheimer’s Drug Discovery Foundation; BioClinica, Inc.; Biogen Idec Inc.; Bristol-Myers Squibb Company; Eisai Inc.; Elan Pharmaceuticals, Inc.; Eli Lilly and Company; F. Hoffmann-La Roche Ltd and its affiliated company Genentech, Inc.; GE Healthcare; Innogenetics, N.V.; IXICO Ltd.; Janssen Alzheimer Immunotherapy Research & Development, LLC.; Johnson & Johnson Pharmaceutical Research & Development LLC.; Medpace, Inc.; Merck & Co., Inc.; Meso Scale Diagnostics, LLC.; NeuroRx Research; Novartis Pharmaceuticals Corporation; Pfizer Inc.; Piramal Imaging; Servier; Synarc Inc.; and Takeda Pharmaceutical Company. The Canadian Institutes of Health Research is providing funds to support ADNI clinical sites in Canada. Private sector contributions are facilitated by the Foundation for the National Institutes of Health (www.fnih.org). The grantee organization is the Northern California Institute for Research and Education, and the study is coordinated by the Alzheimer’s Disease Cooperative Study at the University of California, San Diego. ADNI data are disseminated by the Laboratory for Neuro Imaging at the University of Southern California.
Abbreviations
- DMN
Default Mode Network
Footnotes
Publisher's Disclaimer: This is a PDF file of an unedited manuscript that has been accepted for publication. As a service to our customers we are providing this early version of the manuscript. The manuscript will undergo copyediting, typesetting, and review of the resulting proof before it is published in its final citable form. Please note that during the production process errors may be discovered which could affect the content, and all legal disclaimers that apply to the journal pertain.
References
- Addis DR, Roberts RP, Schacter DL. Age-related neural changes in autobiographical remembering and imagining. Neuropsychologia. 2011;49:3656–3669. doi: 10.1016/j.neuropsychologia.2011.09.021. [DOI] [PMC free article] [PubMed] [Google Scholar]
- Aimone JB, Deng W, Gage FH. Adult neurogenesis: integrating theories and separating functions. Trends Cogn Sci. 2010;14:325–337. doi: 10.1016/j.tics.2010.04.003. [DOI] [PMC free article] [PubMed] [Google Scholar]
- Andreasen NC, O’Leary DS, Cizadlo T, Arndt S, Rezai K, Watkins GL, Ponto LL, Hichwa RD. Remembering the past: two facets of episodic memory explored with positron emission tomography. Am J Psychiatry. 1995;152:1576–1585. doi: 10.1176/ajp.152.11.1576. [DOI] [PubMed] [Google Scholar]
- Andrews-Hanna JR, Reidler JS, Sepulcre J, Poulin R, Buckner RL. Functional-anatomic fractionation of the brain’s default network. Neuron. 2010;65:550–562. doi: 10.1016/j.neuron.2010.02.005. [DOI] [PMC free article] [PubMed] [Google Scholar]
- Andrews-Hanna JR, Snyder AZ, Vincent JL, Lustig C, Head D, Raichle ME, Buckner RL. Disruption of large-scale brain systems in advanced aging. Neuron. 2007;56:924–935. doi: 10.1016/j.neuron.2007.10.038. [DOI] [PMC free article] [PubMed] [Google Scholar]
- Arenaza-Urquijo EM, Landeau B, La Joie R, Mevel K, Mezenge F, Perrotin A, Desgranges B, Bartres-Faz D, Eustache F, Chetelat G. Relationships between years of education and gray matter volume, metabolism and functional connectivity in healthy elders. Neuroimage. 2013a;83:450–457. doi: 10.1016/j.neuroimage.2013.06.053. [DOI] [PubMed] [Google Scholar]
- Arenaza-Urquijo EM, Molinuevo JL, Sala-Llonch R, Sole-Padulles C, Balasa M, Bosch B, Olives J, Antonell A, Llado A, Sanchez-Valle R, Rami L, Bartres-Faz D. Cognitive Reserve Proxies Relate to Gray Matter Loss in Cognitively Healthy Elderly with Abnormal Cerebrospinal Fluid Amyloid-beta Levels. J Alzheimers Dis. 2013b;35:715–726. doi: 10.3233/JAD-121906. [DOI] [PubMed] [Google Scholar]
- Bardet J, Essen DK, Feron C, Gouat P. Evaluation of the social bond: a new method tested in Mus spicilegus. Comptes rendus biologies. 2007;330:837–843. doi: 10.1016/j.crvi.2007.08.006. [DOI] [PubMed] [Google Scholar]
- Barton RA, Venditti C. Human frontal lobes are not relatively large. Proc Natl Acad Sci U S A. 2013;110:9001–9006. doi: 10.1073/pnas.1215723110. [DOI] [PMC free article] [PubMed] [Google Scholar]
- Becker JA, Hedden T, Carmasin J, Maye J, Rentz DM, Putcha D, Fischl B, Greve DN, Marshall GA, Salloway S, Marks D, Buckner RL, Sperling RA, Johnson KA. Amyloid-beta associated cortical thinning in clinically normal elderly. Ann Neurol. 2011;69:1032–1042. doi: 10.1002/ana.22333. [DOI] [PMC free article] [PubMed] [Google Scholar]
- Benavides-Piccione R, Fernaud-Espinosa I, Robles V, Yuste R, Defelipe J. Age-Based Comparison of Human Dendritic Spine Structure Using Complete Three-Dimensional Reconstructions. Cereb Cortex. 2013;23:1798–1810. doi: 10.1093/cercor/bhs154. [DOI] [PMC free article] [PubMed] [Google Scholar]
- Bernier PJ, Bedard A, Vinet J, Levesque M, Parent A. Newly generated neurons in the amygdala and adjoining cortex of adult primates. Proc Natl Acad Sci U S A. 2002;99:11464–11469. doi: 10.1073/pnas.172403999. [DOI] [PMC free article] [PubMed] [Google Scholar]
- Bero AW, Yan P, Roh JH, Cirrito JR, Stewart FR, Raichle ME, Lee JM, Holtzman DM. Neuronal activity regulates the regional vulnerability to amyloid-beta deposition. Nat Neurosci. 2011;14:750–756. doi: 10.1038/nn.2801. [DOI] [PMC free article] [PubMed] [Google Scholar]
- Binder JR, Desai RH, Graves WW, Conant LL. Where is the semantic system? A critical review and meta-analysis of 120 functional neuroimaging studies. Cereb Cortex. 2009;19:2767–2796. doi: 10.1093/cercor/bhp055. [DOI] [PMC free article] [PubMed] [Google Scholar]
- Biscaro B, Lindvall O, Hock C, Ekdahl CT, Nitsch RM. Abeta immunotherapy protects morphology and survival of adult-born neurons in doubly transgenic APP/PS1 mice. J Neurosci. 2009;29:14108–14119. doi: 10.1523/JNEUROSCI.2055-09.2009. [DOI] [PMC free article] [PubMed] [Google Scholar]
- Blennow K, Hampel H, Weiner M, Zetterberg H. Cerebrospinal fluid and plasma biomarkers in Alzheimer disease. Nat Rev Neurol. 2010;6:131–144. doi: 10.1038/nrneurol.2010.4. [DOI] [PubMed] [Google Scholar]
- Bloss EB, Janssen WG, Ohm DT, Yuk FJ, Wadsworth S, Saardi KM, McEwen BS, Morrison JH. Evidence for reduced experience-dependent dendritic spine plasticity in the aging prefrontal cortex. J Neurosci. 2011;31:7831–7839. doi: 10.1523/JNEUROSCI.0839-11.2011. [DOI] [PMC free article] [PubMed] [Google Scholar]
- Bourgeat P, Chetelat G, Villemagne VL, Fripp J, Raniga P, Pike K, Acosta O, Szoeke C, Ourselin S, Ames D, Ellis KA, Martins RN, Masters CL, Rowe CC, Salvado O. Beta-amyloid burden in the temporal neocortex is related to hippocampal atrophy in elderly subjects without dementia. Neurology. 2010;74:121–127. doi: 10.1212/WNL.0b013e3181c918b5. [DOI] [PubMed] [Google Scholar]
- Boyle PA, Buchman AS, Wilson RS, Yu L, Schneider JA, Bennett DA. Effect of purpose in life on the relation between Alzheimer disease pathologic changes on cognitive function in advanced age. Arch Gen Psychiatry. 2012;69:499–505. doi: 10.1001/archgenpsychiatry.2011.1487. [DOI] [PMC free article] [PubMed] [Google Scholar]
- Braak H, Braak E. On areas of transition between entorhinal allocortex and temporal isocortex in the human brain. Normal morphology and lamina-specific pathology in Alzheimer’s disease. Acta Neuropathol. 1985;68:325–332. doi: 10.1007/BF00690836. [DOI] [PubMed] [Google Scholar]
- Braak H, Braak E. Diagnostic criteria for neuropathologic assessment of Alzheimer’s disease. Neurobiology of aging. 1997a;18:S85–88. doi: 10.1016/s0197-4580(97)00062-6. [DOI] [PubMed] [Google Scholar]
- Braak H, Braak E. Frequency of stages of Alzheimer-related lesions in different age categories. Neurobiology of aging. 1997b;18:351–357. doi: 10.1016/s0197-4580(97)00056-0. [DOI] [PubMed] [Google Scholar]
- Buckner RL. Memory and executive function in aging and AD: multiple factors that cause decline and reserve factors that compensate. Neuron. 2004;44:195–208. doi: 10.1016/j.neuron.2004.09.006. [DOI] [PubMed] [Google Scholar]
- Buckner RL. The serendipitous discovery of the brain’s default network. Neuroimage. 2012;62:1137–1145. doi: 10.1016/j.neuroimage.2011.10.035. [DOI] [PubMed] [Google Scholar]
- Buckner RL, Carroll DC. Self-projection and the brain. Trends Cogn Sci. 2007;11:49–57. doi: 10.1016/j.tics.2006.11.004. [DOI] [PubMed] [Google Scholar]
- Buckner RL, Snyder AZ, Shannon BJ, LaRossa G, Sachs R, Fotenos AF, Sheline YI, Klunk WE, Mathis CA, Morris JC, Mintun MA. Molecular, structural, and functional characterization of Alzheimer’s disease: evidence for a relationship between default activity, amyloid, and memory. J Neurosci. 2005;25:7709–7717. doi: 10.1523/JNEUROSCI.2177-05.2005. [DOI] [PMC free article] [PubMed] [Google Scholar]
- Bufill E, Blesa R, Augusti J. Journal of anthropological sciences. Rivista di antropologia: JASS/Istituto italiano di antropologia; 2013. Alzheimer’s disease: an evolutionary approach. [DOI] [PubMed] [Google Scholar]
- Bufill E, Carbonell E. Are symbolic behaviour and neuroplasticity an example of gene-culture coevolution? Revista de neurologia. 2004;39:48–55. [PubMed] [Google Scholar]
- Burgmans S, van Boxtel MP, Vuurman EF, Smeets F, Gronenschild EH, Uylings HB, Jolles J. The prevalence of cortical gray matter atrophy may be overestimated in the healthy aging brain. Neuropsychology. 2009;23:541–550. doi: 10.1037/a0016161. [DOI] [PubMed] [Google Scholar]
- Buzsaki G, Moser EI. Memory, navigation and theta rhythm in the hippocampal-entorhinal system. Nat Neurosci. 2013;16:130–138. doi: 10.1038/nn.3304. [DOI] [PMC free article] [PubMed] [Google Scholar]
- Cabeza R, Anderson ND, Locantore JK, McIntosh AR. Aging gracefully: compensatory brain activity in high-performing older adults. Neuroimage. 2002;17:1394–1402. doi: 10.1006/nimg.2002.1280. [DOI] [PubMed] [Google Scholar]
- Castellano JM, Kim J, Stewart FR, Jiang H, DeMattos RB, Patterson BW, Fagan AM, Morris JC, Mawuenyega KG, Cruchaga C, Goate AM, Bales KR, Paul SM, Bateman RJ, Holtzman DM. Human apoE isoforms differentially regulate brain amyloid-beta peptide clearance. Sci Transl Med. 2011;3:89ra57. doi: 10.1126/scitranslmed.3002156. [DOI] [PMC free article] [PubMed] [Google Scholar]
- Catani M, ffytche DH. The rises and falls of disconnection syndromes. Brain. 2005;128:2224–2239. doi: 10.1093/brain/awh622. [DOI] [PubMed] [Google Scholar]
- Chang YL, Jacobson MW, Fennema-Notestine C, Hagler DJ, Jr, Jennings RG, Dale AM, McEvoy LK. Level of executive function influences verbal memory in amnestic mild cognitive impairment and predicts prefrontal and posterior cingulate thickness. Cereb Cortex. 2010;20:1305–1313. doi: 10.1093/cercor/bhp192. [DOI] [PMC free article] [PubMed] [Google Scholar]
- Chételat G, Renaud LJ, Villain N, Perrotin A, Sayette VDL, Eustache F, Vandenberghe R. Amyloid imaging in cognitively normal individuals, at-risk populations and preclinical Alzheimer’s disease. Neuro Image: Clinical. 2013;2:356–365. doi: 10.1016/j.nicl.2013.02.006. [DOI] [PMC free article] [PubMed] [Google Scholar]
- Chetelat G, Villemagne VL, Bourgeat P, Pike KE, Jones G, Ames D, Ellis KA, Szoeke C, Martins RN, O’Keefe GJ, Salvado O, Masters CL, Rowe CC. Relationship between atrophy and beta-amyloid deposition in Alzheimer disease. Ann Neurol. 2010a;67:317–324. doi: 10.1002/ana.21955. [DOI] [PubMed] [Google Scholar]
- Chetelat G, Villemagne VL, Pike KE, Baron JC, Bourgeat P, Jones G, Faux NG, Ellis KA, Salvado O, Szoeke C, Martins RN, Ames D, Masters CL, Rowe CC. Larger temporal volume in elderly with high versus low beta-amyloid deposition. Brain. 2010b;133:3349–3358. doi: 10.1093/brain/awq187. [DOI] [PubMed] [Google Scholar]
- Cirrito JR, Yamada KA, Finn MB, Sloviter RS, Bales KR, May PC, Schoepp DD, Paul SM, Mennerick S, Holtzman DM. Synaptic activity regulates interstitial fluid amyloid-beta levels in vivo. Neuron. 2005;48:913–922. doi: 10.1016/j.neuron.2005.10.028. [DOI] [PubMed] [Google Scholar]
- Connelly SL, Hasher L, Zacks RT. Age and reading: the impact of distraction. Psychol Aging. 1991;6:533–541. doi: 10.1037//0882-7974.6.4.533. [DOI] [PubMed] [Google Scholar]
- Cooper JM, Vargha-Khadem F, Gadian DG, Maguire EA. The effect of hippocampal damage in children on recalling the past and imagining new experiences. Neuropsychologia. 2011;49:1843–1850. doi: 10.1016/j.neuropsychologia.2011.03.008. [DOI] [PMC free article] [PubMed] [Google Scholar]
- Corballis MC. Mental time travel: a case for evolutionary continuity. Trends Cogn Sci. 2013a;17:5–6. doi: 10.1016/j.tics.2012.10.009. [DOI] [PubMed] [Google Scholar]
- Corballis MC. The wandering rat: response to Suddendorf. Trends Cogn Sci. 2013b;17:152. doi: 10.1016/j.tics.2013.01.012. [DOI] [PubMed] [Google Scholar]
- Davatzikos C, Xu F, An Y, Fan Y, Resnick SM. Longitudinal progression of Alzheimer’s-like patterns of atrophy in normal older adults: the SPARE-AD index. Brain. 2009;132:2026–2035. doi: 10.1093/brain/awp091. [DOI] [PMC free article] [PubMed] [Google Scholar]
- de Leon MJ, DeSanti S, Zinkowski R, Mehta PD, Pratico D, Segal S, Rusinek H, Li J, Tsui W, Saint Louis LA, Clark CM, Tarshish C, Li Y, Lair L, Javier E, Rich K, Lesbre P, Mosconi L, Reisberg B, Sadowski M, DeBernadis JF, Kerkman DJ, Hampel H, Wahlund LO, Davies P. Longitudinal CSF and MRI biomarkers improve the diagnosis of mild cognitive impairment. Neurobiol Aging. 2006;27:394–401. doi: 10.1016/j.neurobiolaging.2005.07.003. [DOI] [PubMed] [Google Scholar]
- DeMattos RB, Cirrito JR, Parsadanian M, May PC, O’Dell MA, Taylor JW, Harmony JA, Aronow BJ, Bales KR, Paul SM, Holtzman DM. ApoE and clusterin cooperatively suppress Abeta levels and deposition: evidence that ApoE regulates extracellular Abeta metabolism in vivo. Neuron. 2004;41:193–202. doi: 10.1016/s0896-6273(03)00850-x. [DOI] [PubMed] [Google Scholar]
- Deng W, Aimone JB, Gage FH. New neurons and new memories: how does adult hippocampal neurogenesis affect learning and memory? Nat Rev Neurosci. 2010;11:339–350. doi: 10.1038/nrn2822. [DOI] [PMC free article] [PubMed] [Google Scholar]
- Desikan RS, McEvoy LK, Thompson WK, Holland D, Brewer JB, Aisen PS, Sperling RA, Dale AM. Amyloid-beta-Associated Clinical Decline Occurs Only in the Presence of Elevated P-tau. Arch Neurol. 2012;69:709–713. doi: 10.1001/archneurol.2011.3354. [DOI] [PMC free article] [PubMed] [Google Scholar]
- Desikan RS, McEvoy LK, Thompson WK, Holland D, Roddey JC, Blennow K, Aisen PS, Brewer JB, Hyman BT, Dale AM. Amyloid-beta associated volume loss occurs only in the presence of phospho-tau. Ann Neurol. 2011;70:657–661. doi: 10.1002/ana.22509. [DOI] [PMC free article] [PubMed] [Google Scholar]
- Driscoll I, Davatzikos C, An Y, Wu X, Shen D, Kraut M, Resnick SM. Longitudinal pattern of regional brain volume change differentiates normal aging from MCI. Neurology. 2009;72:1906–1913. doi: 10.1212/WNL.0b013e3181a82634. [DOI] [PMC free article] [PubMed] [Google Scholar]
- Du AT, Schuff N, Chao LL, Kornak J, Jagust WJ, Kramer JH, Reed BR, Miller BL, Norman D, Chui HC, Weiner MW. Age effects on atrophy rates of entorhinal cortex and hippocampus. Neurobiol Aging. 2006;27:733–740. doi: 10.1016/j.neurobiolaging.2005.03.021. [DOI] [PMC free article] [PubMed] [Google Scholar]
- Du AT, Schuff N, Zhu XP, Jagust WJ, Miller BL, Reed BR, Kramer JH, Mungas D, Yaffe K, Chui HC, Weiner MW. Atrophy rates of entorhinal cortex in AD and normal aging. Neurology. 2003;60:481–486. doi: 10.1212/01.wnl.0000044400.11317.ec. [DOI] [PMC free article] [PubMed] [Google Scholar]
- Dukart J, Kherif F, Mueller K, Adaszewski S, Schroeter ML, Frackowiak RS, Draganski B. Generative FDG-PET and MRI model of aging and disease progression in Alzheimer’s disease. PLoS Comput Biol. 2013;9:e1002987. doi: 10.1371/journal.pcbi.1002987. [DOI] [PMC free article] [PubMed] [Google Scholar]
- Elias MF, Beiser A, Wolf PA, Au R, White RF, D’Agostino RB. The preclinical phase of alzheimer disease: A 22-year prospective study of the Framingham Cohort. Arch Neurol. 2000;57:808–813. doi: 10.1001/archneur.57.6.808. [DOI] [PubMed] [Google Scholar]
- Engvig A, Fjell AM, Westlye LT, Moberget T, Sundseth O, Larsen VA, Walhovd KB. Effects of memory training on cortical thickness in the elderly. Neuroimage. 2010;52:1667–1676. doi: 10.1016/j.neuroimage.2010.05.041. [DOI] [PubMed] [Google Scholar]
- Enzinger C, Fazekas F, Matthews PM, Ropele S, Schmidt H, Smith S, Schmidt R. Risk factors for progression of brain atrophy in aging: six-year follow-up of normal subjects. Neurology. 2005;64:1704–1711. doi: 10.1212/01.WNL.0000161871.83614.BB. [DOI] [PubMed] [Google Scholar]
- Eriksson PS, Perfilieva E, Bjork-Eriksson T, Alborn AM, Nordborg C, Peterson DA, Gage FH. Neurogenesis in the adult human hippocampus. Nature medicine. 1998;4:1313–1317. doi: 10.1038/3305. [DOI] [PubMed] [Google Scholar]
- Esiri MM. Ageing and the brain. J Pathol. 2007;211:181–187. doi: 10.1002/path.2089. [DOI] [PubMed] [Google Scholar]
- Ezekiel F, Chao L, Kornak J, Du AT, Cardenas V, Truran D, Jagust W, Chui H, Miller B, Yaffe K, Schuff N, Weiner M. Comparisons between global and focal brain atrophy rates in normal aging and Alzheimer disease: Boundary Shift Integral versus tracing of the entorhinal cortex and hippocampus. Alzheimer Dis Assoc Disord. 2004;18:196–201. [PMC free article] [PubMed] [Google Scholar]
- Fjell AM, McEvoy L, Holland D, Dale AM, Walhovd KB. Brain changes in older adults at very low risk for Alzheimer’s disease. J Neurosci. 2013a;33:8237–8242. doi: 10.1523/JNEUROSCI.5506-12.2013. [DOI] [PMC free article] [PubMed] [Google Scholar]
- Fjell AM, Walhovd KB. Neuroimaging results impose new views on Alzheimer’s disease-the role of amyloid revised. Molecular neurobiology. 2012;45:153–172. doi: 10.1007/s12035-011-8228-7. [DOI] [PubMed] [Google Scholar]
- Fjell AM, Walhovd KB, Fennema-Notestine C, McEvoy LK, Hagler DJ, Holland D, Blennow K, Brewer JB, Dale AM. Brain atrophy in healthy aging is related to CSF levels of Abeta1-42. Cereb Cortex. 2010a;20:2069–2079. doi: 10.1093/cercor/bhp279. [DOI] [PMC free article] [PubMed] [Google Scholar]
- Fjell AM, Walhovd KB, Fennema-Notestine C, McEvoy LK, Hagler DJ, Holland D, Brewer JB, Dale AM. One-year brain atrophy evident in healthy aging. J Neurosci. 2009a;29:15223–15231. doi: 10.1523/JNEUROSCI.3252-09.2009. [DOI] [PMC free article] [PubMed] [Google Scholar]
- Fjell AM, Westlye LT, Amlien I, Espeseth T, Reinvang I, Raz N, Agartz I, Salat DH, Greve DN, Fischl B, Dale AM, Walhovd KB. High consistency of regional cortical thinning in aging across multiple samples. Cereb Cortex. 2009b;19:2001–2012. doi: 10.1093/cercor/bhn232. [DOI] [PMC free article] [PubMed] [Google Scholar]
- Fjell AM, Walhovd KB, Fennema-Notestine C, McEvoy LK, Hagler DJ, Holland D, Brewer JB, Dale AM. CSF biomarkers in prediction of cerebral and clinical change in mild cognitive impairment and Alzheimer’s disease. J Neurosci. 2010b;30:2088–2101. doi: 10.1523/JNEUROSCI.3785-09.2010. [DOI] [PMC free article] [PubMed] [Google Scholar]
- Fjell AM, Westlye LT, Amlien I, Tamnes CK, Grydeland H, Engvig A, Espeseth T, Reinvang I, Lundervold AJ, Lundervold A, Walhovd KB. High-Expanding Cortical Regions in Human Development and Evolution Are Related to Higher Intellectual Abilities. Cereb Cortex. 2013b doi: 10.1093/cercor/bht201. in press. [DOI] [PubMed] [Google Scholar]
- Fjell AM, Westlye LT, Grydeland H, Amlien I, Espeseth T, Reinvang I, Raz N, Holland D, Dale AM, Walhovd KB. Critical ages in the life course of the adult brain: nonlinear subcortical aging. Neurobiol Aging. 2013c doi: 10.1016/j.neurobiolaging.2013.04.006. in press. [DOI] [PMC free article] [PubMed] [Google Scholar]
- Fjell AM, Westlye LT, Grydeland H, Amlien I, Espeseth T, Reinvang I, Raz N, Dale AM, Walhovd KB. Accelerating Cortical Thinning: Unique to Dementia or Universal in Aging? Cereb Cortex. 2013d doi: 10.1093/cercor/bhs379. in press. [DOI] [PMC free article] [PubMed] [Google Scholar]
- Fonseca-Azevedo K, Herculano-Houzel S. Metabolic constraint imposes tradeoff between body size and number of brain neurons in human evolution. Proc Natl Acad Sci U S A. 2012;109:18571–18576. doi: 10.1073/pnas.1206390109. [DOI] [PMC free article] [PubMed] [Google Scholar]
- Fortea J, Sala-Llonch R, Bartres-Faz D, Llado A, Sole-Padulles C, Bosch B, Antonell A, Olives J, Sanchez-Valle R, Molinuevo JL, Rami L. Cognitively preserved subjects with transitional cerebrospinal fluid ss-amyloid 1-42 values have thicker cortex in Alzheimer’s disease vulnerable areas. Biol Psychiatry. 2011;70:183–190. doi: 10.1016/j.biopsych.2011.02.017. [DOI] [PubMed] [Google Scholar]
- Fotenos AF, Snyder AZ, Girton LE, Morris JC, Buckner RL. Normative estimates of cross-sectional and longitudinal brain volume decline in aging and AD. Neurology. 2005;64:1032–1039. doi: 10.1212/01.WNL.0000154530.72969.11. [DOI] [PubMed] [Google Scholar]
- Freeman SH, Kandel R, Cruz L, Rozkalne A, Newell K, Frosch MP, Hedley-Whyte ET, Locascio JJ, Lipsitz LA, Hyman BT. Preservation of neuronal number despite age-related cortical brain atrophy in elderly subjects without Alzheimer disease. J Neuropathol Exp Neurol. 2008;67:1205–1212. doi: 10.1097/NEN.0b013e31818fc72f. [DOI] [PMC free article] [PubMed] [Google Scholar]
- Gibson KR. Evolution of human intelligence: the roles of brain size and mental construction. Brain, behavior and evolution. 2002;59:10–20. doi: 10.1159/000063730. [DOI] [PubMed] [Google Scholar]
- Glass DJ, Arnold SE. Some evolutionary perspectives on Alzheimer’s disease pathogenesis and pathology. Alzheimers Dement. 2012;8:343–351. doi: 10.1016/j.jalz.2011.05.2408. [DOI] [PMC free article] [PubMed] [Google Scholar]
- Goedert M, Spillantini MG. A century of Alzheimer’s disease. Science. 2006;314:777–781. doi: 10.1126/science.1132814. [DOI] [PubMed] [Google Scholar]
- Gogtay N, Giedd JN, Lusk L, Hayashi KM, Greenstein D, Vaituzis AC, Nugent TF, 3rd, Herman DH, Clasen LS, Toga AW, Rapoport JL, Thompson PM. Dynamic mapping of human cortical development during childhood through early adulthood. Proc Natl Acad Sci U S A. 2004;101:8174–8179. doi: 10.1073/pnas.0402680101. [DOI] [PMC free article] [PubMed] [Google Scholar]
- Gould E, Vail N, Wagers M, Gross CG. Adult-generated hippocampal and neocortical neurons in macaques have a transient existence. Proc Natl Acad Sci U S A. 2001;98:10910–10917. doi: 10.1073/pnas.181354698. [DOI] [PMC free article] [PubMed] [Google Scholar]
- Grady C. The cognitive neuroscience of ageing. Nat Rev Neurosci. 2012;13:491–505. doi: 10.1038/nrn3256. [DOI] [PMC free article] [PubMed] [Google Scholar]
- Greicius MD, Srivastava G, Reiss AL, Menon V. Default-mode network activity distinguishes Alzheimer’s disease from healthy aging: evidence from functional MRI. Proc Natl Acad Sci U S A. 2004;101:4637–4642. doi: 10.1073/pnas.0308627101. [DOI] [PMC free article] [PubMed] [Google Scholar]
- Grimmer T, Faust M, Auer F, Alexopoulos P, Forstl H, Henriksen G, Perneczky R, Sorg C, Yousefi BH, Drzezga A, Kurz A. White matter hyperintensities predict amyloid increase in Alzheimer’s disease. Neurobiol Aging. 2012;33:2766–2773. doi: 10.1016/j.neurobiolaging.2012.01.016. [DOI] [PubMed] [Google Scholar]
- Grosmark AD, Mizuseki K, Pastalkova E, Diba K, Buzsaki G. REM sleep reorganizes hippocampal excitability. Neuron. 2012;75:1001–1007. doi: 10.1016/j.neuron.2012.08.015. [DOI] [PMC free article] [PubMed] [Google Scholar]
- Gunning-Dixon FM, Raz N. Neuroanatomical correlates of selected executive functions in middle-aged and older adults: a prospective MRI study. Neuropsychologia. 2003;41:1929–1941. doi: 10.1016/s0028-3932(03)00129-5. [DOI] [PubMed] [Google Scholar]
- Haug H. Brain sizes, surfaces, and neuronal sizes of the cortex cerebri: a stereological investigation of man and his variability and a comparison with some mammals (primates, whales, marsupials, insectivores, and one elephant) The American journal of anatomy. 1987;180:126–142. doi: 10.1002/aja.1001800203. [DOI] [PubMed] [Google Scholar]
- Head D, Kennedy KM, Rodrigue KM, Raz N. Age differences in perseveration: cognitive and neuroanatomical mediators of performance on the Wisconsin Card Sorting Test. Neuropsychologia. 2009;47:1200–1203. doi: 10.1016/j.neuropsychologia.2009.01.003. [DOI] [PMC free article] [PubMed] [Google Scholar]
- Head D, Snyder AZ, Girton LE, Morris JC, Buckner RL. Frontal-hippocampal double dissociation between normal aging and Alzheimer’s disease. Cereb Cortex. 2005;15:732–739. doi: 10.1093/cercor/bhh174. [DOI] [PubMed] [Google Scholar]
- Hedden T, Oh H, Younger AP, Patel TA. Meta-analysis of amyloid-cognition relations in cognitively normal older adults. Neurology. 2013;80:1341–1348. doi: 10.1212/WNL.0b013e31828ab35d. [DOI] [PMC free article] [PubMed] [Google Scholar]
- Hedman AM, van Haren NE, Schnack HG, Kahn RS, Hulshoff Pol HE. Human brain changes across the life span: A review of 56 longitudinal magnetic resonance imaging studies. Hum Brain Mapp. 2012;33:1987–2002. doi: 10.1002/hbm.21334. [DOI] [PMC free article] [PubMed] [Google Scholar]
- Herrup K. Reimagining Alzheimer’s disease--an age-based hypothesis. J Neurosci. 2010;30:16755–16762. doi: 10.1523/JNEUROSCI.4521-10.2010. [DOI] [PMC free article] [PubMed] [Google Scholar]
- Hill J, Inder T, Neil J, Dierker D, Harwell J, Van Essen D. Similar patterns of cortical expansion during human development and evolution. Proc Natl Acad Sci U S A. 2010;107:13135–13140. doi: 10.1073/pnas.1001229107. [DOI] [PMC free article] [PubMed] [Google Scholar]
- Hogstrom LJ, Westlye LT, Walhovd KB, Fjell AM. The Structure of the Cerebral Cortex Across Adult Life: Age-Related Patterns of Surface Area, Thickness, and Gyrification. Cereb Cortex. 2012 doi: 10.1093/cercor/bhs231. [DOI] [PubMed] [Google Scholar]
- Holland D, Dale AM. Nonlinear registration of longitudinal images and measurement of change in regions of interest. Medical image analysis. 2011;15:489–497. doi: 10.1016/j.media.2011.02.005. [DOI] [PMC free article] [PubMed] [Google Scholar]
- Holland D, Desikan RS, Dale AM, McEvoy LK. Rates of decline in Alzheimer disease decrease with age. PLoS One. 2012a;7:e42325. doi: 10.1371/journal.pone.0042325. [DOI] [PMC free article] [PubMed] [Google Scholar]
- Holland D, McEvoy LK, Dale AM. Unbiased comparison of sample size estimates from longitudinal structural measures in ADNI. Hum Brain Mapp. 2012b;33:2586–2602. doi: 10.1002/hbm.21386. [DOI] [PMC free article] [PubMed] [Google Scholar]
- Hutchison RM, Everling S. Monkey in the middle: why non-human primates are needed to bridge the gap in resting-state investigations. Frontiers in neuroanatomy. 2012;6:29. doi: 10.3389/fnana.2012.00029. [DOI] [PMC free article] [PubMed] [Google Scholar]
- Jack CR, Jr, Albert MS, Knopman DS, McKhann GM, Sperling RA, Carrillo MC, Thies B, Phelps CH. Introduction to the recommendations from the National Institute on Aging-Alzheimer’s Association workgroups on diagnostic guidelines for Alzheimer’s disease. Alzheimers Dement. 2011;7:257–262. doi: 10.1016/j.jalz.2011.03.004. [DOI] [PMC free article] [PubMed] [Google Scholar]
- Jack CR, Jr, Knopman DS, Jagust WJ, Petersen RC, Weiner MW, Aisen PS, Shaw LM, Vemuri P, Wiste HJ, Weigand SD, Lesnick TG, Pankratz VS, Donohue MC, Trojanowski JQ. Tracking pathophysiological processes in Alzheimer’s disease: an updated hypothetical model of dynamic biomarkers. Lancet Neurol. 2013;12:207–216. doi: 10.1016/S1474-4422(12)70291-0. [DOI] [PMC free article] [PubMed] [Google Scholar]
- Jack CR, Jr, Knopman DS, Jagust WJ, Shaw LM, Aisen PS, Weiner MW, Petersen RC, Trojanowski JQ. Hypothetical model of dynamic biomarkers of the Alzheimer’s pathological cascade. Lancet Neurol. 2010a;9:119–128. doi: 10.1016/S1474-4422(09)70299-6. [DOI] [PMC free article] [PubMed] [Google Scholar]
- Jack CR, Jr, Petersen RC, Xu Y, O’Brien PC, Smith GE, Ivnik RJ, Tangalos EG, Kokmen E. Rate of medial temporal lobe atrophy in typical aging and Alzheimer’s disease. Neurology. 1998;51:993–999. doi: 10.1212/wnl.51.4.993. [DOI] [PMC free article] [PubMed] [Google Scholar]
- Jack CR, Jr, Petersen RC, Xu YC, Waring SC, O’Brien PC, Tangalos EG, Smith GE, Ivnik RJ, Kokmen E. Medial temporal atrophy on MRI in normal aging and very mild Alzheimer’s disease. Neurology. 1997;49:786–794. doi: 10.1212/wnl.49.3.786. [DOI] [PMC free article] [PubMed] [Google Scholar]
- Jack CR, Jr, Wiste HJ, Vemuri P, Weigand SD, Senjem ML, Zeng G, Bernstein MA, Gunter JL, Pankratz VS, Aisen PS, Weiner MW, Petersen RC, Shaw LM, Trojanowski JQ, Knopman DS. Brain beta-amyloid measures and magnetic resonance imaging atrophy both predict time-to-progression from mild cognitive impairment to Alzheimer’s disease. Brain. 2010b;133:3336–3348. doi: 10.1093/brain/awq277. [DOI] [PMC free article] [PubMed] [Google Scholar]
- Jacobs B, Driscoll L, Schall M. Life-span dendritic and spine changes in areas 10 and 18 of human cortex: a quantitative Golgi study. J Comp Neurol. 1997;386:661–680. [PubMed] [Google Scholar]
- Jacobs HI, Leritz EC, Williams VJ, Van Boxtel MP, van der Elst W, Jolles J, Verhey FR, McGlinchey RE, Milberg WP, Salat DH. Association between white matter microstructure, executive functions, and processing speed in older adults: the impact of vascular health. Hum Brain Mapp. 2013;34:77–95. doi: 10.1002/hbm.21412. [DOI] [PMC free article] [PubMed] [Google Scholar]
- Jagust W. Vulnerable neural systems and the borderland of brain aging and neurodegeneration. Neuron. 2013;77:219–234. doi: 10.1016/j.neuron.2013.01.002. [DOI] [PMC free article] [PubMed] [Google Scholar]
- Jagust WJ, Mormino EC. Lifespan brain activity, beta-amyloid, and Alzheimer’s disease. Trends Cogn Sci. 2011;15:520–526. doi: 10.1016/j.tics.2011.09.004. [DOI] [PMC free article] [PubMed] [Google Scholar]
- Johnson SC, Christian BT, Okonkwo OC, Oh JM, Harding S, Xu G, Hillmer AT, Wooten DW, Murali D, Barnhart TE, Hall LT, Racine AM, Klunk WE, Mathis CA, Bendlin BB, Gallagher CL, Carlsson CM, Rowley HA, Hermann BP, Dowling NM, Asthana S, Sager MA. Amyloid burden and neural function in people at risk for Alzheimer’s Disease. Neurobiol Aging. 2013 doi: 10.1016/j.neurobiolaging.2013.09.028. in press. [DOI] [PMC free article] [PubMed] [Google Scholar]
- Jones DT, Machulda MM, Vemuri P, McDade EM, Zeng G, Senjem ML, Gunter JL, Przybelski SA, Avula RT, Knopman DS, Boeve BF, Petersen RC, Jack CR., Jr Age-related changes in the default mode network are more advanced in Alzheimer disease. Neurology. 2011;77:1524–1531. doi: 10.1212/WNL.0b013e318233b33d. [DOI] [PMC free article] [PubMed] [Google Scholar]
- Josefsson M, de Luna X, Pudas S, Nilsson LG, Nyberg L. Genetic and lifestyle predictors of 15-year longitudinal change in episodic memory. J Am Geriatr Soc. 2012;60:2308–2312. doi: 10.1111/jgs.12000. [DOI] [PubMed] [Google Scholar]
- Kaas JH. The evolution of the complex sensory and motor systems of the human brain. Brain Res Bull. 2008;75:384–390. doi: 10.1016/j.brainresbull.2007.10.009. [DOI] [PMC free article] [PubMed] [Google Scholar]
- Kawas C, Gray S, Brookmeyer R, Fozard J, Zonderman A. Age-specific incidence rates of Alzheimer’s disease: the Baltimore Longitudinal Study of Aging. Neurology. 2000;54:2072–2077. doi: 10.1212/wnl.54.11.2072. [DOI] [PubMed] [Google Scholar]
- Khachaturian ZS. Revised criteria for diagnosis of Alzheimer’s disease: National Institute on Aging-Alzheimer’s Association diagnostic guidelines for Alzheimer’s disease. Alzheimers Dement. 2011;7:253–256. doi: 10.1016/j.jalz.2011.04.003. [DOI] [PubMed] [Google Scholar]
- Knopman DS, Jack CR, Jr, Wiste HJ, Weigand SD, Vemuri P, Lowe VJ, Kantarci K, Gunter JL, Senjem ML, Mielke MM, Roberts RO, Boeve BF, Petersen RC. Brain injury biomarkers are not dependent on beta-amyloid in normal elderly. Ann Neurol. 2013 doi: 10.1002/ana.23816. in press. [DOI] [PMC free article] [PubMed] [Google Scholar]
- Koivisto K, Reinikainen KJ, Hanninen T, Vanhanen M, Helkala EL, Mykkanen L, Laakso M, Pyorala K, Riekkinen PJ., Sr Prevalence of age-associated memory impairment in a randomly selected population from eastern Finland. Neurology. 1995;45:741–747. doi: 10.1212/wnl.45.4.741. [DOI] [PubMed] [Google Scholar]
- Laird AR, Eickhoff SB, Li K, Robin DA, Glahn DC, Fox PT. Investigating the functional heterogeneity of the default mode network using coordinate-based meta-analytic modeling. J Neurosci. 2009;29:14496–14505. doi: 10.1523/JNEUROSCI.4004-09.2009. [DOI] [PMC free article] [PubMed] [Google Scholar]
- Landau SM, Marks SM, Mormino EC, Rabinovici GD, Oh H, O’Neil JP, Wilson RS, Jagust WJ. Association of lifetime cognitive engagement and low beta-amyloid deposition. Archives of neurology. 2012;69:623–629. doi: 10.1001/archneurol.2011.2748. [DOI] [PMC free article] [PubMed] [Google Scholar]
- Lazarov O, Mattson MP, Peterson DA, Pimplikar SW, van Praag H. When neurogenesis encounters aging and disease. Trends Neurosci. 2010;33:569–579. doi: 10.1016/j.tins.2010.09.003. [DOI] [PMC free article] [PubMed] [Google Scholar]
- Li S, Jin M, Zhang D, Yang T, Koeglsperger T, Fu H, Selkoe DJ. Environmental novelty activates beta2-adrenergic signaling to prevent the impairment of hippocampal LTP by Abeta oligomers. Neuron. 2013;77:929–941. doi: 10.1016/j.neuron.2012.12.040. [DOI] [PMC free article] [PubMed] [Google Scholar]
- Lilja AM, Rojdner J, Mustafiz T, Thome CM, Storelli E, Gonzalez D, Unger-Lithner C, Greig NH, Nordberg A, Marutle A. Age-dependent neuroplasticity mechanisms in Alzheimer Tg2576 mice following modulation of brain amyloid-beta levels. PLoS One. 2013;8:e58752. doi: 10.1371/journal.pone.0058752. [DOI] [PMC free article] [PubMed] [Google Scholar]
- Lotsch J, Schaeffeler E, Mittelbronn M, Winter S, Gudziol V, Schwarzacher SW, Hummel T, Doehring A, Schwab M, Ultsch A. Functional genomics suggest neurogenesis in the adult human olfactory bulb. Brain Struct Funct. 2013 doi: 10.1007/s00429-013-0618-3. in press. [DOI] [PubMed] [Google Scholar]
- Lustig C, Snyder AZ, Bhakta M, O’Brien KC, McAvoy M, Raichle ME, Morris JC, Buckner RL. Functional deactivations: change with age and dementia of the Alzheimer type. Proc Natl Acad Sci U S A. 2003;100:14504–14509. doi: 10.1073/pnas.2235925100. [DOI] [PMC free article] [PubMed] [Google Scholar]
- Mantini D, Corbetta M, Romani GL, Orban GA, Vanduffel W. Data-driven analysis of analogous brain networks in monkeys and humans during natural vision. Neuroimage. 2012;63:1107–1118. doi: 10.1016/j.neuroimage.2012.08.042. [DOI] [PMC free article] [PubMed] [Google Scholar]
- Mantini D, Corbetta M, Romani GL, Orban GA, Vanduffel W. Evolutionarily novel functional networks in the human brain? The Journal of neuroscience: the official journal of the Society for Neuroscience. 2013;33:3259–3275. doi: 10.1523/JNEUROSCI.4392-12.2013. [DOI] [PMC free article] [PubMed] [Google Scholar]
- Mawuenyega KG, Sigurdson W, Ovod V, Munsell L, Kasten T, Morris JC, Yarasheski KE, Bateman RJ. Decreased clearance of CNS beta-amyloid in Alzheimer’s disease. Science. 2010;330:1774. doi: 10.1126/science.1197623. [DOI] [PMC free article] [PubMed] [Google Scholar]
- McDonald CR, McEvoy LK, Gharapetian L, Fennema-Notestine C, Hagler DJ, Jr, Holland D, Koyama A, Brewer JB, Dale AM. Regional rates of neocortical atrophy from normal aging to early Alzheimer disease. Neurology. 2009;73:457–465. doi: 10.1212/WNL.0b013e3181b16431. [DOI] [PMC free article] [PubMed] [Google Scholar]
- McEvoy LK, Fennema-Notestine C, Roddey JC, Hagler DJ, Jr, Holland D, Karow DS, Pung CJ, Brewer JB, Dale AM. Alzheimer disease: quantitative structural neuroimaging for detection and prediction of clinical and structural changes in mild cognitive impairment. Radiology. 2009;251:195–205. doi: 10.1148/radiol.2511080924. [DOI] [PMC free article] [PubMed] [Google Scholar]
- McEvoy LK, Holland D, Hagler DJ, Jr, Fennema-Notestine C, Brewer JB, Dale AM. Mild cognitive impairment: baseline and longitudinal structural MR imaging measures improve predictive prognosis. Radiology. 2011;259:834–843. doi: 10.1148/radiol.11101975. [DOI] [PMC free article] [PubMed] [Google Scholar]
- McLean CA, Cherny RA, Fraser FW, Fuller SJ, Smith MJ, Beyreuther K, Bush AI, Masters CL. Soluble pool of Abeta amyloid as a determinant of severity of neurodegeneration in Alzheimer’s disease. Ann Neurol. 1999;46:860–866. doi: 10.1002/1531-8249(199912)46:6<860::aid-ana8>3.0.co;2-m. [DOI] [PubMed] [Google Scholar]
- Members ECC, Brayne C, Ince PG, Keage HA, McKeith IG, Matthews FE, Polvikoski T, Sulkava R. Education, the brain and dementia: neuroprotection or compensation? Brain. 2010;133:2210–2216. doi: 10.1093/brain/awq185. [DOI] [PubMed] [Google Scholar]
- Mesulam MM. Neuroplasticity failure in Alzheimer’s disease: bridging the gap between plaques and tangles. Neuron. 1999;24:521–529. doi: 10.1016/s0896-6273(00)81109-5. [DOI] [PubMed] [Google Scholar]
- Miyamoto K, Osada T, Adachi Y, Matsui T, Kimura HM, Miyashita Y. Functional differentiation of memory retrieval network in macaque posterior parietal cortex. Neuron. 2013;77:787–799. doi: 10.1016/j.neuron.2012.12.019. [DOI] [PubMed] [Google Scholar]
- Mormino EC, Brandel MG, Madison CM, Rabinovici GD, Marks S, Baker SL, Jagust WJ. Not quite PIB-positive, not quite PIB-negative: slight PIB elevations in elderly normal control subjects are biologically relevant. Neuro Image. 2012;59:1152–1160. doi: 10.1016/j.neuroimage.2011.07.098. [DOI] [PMC free article] [PubMed] [Google Scholar]
- Mormino EC, Kluth JT, Madison CM, Rabinovici GD, Baker SL, Miller BL, Koeppe RA, Mathis CA, Weiner MW, Jagust WJ. Episodic memory loss is related to hippocampal-mediated beta-amyloid deposition in elderly subjects. Brain. 2009;132:1310–1323. doi: 10.1093/brain/awn320. [DOI] [PMC free article] [PubMed] [Google Scholar]
- Morris JC, Roe CM, Xiong C, Fagan AM, Goate AM, Holtzman DM, Mintun MA. APOE predicts amyloid-beta but not tau Alzheimer pathology in cognitively normal aging. Ann Neurol. 2010;67:122–131. doi: 10.1002/ana.21843. [DOI] [PMC free article] [PubMed] [Google Scholar]
- Mu Y, Gage FH. Adult hippocampal neurogenesis and its role in Alzheimer’s disease. Mol Neurodegener. 2011;6:85. doi: 10.1186/1750-1326-6-85. [DOI] [PMC free article] [PubMed] [Google Scholar]
- Mungas D, Tractenberg R, Schneider JA, Crane PK, Bennett DA. A 2-process model for neuropathology of Alzheimer’s disease. Neurobiology of aging. 2014;35:301–308. doi: 10.1016/j.neurobiolaging.2013.08.007. [DOI] [PMC free article] [PubMed] [Google Scholar]
- Murphy EA, Holland D, Donohue M, McEvoy LK, Hagler DJ, Jr, Dale AM, Brewer JB. Six-month atrophy in MTL structures is associated with subsequent memory decline in elderly controls. Neuro Image. 2010;53:1310–1317. doi: 10.1016/j.neuroimage.2010.07.016. [DOI] [PMC free article] [PubMed] [Google Scholar]
- Neill D. Alzheimer’s disease: maladaptive synaptoplasticity hypothesis. Neurodegeneration. 1995;4:217–232. doi: 10.1006/neur.1995.0027. [DOI] [PubMed] [Google Scholar]
- Neill D. Should Alzheimer’s disease be equated with human brain ageing? A maladaptive interaction between brain evolution and senescence. Ageing Res Rev. 2012;11:104–122. doi: 10.1016/j.arr.2011.06.004. [DOI] [PubMed] [Google Scholar]
- Nelson PT, Abner EL, Schmitt FA, Kryscio RJ, Jicha GA, Santacruz K, Smith CD, Patel E, Markesbery WR. Brains with medial temporal lobe neurofibrillary tangles but no neuritic amyloid plaques are a diagnostic dilemma but may have pathogenetic aspects distinct from Alzheimer disease. Journal of neuropathology and experimental neurology. 2009;68:774–784. doi: 10.1097/NEN.0b013e3181aacbe9. [DOI] [PMC free article] [PubMed] [Google Scholar]
- Nelson PT, Alafuzoff I, Bigio EH, Bouras C, Braak H, Cairns NJ, Castellani RJ, Crain BJ, Davies P, Del Tredici K, Duyckaerts C, Frosch MP, Haroutunian V, Hof PR, Hulette CM, Hyman BT, Iwatsubo T, Jellinger KA, Jicha GA, Kovari E, Kukull WA, Leverenz JB, Love S, Mackenzie IR, Mann DM, Masliah E, McKee AC, Montine TJ, Morris JC, Schneider JA, Sonnen JA, Thal DR, Trojanowski JQ, Troncoso JC, Wisniewski T, Woltjer RL, Beach TG. Correlation of Alzheimer disease neuropathologic changes with cognitive status: a review of the literature. J Neuropathol Exp Neurol. 2012;71:362–381. doi: 10.1097/NEN.0b013e31825018f7. [DOI] [PMC free article] [PubMed] [Google Scholar]
- Nelson PT, Head E, Schmitt FA, Davis PR, Neltner JH, Jicha GA, Abner EL, Smith CD, Van Eldik LJ, Kryscio RJ, Scheff SW. Alzheimer’s disease is not “brain aging”: neuropathological, genetic, and epidemiological human studies. Acta Neuropathol. 2011;121:571–587. doi: 10.1007/s00401-011-0826-y. [DOI] [PMC free article] [PubMed] [Google Scholar]
- Nyberg L, Lovden M, Riklund K, Lindenberger U, Backman L. Memory aging and brain maintenance. Trends Cogn Sci. 2012;16:292–305. doi: 10.1016/j.tics.2012.04.005. [DOI] [PubMed] [Google Scholar]
- Nyberg L, Kim AS, Habib R, Levine B, Tulving E. Consciousness of subjective time in the brain. Proc Natl Acad Sci U S A. 2010a;107:22356–22359. doi: 10.1073/pnas.1016823108. [DOI] [PMC free article] [PubMed] [Google Scholar]
- Nyberg L, Salami A, Andersson M, Eriksson J, Kalpouzos G, Kauppi K, Lind J, Pudas S, Persson J, Nilsson LG. Longitudinal evidence for diminished frontal cortex function in aging. Proc Natl Acad Sci U S A. 2010b;107:22682–22686. doi: 10.1073/pnas.1012651108. [DOI] [PMC free article] [PubMed] [Google Scholar]
- Oh H, Madison C, Villeneuve S, Markley C, Jagust WJ. Association of Gray Matter Atrophy with Age, beta-Amyloid, and Cognition in Aging. Cerebral cortex. 2013 doi: 10.1093/cercor/bht017. in press. [DOI] [PMC free article] [PubMed] [Google Scholar]
- Oh H, Mormino EC, Madison C, Hayenga A, Smiljic A, Jagust WJ. β-Amyloid affects frontal and posterior brain networks in normal aging. Neuroimage. 2011;54:1887–1895. doi: 10.1016/j.neuroimage.2010.10.027. [DOI] [PMC free article] [PubMed] [Google Scholar]
- Ostby Y, Tamnes CK, Fjell AM, Westlye LT, Due-Tonnessen P, Walhovd KB. Heterogeneity in subcortical brain development: A structural magnetic resonance imaging study of brain maturation from 8 to 30 years. J Neurosci. 2009;29:11772–11782. doi: 10.1523/JNEUROSCI.1242-09.2009. [DOI] [PMC free article] [PubMed] [Google Scholar]
- Panizzon MS, Fennema-Notestine C, Eyler LT, Jernigan TL, Prom-Wormley E, Neale M, Jacobson K, Lyons MJ, Grant MD, Franz CE, Xian H, Tsuang M, Fischl B, Seidman L, Dale A, Kremen WS. Distinct genetic influences on cortical surface area and cortical thickness. Cereb Cortex. 2009;19:2728–2735. doi: 10.1093/cercor/bhp026. [DOI] [PMC free article] [PubMed] [Google Scholar]
- Park DC, Reuter-Lorenz P. The adaptive brain: aging and neurocognitive scaffolding. Annual review of psychology. 2009;60:173–196. doi: 10.1146/annurev.psych.59.103006.093656. [DOI] [PMC free article] [PubMed] [Google Scholar]
- Park JH, Seo SW, Kim C, Kim GH, Noh HJ, Kim ST, Kwak KC, Yoon U, Lee JM, Lee JW, Shin JS, Kim CH, Noh Y, Cho H, Kim HJ, Yoon CW, Oh SJ, Kim JS, Choe YS, Lee KH, Lee JH, Ewers M, Weiner MW, Werring DJ, Na DL. Pathogenesis of cerebral microbleeds: In vivo imaging of amyloid and subcortical ischemic small vessel disease in 226 individuals with cognitive impairment. Ann Neurol. 2013;73:584–593. doi: 10.1002/ana.23845. [DOI] [PubMed] [Google Scholar]
- Persson J, Pudas S, Lind J, Kauppi K, Nilsson LG, Nyberg L. Longitudinal Structure-Function Correlates in Elderly Reveal MTL Dysfunction with Cognitive Decline. Cereb Cortex. 2012;22:2297–2304. doi: 10.1093/cercor/bhr306. [DOI] [PubMed] [Google Scholar]
- Pfefferbaum A, Rohlfing T, Rosenbloom MJ, Chu W, Colrain IM, Sullivan EV. Variation in longitudinal trajectories of regional brain volumes of healthy men and women (ages 10 to 85 years) measured with atlas-based parcellation of MRI. Neuroimage. 2013;65:176–193. doi: 10.1016/j.neuroimage.2012.10.008. [DOI] [PMC free article] [PubMed] [Google Scholar]
- Rabbitt P. Frontal brain changes and cognitive performance in old age. Cortex. 2005;41:238–240. doi: 10.1016/s0010-9452(08)70906-7. [DOI] [PubMed] [Google Scholar]
- Rabbitt P. Between-individual variability and interpretation of associations between neurophysiological and behavioral measures in aging populations: comment on Salthouse (2011) Psychol Bull. 2011;137:785–789. doi: 10.1037/a0024580. [DOI] [PubMed] [Google Scholar]
- Rabbitt P, Lowe C, Shilling V. Frontal tests and models for cognitive ageing. European Journal of Cognitive Psychology. 2001;13:5–28. [Google Scholar]
- Raichle ME, MacLeod AM, Snyder AZ, Powers WJ, Gusnard DA, Shulman GL. A default mode of brain function. Proc Natl Acad Sci U S A. 2001;98:676–682. doi: 10.1073/pnas.98.2.676. [DOI] [PMC free article] [PubMed] [Google Scholar]
- Rakic P. Evolution of the neocortex: a perspective from developmental biology. Nat Rev Neurosci. 2009;10:724–735. doi: 10.1038/nrn2719. [DOI] [PMC free article] [PubMed] [Google Scholar]
- Rakic P, Ayoub AE, Breunig JJ, Dominguez MH. Decision by division: making cortical maps. Trends Neurosci. 2009;32:291–301. doi: 10.1016/j.tins.2009.01.007. [DOI] [PMC free article] [PubMed] [Google Scholar]
- Rapoport SI, Nelson PT. Biomarkers and evolution in Alzheimer disease. Prog Neurobiol. 2011;95:510–513. doi: 10.1016/j.pneurobio.2011.07.006. [DOI] [PMC free article] [PubMed] [Google Scholar]
- Raz N, Ghisletta P, Rodrigue KM, Kennedy KM, Lindenberger U. Trajectories of brain aging in middle-aged and older adults: regional and individual differences. Neuroimage. 2010;51:501–511. doi: 10.1016/j.neuroimage.2010.03.020. [DOI] [PMC free article] [PubMed] [Google Scholar]
- Raz N, Gunning-Dixon F, Head D, Rodrigue KM, Williamson A, Acker JD. Aging, sexual dimorphism, and hemispheric asymmetry of the cerebral cortex: replicability of regional differences in volume. Neurobiol Aging. 2004a;25:377–396. doi: 10.1016/S0197-4580(03)00118-0. [DOI] [PubMed] [Google Scholar]
- Raz N, Rodrigue KM, Head D, Kennedy KM, Acker JD. Differential aging of the medial temporal lobe: a study of a five-year change. Neurology. 2004b;62:433–438. doi: 10.1212/01.wnl.0000106466.09835.46. [DOI] [PubMed] [Google Scholar]
- Raz N, Lindenberger U. Only time will tell: cross-sectional studies offer no solution to the age-brain-cognition triangle: comment on Salthouse (2011) Psychol Bull. 2011;137:790–795. doi: 10.1037/a0024503. [DOI] [PMC free article] [PubMed] [Google Scholar]
- Raz N, Lindenberger U, Rodrigue KM, Kennedy KM, Head D, Williamson A, Dahle C, Gerstorf D, Acker JD. Regional brain changes in aging healthy adults: general trends, individual differences and modifiers. Cereb Cortex. 2005a;15:1676–1689. doi: 10.1093/cercor/bhi044. [DOI] [PubMed] [Google Scholar]
- Resnick SM, Pham DL, Kraut MA, Zonderman AB, Davatzikos C. Longitudinal magnetic resonance imaging studies of older adults: a shrinking brain. J Neurosci. 2003;23:3295–3301. doi: 10.1523/JNEUROSCI.23-08-03295.2003. [DOI] [PMC free article] [PubMed] [Google Scholar]
- Reuter M, Rosas HD, Fischl B. Highly accurate inverse consistent registration: a robust approach. Neuroimage. 2010;53:1181–1196. doi: 10.1016/j.neuroimage.2010.07.020. [DOI] [PMC free article] [PubMed] [Google Scholar]
- Reuter M, Schmansky NJ, Rosas HD, Fischl B. Within-subject template estimation for unbiased longitudinal image analysis. Neuroimage. 2012;61:1402–1418. doi: 10.1016/j.neuroimage.2012.02.084. [DOI] [PMC free article] [PubMed] [Google Scholar]
- Robakis NK. Are Abeta and its derivatives causative agents or innocent bystanders in AD? Neurodegener Dis. 2010;7:32–37. doi: 10.1159/000266476. [DOI] [PMC free article] [PubMed] [Google Scholar]
- Robbins TW, James M, Owen AM, Sahakian BJ, Lawrence AD, McInnes L, Rabbitt PM. A study of performance on tests from the CANTAB battery sensitive to frontal lobe dysfunction in a large sample of normal volunteers: implications for theories of executive functioning and cognitive aging. Cambridge Neuropsychological Test Automated Battery. J Int Neuropsychol Soc. 1998;4:474–490. doi: 10.1017/s1355617798455073. [DOI] [PubMed] [Google Scholar]
- Rodrigue KM, Raz N. Shrinkage of the entorhinal cortex over five years predicts memory performance in healthy adults. J Neurosci. 2004;24:956–963. doi: 10.1523/JNEUROSCI.4166-03.2004. [DOI] [PMC free article] [PubMed] [Google Scholar]
- Rodrigue KM, Rieck JR, Kennedy KM, Devous MD, Diaz-Arrastia R, Park DC. Risk Factors for beta-Amyloid Deposition in Healthy Aging: Vascular and Genetic Effects. JAMA neurology. 2013:1–7. doi: 10.1001/jamaneurol.2013.1342. [DOI] [PMC free article] [PubMed] [Google Scholar]
- Rosen C, Hansson O, Blennow K, Zetterberg H. Fluid biomarkers in Alzheimer’s disease-current concepts. Mol Neurodegener. 2013;8:20. doi: 10.1186/1750-1326-8-20. [DOI] [PMC free article] [PubMed] [Google Scholar]
- Salat DH, Kaye JA, Janowsky JS. Greater orbital prefrontal volume selectively predicts worse working memory performance in older adults. Cereb Cortex. 2002;12:494–505. doi: 10.1093/cercor/12.5.494. [DOI] [PubMed] [Google Scholar]
- Salat DH, Williams VJ, Leritz EC, Schnyer DM, Rudolph JL, Lipsitz LA, McGlinchey RE, Milberg WP. Inter-individual variation in blood pressure is associated with regional white matter integrity in generally healthy older adults. Neuroimage. 2012;59:181–192. doi: 10.1016/j.neuroimage.2011.07.033. [DOI] [PMC free article] [PubMed] [Google Scholar]
- Salthouse TA. The processing-speed theory of adult age differences in cognition. Psychol Rev. 1996;103:403–428. doi: 10.1037/0033-295x.103.3.403. [DOI] [PubMed] [Google Scholar]
- Salthouse TA. Memory aging from 18 to 80. Alzheimer Dis Assoc Disord. 2003;17:162–167. doi: 10.1097/00002093-200307000-00008. [DOI] [PubMed] [Google Scholar]
- Salthouse TA. When does age-related cognitive decline begin? Neurobiol Aging. 2009;30:507–514. doi: 10.1016/j.neurobiolaging.2008.09.023. [DOI] [PMC free article] [PubMed] [Google Scholar]
- Salthouse TA. Neuroanatomical substrates of age-related cognitive decline. Psychol Bull. 2011;137:753–784. doi: 10.1037/a0023262. [DOI] [PMC free article] [PubMed] [Google Scholar]
- Salthouse TA. Robust cognitive change. J Int Neuropsychol Soc. 2012;18:749–756. doi: 10.1017/S1355617712000380. [DOI] [PMC free article] [PubMed] [Google Scholar]
- Sanders J, Cowansage K, Baumgartel K, Mayford M. Elimination of dendritic spines with long-term memory is specific to active circuits. J Neurosci. 2012;32:12570–12578. doi: 10.1523/JNEUROSCI.1131-12.2012. [DOI] [PMC free article] [PubMed] [Google Scholar]
- Scahill RI, Frost C, Jenkins R, Whitwell JL, Rossor MN, Fox NC. A longitudinal study of brain volume changes in normal aging using serial registered magnetic resonance imaging. Arch Neurol. 2003;60:989–994. doi: 10.1001/archneur.60.7.989. [DOI] [PubMed] [Google Scholar]
- Schacter DL, Addis DR, Buckner RL. Remembering the past to imagine the future: the prospective brain. Nat Rev Neurosci. 2007;8:657–661. doi: 10.1038/nrn2213. [DOI] [PubMed] [Google Scholar]
- Schaie KW. “When does age-related cognitive decline begin?” Salthouse again reifies the “cross-sectional fallacy”. Neurobiol Aging. 2009;30:528–529. doi: 10.1016/j.neurobiolaging.2008.12.012. discussion 530–533. [DOI] [PMC free article] [PubMed] [Google Scholar]
- Schaie KW, Hofer SM. Longitudinal studies in research on aging. In: Schaie KW, Birren JE, editors. Handbook of the Psychology of Aging. 5. San Diego: Academic Press; 2001. pp. 53–77. [Google Scholar]
- Scheuner D, Eckman C, Jensen M, Song X, Citron M, Suzuki N, Bird TD, Hardy J, Hutton M, Kukull W, Larson E, Levy-Lahad E, Viitanen M, Peskind E, Poorkaj P, Schellenberg G, Tanzi R, Wasco W, Lannfelt L, Selkoe D, Younkin S. Secreted amyloid beta-protein similar to that in the senile plaques of Alzheimer’s disease is increased in vivo by the presenilin 1 and 2 and APP mutations linked to familial Alzheimer’s disease. Nat Med. 1996;2:864–870. doi: 10.1038/nm0896-864. [DOI] [PubMed] [Google Scholar]
- Schott JM, Bartlett JW, Fox NC, Barnes J. Increased brain atrophy rates in cognitively normal older adults with low cerebrospinal fluid Abeta1-42. Ann Neurol. 2010;68:825–834. doi: 10.1002/ana.22315. [DOI] [PubMed] [Google Scholar]
- Schretlen D, Pearlson GD, Anthony JC, Aylward EH, Augustine AM, Davis A, Barta P. Elucidating the contributions of processing speed, executive ability, and frontal lobe volume to normal age-related differences in fluid intelligence. J Int Neuropsychol Soc. 2000;6:52–61. doi: 10.1017/s1355617700611062. [DOI] [PubMed] [Google Scholar]
- Schuff N, Tosun D, Insel PS, Chiang GC, Truran D, Aisen PS, Jack CR, Jr, Weiner MW. Nonlinear time course of brain volume loss in cognitively normal and impaired elders. Neurobiol Aging. 2010 doi: 10.1016/j.neurobiolaging.2010.07.012. [DOI] [PMC free article] [PubMed] [Google Scholar]
- Schuff N, Woerner N, Boreta L, Kornfield T, Shaw LM, Trojanowski JQ, Thompson PM, Jack CR, Jr, Weiner MW. MRI of hippocampal volume loss in early Alzheimer’s disease in relation to ApoE genotype and biomarkers. Brain. 2009;132:1067–1077. doi: 10.1093/brain/awp007. [DOI] [PMC free article] [PubMed] [Google Scholar]
- Seldon HL. Does brain white matter growth expand the cortex like a balloon? Hypothesis and consequences. Laterality. 2005;10:81–95. doi: 10.1080/13576500342000310. [DOI] [PubMed] [Google Scholar]
- Seldon HL. Extended neocortical maturation time encompasses speciation, fatty acid and lateralization theories of the evolution of schizophrenia and creativity. Medical hypotheses. 2007;69:1085–1089. doi: 10.1016/j.mehy.2007.03.001. [DOI] [PubMed] [Google Scholar]
- Sepulcre J, Sabuncu MR, Becker A, Sperling R, Johnson KA. In vivo characterization of the early states of the amyloid-beta network. Brain. 2013;136:2239–2252. doi: 10.1093/brain/awt146. [DOI] [PMC free article] [PubMed] [Google Scholar]
- Shaw P, Kabani NJ, Lerch JP, Eckstrand K, Lenroot R, Gogtay N, Greenstein D, Clasen L, Evans A, Rapoport JL, Giedd JN, Wise SP. Neurodevelopmental trajectories of the human cerebral cortex. J Neurosci. 2008;28:3586–3594. doi: 10.1523/JNEUROSCI.5309-07.2008. [DOI] [PMC free article] [PubMed] [Google Scholar]
- Sherwood CC, Subiaul F, Zawidzki TW. A natural history of the human mind: tracing evolutionary changes in brain and cognition. J Anat. 2008;212:426–454. doi: 10.1111/j.1469-7580.2008.00868.x. [DOI] [PMC free article] [PubMed] [Google Scholar]
- Shim YS, Morris JC. Biomarkers predicting Alzheimer’s disease in cognitively normal aging. J Clin Neurol. 2011;7:60–68. doi: 10.3988/jcn.2011.7.2.60. [DOI] [PMC free article] [PubMed] [Google Scholar]
- Sliwinski M, Buschke H. Cross-sectional and longitudinal relationships among age, cognition, and processing speed. Psychol Aging. 1999;14:18–33. doi: 10.1037//0882-7974.14.1.18. [DOI] [PubMed] [Google Scholar]
- Snyder AZ, Raichle ME. A brief history of the resting state: The Washington University perspective. Neuroimage. 2012;62:902–910. doi: 10.1016/j.neuroimage.2012.01.044. [DOI] [PMC free article] [PubMed] [Google Scholar]
- Sojkova J, Zhou Y, An Y, Kraut MA, Ferrucci L, Wong DF, Resnick SM. Longitudinal patterns of -amyloid deposition in nondemented older adults. Arch Neurol. 2011;68:644–649. doi: 10.1001/archneurol.2011.77. [DOI] [PMC free article] [PubMed] [Google Scholar]
- Song Y, Stampfer MJ, Liu S. Meta-analysis: apolipoprotein E genotypes and risk for coronary heart disease. Annals of internal medicine. 2004;141:137–147. doi: 10.7326/0003-4819-141-2-200407200-00013. [DOI] [PubMed] [Google Scholar]
- Sperling RA, Aisen PS, Beckett LA, Bennett DA, Craft S, Fagan AM, Iwatsubo T, Jack CR, Jr, Kaye J, Montine TJ, Park DC, Reiman EM, Rowe CC, Siemers E, Stern Y, Yaffe K, Carrillo MC, Thies B, Morrison-Bogorad M, Wagster MV, Phelps CH. Toward defining the preclinical stages of Alzheimer’s disease: recommendations from the National Institute on Aging-Alzheimer’s Association workgroups on diagnostic guidelines for Alzheimer’s disease. Alzheimers Dement. 2011a;7:280–292. doi: 10.1016/j.jalz.2011.03.003. [DOI] [PMC free article] [PubMed] [Google Scholar]
- Sperling RA, Jack CR, Jr, Black SE, Frosch MP, Greenberg SM, Hyman BT, Scheltens P, Carrillo MC, Thies W, Bednar MM, Black RS, Brashear HR, Grundman M, Siemers ER, Feldman HH, Schindler RJ. Amyloid-related imaging abnormalities in amyloid-modifying therapeutic trials: recommendations from the Alzheimer’s Association Research Roundtable Workgroup. Alzheimers Dement. 2011b;7:367–385. doi: 10.1016/j.jalz.2011.05.2351. [DOI] [PMC free article] [PubMed] [Google Scholar]
- Squire LR, van der Horst AS, McDuff SG, Frascino JC, Hopkins RO, Mauldin KN. Role of the hippocampus in remembering the past and imagining the future. Proc Natl Acad Sci U S A. 2010;107:19044–19048. doi: 10.1073/pnas.1014391107. [DOI] [PMC free article] [PubMed] [Google Scholar]
- Stern Y. Cognitive reserve and Alzheimer disease. Alzheimer disease and associated disorders. 2006;20:112–117. doi: 10.1097/01.wad.0000213815.20177.19. [DOI] [PubMed] [Google Scholar]
- Stern Y. Cognitive reserve in ageing and Alzheimer’s disease. Lancet Neurol. 2012;11:1006–1012. doi: 10.1016/S1474-4422(12)70191-6. [DOI] [PMC free article] [PubMed] [Google Scholar]
- Stern Y, Albert S, Tang MX, Tsai WY. Rate of memory decline in AD is related to education and occupation: cognitive reserve? Neurology. 1999;53:1942–1947. doi: 10.1212/wnl.53.9.1942. [DOI] [PubMed] [Google Scholar]
- Storandt M, Mintun MA, Head D, Morris JC. Cognitive decline and brain volume loss as signatures of cerebral amyloid-beta peptide deposition identified with Pittsburgh compound B: cognitive decline associated with Abeta deposition. Arch Neurol. 2009;66:1476–1481. doi: 10.1001/archneurol.2009.272. [DOI] [PMC free article] [PubMed] [Google Scholar]
- Suddendorf T. Mental time travel: continuities and discontinuities. Trends Cogn Sci. 2013;17:151–152. doi: 10.1016/j.tics.2013.01.011. [DOI] [PubMed] [Google Scholar]
- Taki Y, Thyreau B, Kinomura S, Sato K, Goto R, Wu K, Kawashima R, Fukuda H. A longitudinal study of age- and gender-related annual rate of volume changes in regional gray matter in healthy adults. Hum Brain Mapp. 2013;34:2292–2301. doi: 10.1002/hbm.22067. [DOI] [PMC free article] [PubMed] [Google Scholar]
- Tamnes CK, Walhovd KB, Dale AM, Ostby Y, Grydeland H, Richardson G, Westlye LT, Roddey JC, Hagler DJ, Jr, Due-Tonnessen P, Holland D, Fjell AM. Brain development and aging: Overlapping and unique patterns of change. Neuroimage. 2012;68C:63–74. doi: 10.1016/j.neuroimage.2012.11.039. [DOI] [PMC free article] [PubMed] [Google Scholar]
- Thambisetty M, Wan J, Carass A, An Y, Prince JL, Resnick SM. Longitudinal changes in cortical thickness associated with normal aging. Neuroimage. 2010;52:1215–1223. doi: 10.1016/j.neuroimage.2010.04.258. [DOI] [PMC free article] [PubMed] [Google Scholar]
- Tosun D, Schuff N, Truran-Sacrey D, Shaw LM, Trojanowski JQ, Aisen P, Peterson R, Weiner MW. Relations between brain tissue loss, CSF biomarkers, and the ApoE genetic profile: a longitudinal MRI study. Neurobiol Aging. 2010;31:1340–1354. doi: 10.1016/j.neurobiolaging.2010.04.030. [DOI] [PMC free article] [PubMed] [Google Scholar]
- Vaishnavi SN, Vlassenko AG, Rundle MM, Snyder AZ, Mintun MA, Raichle ME. Regional aerobic glycolysis in the human brain. Proc Natl Acad Sci U S A. 2010;107:17757–17762. doi: 10.1073/pnas.1010459107. [DOI] [PMC free article] [PubMed] [Google Scholar]
- Valenzuela MJ, Sachdev P, Wen W, Chen X, Brodaty H. Lifespan mental activity predicts diminished rate of hippocampal atrophy. PLoS One. 2008;3:e2598. doi: 10.1371/journal.pone.0002598. [DOI] [PMC free article] [PubMed] [Google Scholar]
- Van Essen DC, Dierker DL. Surface-based and probabilistic atlases of primate cerebral cortex. Neuron. 2007;56:209–225. doi: 10.1016/j.neuron.2007.10.015. [DOI] [PubMed] [Google Scholar]
- van Soelen IL, Brouwer RM, van Baal GC, Schnack HG, Peper JS, Collins DL, Evans AC, Kahn RS, Boomsma DI, Hulshoff Pol HE. Genetic influences on thinning of the cerebral cortex during development. Neuroimage. 2012;59:3871–3880. doi: 10.1016/j.neuroimage.2011.11.044. [DOI] [PubMed] [Google Scholar]
- Vemuri P, Lesnick TG, Przybelski SA, Knopman DS, Roberts RO, Lowe VJ, Kantarci K, Senjem ML, Gunter JL, Boeve BF, Petersen RC, Jack CR., Jr Effect of lifestyle activities on Alzheimer disease biomarkers and cognition. Ann Neurol. 2012;72:730–738. doi: 10.1002/ana.23665. [DOI] [PMC free article] [PubMed] [Google Scholar]
- Vessal M, Darian-Smith C. Adult neurogenesis occurs in primate sensorimotor cortex following cervical dorsal rhizotomy. J Neurosci. 2010;30:8613–8623. doi: 10.1523/JNEUROSCI.5272-09.2010. [DOI] [PMC free article] [PubMed] [Google Scholar]
- Villain N, Chetelat G, Grassiot B, Bourgeat P, Jones G, Ellis KA, Ames D, Martins RN, Eustache F, Salvado O, Masters CL, Rowe CC, Villemagne VL, Group AR. Regional dynamics of amyloid- deposition in healthy elderly, mild cognitive impairment and Alzheimer’s disease: a voxelwise PiB-PET longitudinal study. Brain. 2012;135:2126–2139. doi: 10.1093/brain/aws125. [DOI] [PubMed] [Google Scholar]
- Villemagne VL, Burnham S, Bourgeat P, Brown B, Ellis KA, Salvado O, Szoeke C, Macaulay SL, Martins R, Maruff P, Ames D, Rowe CC, Masters CL Australian Imaging B, Lifestyle Research G. Amyloid deposition, neurodegeneration, and cognitive decline in sporadic Alzheimer’s disease: a prospective cohort study. Lancet Neurol. 2013;12:357–367. doi: 10.1016/S1474-4422(13)70044-9. [DOI] [PubMed] [Google Scholar]
- Vlassenko AG, Vaishnavi SN, Couture L, Sacco D, Shannon BJ, Mach RH, Morris JC, Raichle ME, Mintun MA. Spatial correlation between brain aerobic glycolysis and amyloid-beta (Abeta) deposition. Proc Natl Acad Sci U S A. 2010;107:17763–17767. doi: 10.1073/pnas.1010461107. [DOI] [PMC free article] [PubMed] [Google Scholar]
- Vogt BA, Nimchinsky EA, Vogt LJ, Hof PR. Human cingulate cortex: surface features, flat maps, and cytoarchitecture. J Comp Neurol. 1995;359:490–506. doi: 10.1002/cne.903590310. [DOI] [PubMed] [Google Scholar]
- Walhovd KB, Fjell AM, Dale AM, McEvoy LK, Brewer J, Karow DS, Salmon DP, Fennema-Notestine C. Multi-modal imaging predicts memory performance in normal aging and cognitive decline. Neurobiol Aging. 2010;31:1107–1121. doi: 10.1016/j.neurobiolaging.2008.08.013. [DOI] [PMC free article] [PubMed] [Google Scholar]
- West RL. An application of prefrontal cortex function theory to cognitive aging. Psychol Bull. 1996;120:272–292. doi: 10.1037/0033-2909.120.2.272. [DOI] [PubMed] [Google Scholar]
- White T, Su S, Schmidt M, Kao CY, Sapiro G. The development of gyrification in childhood and adolescence. Brain Cogn. 2010;72:36–45. doi: 10.1016/j.bandc.2009.10.009. [DOI] [PMC free article] [PubMed] [Google Scholar]
- Winkler AM, Kochunov P, Blangero J, Almasy L, Zilles K, Fox PT, Duggirala R, Glahn DC. Cortical thickness or grey matter volume? The importance of selecting the phenotype for imaging genetics studies. Neuro Image. 2010;53:1135–1146. doi: 10.1016/j.neuroimage.2009.12.028. [DOI] [PMC free article] [PubMed] [Google Scholar]
- Yeo BT, Krienen FM, Sepulcre J, Sabuncu MR, Lashkari D, Hollinshead M, Roffman JL, Smoller JW, Zollei L, Polimeni JR, Fischl B, Liu H, Buckner RL. The organization of the human cerebral cortex estimated by intrinsic functional connectivity. Journal of neurophysiology. 2011;106:1125–1165. doi: 10.1152/jn.00338.2011. [DOI] [PMC free article] [PubMed] [Google Scholar]
- Yoshizawa H, Gazes Y, Stern Y, Miyata Y, Uchiyama S. Characterizing the normative profile of F-FDG PET brain imaging: Sex difference, aging effect, and cognitive reserve. Psychiatry Res. 2013 doi: 10.1016/j.pscychresns.2013.10.009. in press. [DOI] [PubMed] [Google Scholar]
- Zatorre RJ, Fields RD, Johansen-Berg H. Plasticity in gray and white: neuroimaging changes in brain structure during learning. Nat Neurosci. 2012;15:528–536. doi: 10.1038/nn.3045. [DOI] [PMC free article] [PubMed] [Google Scholar]