Summary
Leptin reverses hyperglycemia in T1D though reductions in HPA-mediated lipolysis resulting in reduced hepatic gluconeogenesis through both substrate delivery and allosteric mechanisms.
Leptin treatment reverses hyperglycemia in animal models of poorly-controlled type 1 diabetes (T1D),1–6 spurring great interest in the possibility of treating T1D patients with leptin. The antidiabetic effect of leptin has been postulated to occur through suppression of glucagon production and/or suppression of glucagon responsiveness; however, there does not appear to be a direct effect of leptin on the pancreatic α-cell.7 Thus the mechanisms responsible for leptin’s anti-diabetic effect remain poorly understood. To this end, we quantified liver-specific rates of hepatic gluconeogenesis and substrate oxidation in conjunction with rates of whole-body acetate, glycerol and fatty acid turnover in three rat models of poorly controlled diabetes including a model of diabetic ketoacidosis (DKA).8 We show that higher rates of hepatic gluconeogenesis in all of these models could be attributed to hypoleptinemia-induced activity of the hypothalamic-pituitary-adrenal (HPA) resulting in higher rates of lipolysis, conversion of glycerol to glucose through a substrate push mechanism, and conversion of pyruvate to glucose through greater hepatic acetyl CoA allosteric activation of pyruvate carboxylase flux. Surprisingly these effects could be dissociated from changes in plasma insulin and glucagon concentrations and hepatic gluconeogenic protein expression. All of the altered systemic and hepatic metabolic fluxes were mimicked by infusing rats with Intralipid or corticosterone, and corrected by leptin replacement. These data demonstrate a critical role for lipolysis and substrate delivery to liver, secondary to hypoleptinemia and HPA activity, in promoting higher hepatic gluconeogenesis and hyperglycemia in poorly controlled diabetes.
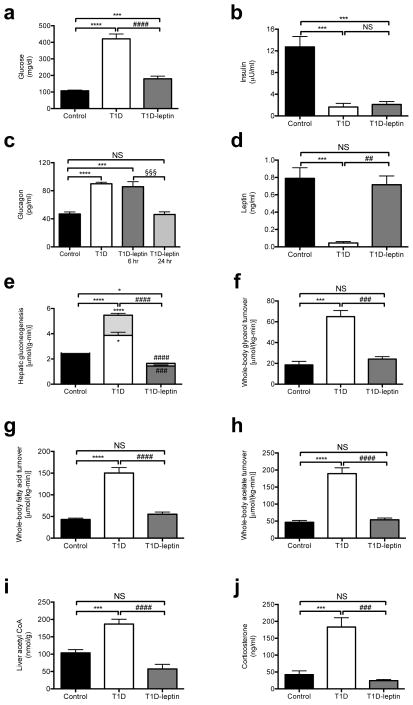
T1D rats have severe fasting hyperglycemia and ketoacidosis associated with approximately 90% lower plasma insulin and leptin concentrations and 90% higher plasma glucagon concentrations (Fig. 1a–d, Table S1), without any differences in the relative contributions of hepatic (91±4 vs. 91±2% in control and T1D rats, respectively) and renal (9±4 vs. 9±2% in control and T1D rats, respectively) gluconeogenesis to rates of whole body glucose production. Normalizing plasma leptin concentrations with a 6 hour intra-arterial leptin infusion resulted in 240 mg/dL lower plasma glucose concentrations and reversal of ketoacidosis without any difference in plasma insulin, glucagon, adiponectin, or FGF-21 concentrations or the phosphorylation of the glucagon target cyclic AMP response element-binding protein (CREB) (Fig. 1a–d, Fig. S1a–c). Notably normalization of plasma glucagon concentrations did not occur until 24 hours following leptin treatment, which was more than twelve hours after normalization of plasma glucose, corticosterone and ACTH concentrations (Fig. 1c). Leptin treatment was associated with 60% lower hepatic gluconeogenesis rates in T1D rats through reductions of both pyruvate and glycerol conversion to glucose (Fig. 1e). In contrast, although total TCA cycle flux (VTCA) did not change, fatty acid oxidation was greater in the livers of T1D rats, and this perturbation was reversed with leptin treatment (Fig. 1f). The lower contribution of glycerol to hepatic gluconeogenesis with leptin treatment was strongly associated with reduced rates of whole body lipolysis as reflected by 60% lower rates of whole-body glycerol and palmitic acid turnover and plasma glycerol and non-esterified fatty acid (NEFA) concentrations (Fig. 1f–g, Fig. S1e–f). The rise in whole-body rates of lipolysis in leptin-deficient T1D rats was also associated with 3-fold higher acetate turnover, 250% higher plasma acetate concentrations, and 80% higher liver acetyl CoA concentrations in T1D rats, all of which were reversed with leptin treatment (Fig. 1h–i, Fig. S1g). As acetyl CoA is a potent allosteric activator of pyruvate carboxylase activity9–12 and inhibitor of pyruvate dehydrogenase (PDH) activity,13 the observed alterations in hepatic acetyl CoA concentrations in the T1D and T1D-leptin treated group likely explain the observed differences in hepatic pyruvate carboxylase flux (VPC) and hepatic PDH flux (VPDH) between these groups of animals. To determine the reason for the improvement in ketoacidosis with leptin treatment, we measured hepatic malonyl CoA concentrations, and, consistent with the reversal of the ketoacidosis in the T1D rats, as reflected by the normalization of the anion gap and reductions in plasma β-hydroxybutyrate concentrations,14 we found that the lower malonyl CoA concentrations present in the poorly controlled T1D rats were normal after leptin treatment (Fig. S1h).
Fig. 1.
Leptin reverses hyperglycemia and excess gluconeogenesis from pyruvate and glycerol in streptozotocin-induced type 1 diabetic (T1D) rats. (a)–(d) Fasting plasma glucose, insulin, glucagon, and leptin concentrations. In panel (d), n=16 for all groups. (e) Hepatic gluconeogenesis from pyruvate (lower bars) and glycerol (upper bars). P-values over the bars represent comparisons of total gluconeogenic flux. Gluconeogenesis from both pyruvate and glycerol was increased (P<0.05 and P<0.0001, respectively) in T1D rats vs. controls, and decreased (P<0.001 and P<0.0001, respectively) in T1D-leptin treated vs. T1D rats. (f)–(h) Whole-body glycerol, fatty acid (palmitate), and acetate turnover. (i) Liver acetyl CoA concentration. (j) 12 p.m. plasma corticosterone concentrations. Data are mean ± S.E. If not otherwise specified, n=6–8 per group. *P<0.05, ***P<0.001, ****P<0.0001 vs. control; ##P<0.01, ###P<0.001, ####P<0.0001 vs. T1D; §§§P<0.001 vs. T1D-leptin 6 hr.
While it is possible that leptin may also have a direct effect on muscle glucose uptake and/or peripheral insulin sensitivity as has been reported in some1,15,16 but not all studies,2,17 our data imply that the effect of leptin to reverse fasting hyperglycemia and associated with DKA can mostly be explained by leptin suppression of substrate delivery to the liver by reduction of whole body rates of lipolysis resulting in lower rates of hepatic gluconeogenesis and glucose production. In order to examine the mechanism for the greater lipolysis and its reversal with leptin treatment, we measured plasma catecholamines, growth hormone and corticosterone concentrations. In contrast to plasma epinephrine and norepinephrine, which were not different between groups, and growth hormone, which was lower in T1D rats, we found that plasma corticosterone and ACTH concentrations obtained at 1200 (noon) were markedly greater in the T1D rats (Fig. 1j, Fig. S1i–l). Taken together these data suggest a critical role for the hypothalamic-pituitary-adrenal axis in promoting the higher rates of lipolysis in the T1D group.
To assess whether alterations in plasma insulin concentrations accounted for the hypoleptinemia and/or the elevated gluconeogenesis observed in the T1D model, we also measured these fluxes in rats rendered both hyperglycemic and hyperinsulinemic, due to three-day high fat feeding combined with low dose streptozotocin and nicotinamide treatment (hyperinsulinemic-diabetic rat model), and found that all alterations in hepatic anaplerotic and oxidative fluxes in the T1D rat model were replicated in the hyperinsulinemic-diabetic rats. Hyperinsulinemic-diabetic rats were equally as hyperglycemic as the T1D group despite ~40-fold higher plasma insulin concentrations (Fig. S2a–b), but in contrast to the T1D rats were not ketoacidotic (Table S2). However, hyperinsulinemic-diabetic rats were similarly leptin deficient as compared to the T1D rats (Fig. S2d). Restoring plasma leptin concentrations with a 6 hr intra-arterial leptin infusion normalized plasma glucose, corticosterone, and ACTH concentrations and rates of hepatic gluconeogenesis from pyruvate and glycerol without altering plasma insulin concentrations or VTCA flux (Fig. S2a–h). Similar to the T1D group, whole-body glycerol, fatty acid, and acetate turnover were reduced, as were hepatic acetyl CoA concentrations (Fig. S2i–l), In contrast, mRNA and protein expression of key gluconeogenic enzymes were not different between the control, hyperinsulinemic-diabetic, and T1D groups (Fig. S3a–g). Taken together, these data imply that excess hepatic substrate flux, independent of insulin, is responsible for the uncontrolled gluconeogenesis of poorly controlled T1D and the improvement in glycemia associated with leptin treatment.
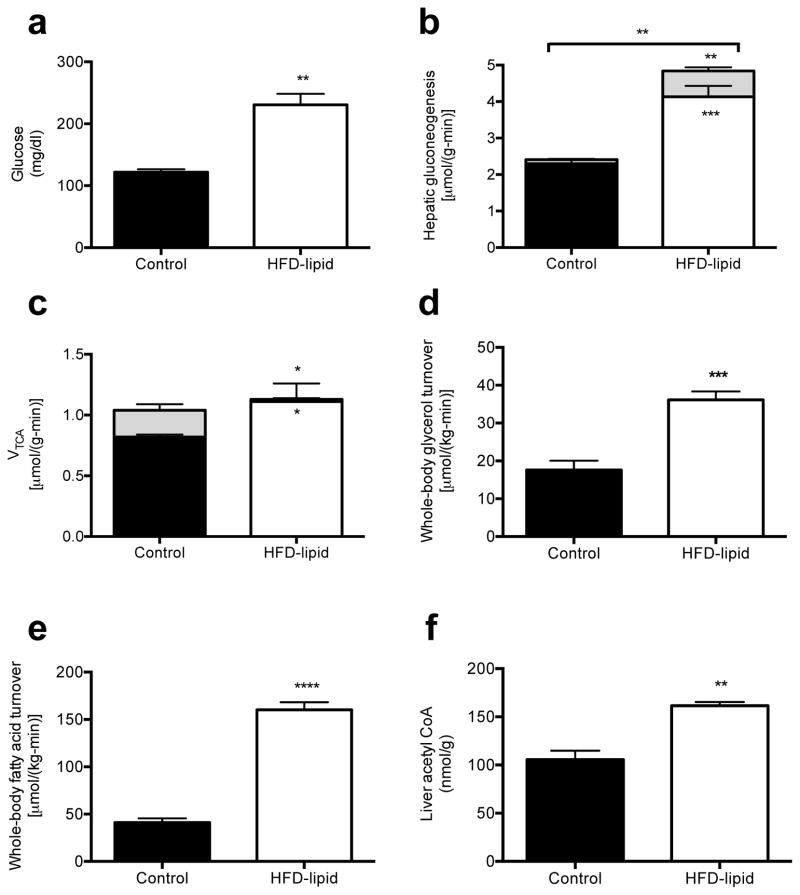
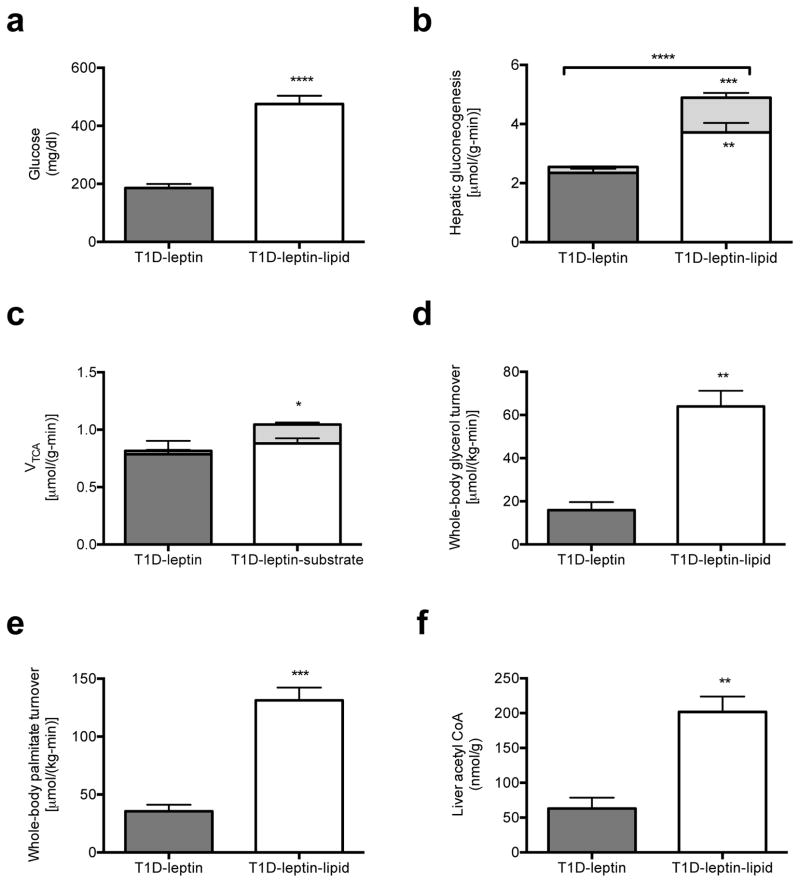
Based on these data, we next examined whether the higher rates of whole-body lipolysis due to leptin deficiency might be playing a role in causing excess gluconeogenesis in the T1D rats. We reasoned that increased glycerol turnover would drive hepatic gluconeogenesis through a substrate-dependent process,3,18 whereas an increase in acetate and fatty acid turnover would increase gluconeogenesis through allosteric activation of pyruvate carboxylase by acetyl CoA. In order to determine whether excess substrate availability alone could induce any of the changes to hepatic fluxes measured in poorly controlled T1D rats, we performed a 24-hour infusion of heparin and Intralipid.19 Consistent with our hypothesis, this intervention resulted in higher plasma glucose concentrations and gluconeogenesis from both pyruvate and glycerol despite greater plasma insulin concentrations and no changes in plasma glucagon, FGF-21 or adiponectin concentrations (Fig. 2a–b, Fig. S4a–d). As observed in the other diabetic rodent models excess hepatic gluconeogenesis could be attributed to markedly higher rates of whole-body glycerol and fatty acid turnover without any change in total hepatic TCA cycle flux (Fig. 2c–e, Fig. S4e–f). Consistent with the greater VPC and reduced VPDH flux, hepatic acetyl concentrations were higher by ~50% in the lipid-infused group (Fig. 2f). To further investigate the role of substrate regulation by leptin, we co-infused leptin-treated T1D rats with Intralipid and heparin and found that raising acetyl CoA, glycerol and fatty acid concentrations by exogenous substrate administration abrogated leptin’s effect to correct hyperglycemia and normalize rates of hepatic gluconeogenesis from glycerol and pyruvate (Fig. 3a–f, Fig. S5a–f). Taken together, these data demonstrate that excess substrate flux, derived from excess peripheral lipolysis, drives increased rates of hepatic gluconeogenesis in poorly controlled diabetes both through increasing glycerol supply and through allosteric activation of pyruvate carboxylase by increased acetyl CoA. Thus these studies demonstrate the critical role of increased substrate delivery to the liver and allosteric regulation of pyruvate carboxylase activity as the key factors responsible for causing the increased rates of gluconeogenesis in poorly controlled T1D. Furthermore by demonstrating profound elevations in rates of hepatic gluconeogenesis, independent of changes in hepatic gluconeogenic protein expression, these results also challenge the canonical role for alterations in hepatic gluconeogenic gene and protein expression as being the major contributor to increased hepatic gluconeogenesis in poorly controlled diabetes.
Fig. 2.
24 hr lipid infusion in 3-day high fat fed rats replicates the perturbations to fluxes seen in T1D and hyperinsulinemic-diabetic rats and implicates increased substrate supply in the excess gluconeogenesis of T1D. (a) Plasma glucose. (b) Hepatic gluconeogenesis from pyruvate (lower bars) and glycerol (upper bars). Gluconeogenesis from both pyruvate and glycerol was increased (P<0.001 and P<0.01, respectively) in lipid-infused rats. (c) TCA cycle flux from fatty acid oxidation (lower bars) and through PDH (upper bars). VTCA from fatty acid oxidation was increased and VTCA through PDH was decreased (P<0.05) in lipid-infused rats. (d), (e) Whole-body glycerol and fatty acid (palmitate) turnover. (f) Liver acetyl CoA concentration. In all panels, data are mean ± S.E. of n=6 per group. *P<0.05, **P<0.01, ***P<0.001, ****P<0.0001.
Fig. 3.
Substrate (Intralipid/heparin) infusion blocks leptin’s effect to suppress hepatic gluconeogenesis in T1D rats. (a) Fasting plasma glucose. (b) Hepatic gluconeogenesis from pyruvate (lower bars) and glycerol (upper bars). Gluconeogenesis from both pyruvate and glycerol was increased (P<0.01 and P<0.001, respectively) in lipid-infused rats. (c) VTCA from fatty acid oxidation (lower bars) and through pyruvate dehydrogenase (upper bars). VTCA through PDH was increased (P<0.05) in lipid-infused rats. (d), (e) Whole-body glycerol and palmitic acid oxidation. (f) Liver acetyl CoA concentration. In all panels, data are mean ± S.E. of n=6 per group. *P<0.05, **P<0.01, ***P<0.001, ****P<0.0001.
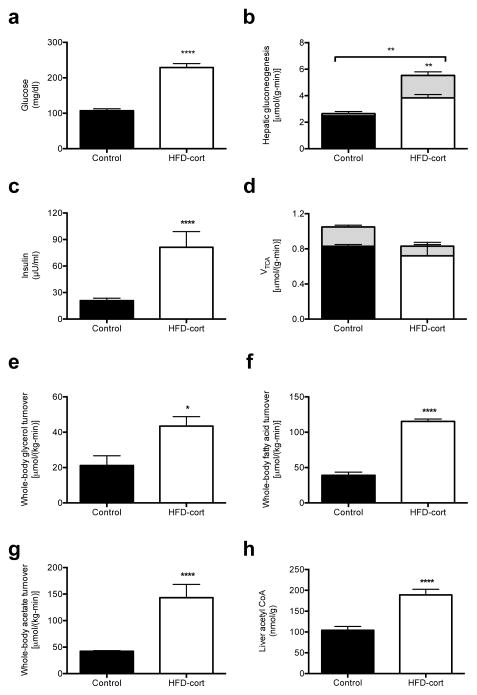
Because hypercorticosteronemia has been observed in leptin-deficient and leptin-resistant rodent models20,21 and leptin has been identified as a suppressor of ACTH-dependent cortisol secretion in vitro,22 we hypothesized that leptin deficiency may be responsible for increased HPA activity leading to higher rates of lipolysis and rates of gluconeogenesis in the T1D rats (Fig. 1e–j). To determine if these elevations in plasma corticosterone concentrations would promote similar increases in rates of lipolysis as observed in the T1D rats we injected high fat fed rats with intra-arterial corticosterone for 24 hr to achieve similar plasma levels of corticosterone (163±19 vs. 187±30 ng/mL, P=0.6) as was observed in the T1D rats. This intervention resulted in more than 100 mg/dl higher plasma glucose concentrations, which was associated with greater hepatic gluconeogenesis from both pyruvate and glycerol, despite three-fold higher plasma insulin concentrations (Fig. 4a–c). In contrast these changes were not associated with any changes in the TCA cycle flux (Fig. 4d). These higher rates of hepatic gluconeogenesis were driven by greater whole-body glycerol, fatty acid and acetate turnover which were associated with higher plasma glycerol, fatty acid, and acetate concentrations as well as hepatic acetyl CoA concentrations similar to what was observed in the T1D rats (Fig. 4e–h, Fig. S6a–c). In contrast, there was no difference in plasma glucagon, FGF-21, or adiponectin concentrations (Fig. 6d–f).
Fig. 4.
Matching plasma corticosterone in high fat fed-corticosterone infused rats to that of T1D animals drives excess lipolysis, gluconeogenesis, and hyperglycemia. (a) Fasting plasma glucose. (b) Hepatic gluconeogenesis from pyruvate (solid bars) and glycerol (dashed bars). Gluconeogenesis from glycerol was increased (P<0.01) in corticosterone-infused rats. (c) Fasting plasma insulin. (d) TCA cycle flux from fatty acid oxidation (solid bars) and through PDH (dashed bars). (e)–(g) Whole-body glycerol, fatty acid (palmitate) and acetate turnover. (h) Liver acetyl CoA concentration. In all panels, data are mean ± S.E.M., n=6 per group. *P<0.05, **P<0.01, ****P<0.0001.
In order to test the mechanism of ACTH-driven increases in corticosterone in driving hyperglycemia in the T1D rat, we treated diabetic rats with mifepristone, a potent glucocorticoid receptor antagonist.23 Consistent with a major role for increased HPA activity in driving increased lipolysis and hepatic gluconeogenesis, treatment with the glucocorticoid receptor blockade resulted in >200 mg/dl lower fasting plasma glucose concentrations compared to the control T1D group despite identical fasting plasma insulin and glucagon concentrations (Fig. S7a–c). Improvements in glycemia could be attributed to reduced hepatic gluconeogenesis from both pyruvate and glycerol without any changes in total VTCA (Figure S7d–e). Mifepristone-treated T1D rats exhibited 75–85% lower whole-body glycerol, fatty acid and acetate turnover, as well as >40% lower plasma glycerol, fatty acid and acetate concentrations, associated with 60% lower hepatic acetyl CoA concentrations (Fig. S7f–l). Thus the lower fasting plasma glucose concentrations in hyperglycemic T1D rats treated with glucocorticoid receptor antagonism can be attributed to reductions in rates of whole-body lipolysis and in hepatic acetyl CoA content.
In order to determine whether these findings were specific to the acute ketoacidotic state of the streptozotocin-induced T1D rat, we also examined this question in BioBreeding (BB) rats, a genetic rat model of T1D. Similar to the streptozotocin-induced T1D model, the BB rats exhibited severe hyperglycemia associated with hypoleptinemia, as well as hyperglucagonemia and insulinopenia (Fig. S8a–d). Correcting hypoleptinemia normalized plasma glucose concentrations and hepatic gluconeogenesis within 6 hours by correcting lipolysis and normalizing hepatic acetyl CoA concentrations (Fig. S8e–j). Consistent with our findings in other diabetic rat models, hyperglycemia was associated with higher plasma corticosterone and ACTH concentrations, which were corrected in the leptin-infused group (Fig. 8k–l). Also similar to our observations in T1D rats, plasma glucagon concentrations normalized after 24 hours of leptin treatment, which was more than 12 hours following reductions in plasma ACTH, corticosterone and plasma glucose concentrations thus temporally dissociating leptin-induced reductions in plasma glucagon concentrations from leptin-induced reductions in plasma ACTH, corticosterone and glucose concentrations (Fig. S8c).
Taken together, these data identify a key role for hypoleptinemia-induced increases in HPA activity in contributing to the increased rates of hepatic gluconeogenesis, fasting hyperglycemia and ketoacidosis in rodent models of T1D through glucocorticoid-mediated increases in lipolysis (Fig. S9A) and provide the mechanism for correction of hyperglycemia in these animals following systemic or ventromedial administration of leptin (Fig. S9B).2,24,25 Furthermore these results have potential translational significance given previous studies that have documented increases in plasma cortisol concentrations in T1D patients in diabetic ketoacidosis.26–28 Whether this mechanism also contributes to leptin’s ability to reverse insulin resistance and hyperglycemia in patients with severe lipodystrophy, in addition to its ability to decrease hepatic steatosis and intramyocellular lipid content,29 remains to be determined.
Supplementary Material
Acknowledgments
The authors thank V. Samuel, D. Befroy and K. Petersen for helpful discussions and J. Dong, Y. Kosover, M. Kahn, B. Perler, J. Stack, and M. Batsu for expert technical support. This study was funded by grants from the National Institutes of Health (R01 DK-40936, R24 DK-085638, U24 DK-059635, P30 DK-45735), American Diabetes Association-Merck Clinical/Translational Science Postdoctoral Fellowship Award from the American Diabetes Association and the Novo Nordisk Foundation for Metabolic Research.
Footnotes
Author Contributions
R.J.P. and G.I.S. designed the experimental protocols. R.J.P., X-M.Z., D.Z., N.K., J-P.G.C., and G.W.C. performed the studies. All authors contributed to the analysis of data. R.J.P. and G.I.S. wrote the manuscript.
References and Notes
- 1.Fujikawa T, et al. Leptin engages a hypothalamic neurocircuitry to permit survival in the absence of insulin. Cell metabolism. 2013;18:431–444. doi: 10.1016/j.cmet.2013.08.004. [DOI] [PMC free article] [PubMed] [Google Scholar]
- 2.Meek TH, et al. Leptin action in the ventromedial hypothalamic nucleus is sufficient, but not necessary, to normalize diabetic hyperglycemia. Endocrinology. 2013;154:3067–3076. doi: 10.1210/en.2013-1328. [DOI] [PMC free article] [PubMed] [Google Scholar]
- 3.Fujikawa T, Chuang JC, Sakata I, Ramadori G, Coppari R. Leptin therapy improves insulin-deficient type 1 diabetes by CNS-dependent mechanisms in mice. Proceedings of the National Academy of Sciences of the United States of America. 2010;107:17391–17396. doi: 10.1073/pnas.1008025107. [DOI] [PMC free article] [PubMed] [Google Scholar]
- 4.Wang MY, et al. Leptin therapy in insulin-deficient type I diabetes. Proceedings of the National Academy of Sciences of the United States of America. 2010;107:4813–4819. doi: 10.1073/pnas.0909422107. [DOI] [PMC free article] [PubMed] [Google Scholar]
- 5.Chinookoswong N, Wang JL, Shi ZQ. Leptin restores euglycemia and normalizes glucose turnover in insulin-deficient diabetes in the rat. Diabetes. 1999;48:1487–1492. doi: 10.2337/diabetes.48.7.1487. [DOI] [PubMed] [Google Scholar]
- 6.Lin CY, Higginbotham DA, Judd RL, White BD. Central leptin increases insulin sensitivity in streptozotocin-induced diabetic rats. American journal of physiology. Endocrinology and metabolism. 2002;282:E1084–1091. doi: 10.1152/ajpendo.00489.2001. [DOI] [PubMed] [Google Scholar]
- 7.Chen L, Philippe J, Unger RH. Glucagon responses of isolated alpha cells to glucose, insulin, somatostatin, and leptin. Endocrine practice : official journal of the American College of Endocrinology and the American Association of Clinical Endocrinologists. 2011;17:819–825. doi: 10.4158/EP11101.OR. [DOI] [PubMed] [Google Scholar]
- 8.Craighead JE. Experimental models of juvenile onset (insulin-dependent) diabetes mellitus. Monographs in pathology. 1980;21:166–176. [PubMed] [Google Scholar]
- 9.Utter MF, Keech DB. Formation of oxaloacetate from pyruvate and carbon dioxide. The Journal of biological chemistry. 1960;235:PC17–18. [PubMed] [Google Scholar]
- 10.Scrutton MC, White MD. Pyruvate carboxylase from rat liver: catalytic properties in the absence, and at low concentrations, of acetyl-CoA. Biochemical and biophysical research communications. 1972;48:85–93. doi: 10.1016/0006-291x(72)90347-6. [DOI] [PubMed] [Google Scholar]
- 11.McClure WR, Lardy HA, Kneifel HP. Rat liver pyruvate carboxylase. I. Preparation, properties, and cation specificity. The Journal of biological chemistry. 1971;246:3569–3578. [PubMed] [Google Scholar]
- 12.Warren GB, Tipton KF. Pig liver pyruvate carboxylase. The reaction pathway for the carboxylation of pyruvate. The Biochemical journal. 1974;139:311–320. doi: 10.1042/bj1390311. [DOI] [PMC free article] [PubMed] [Google Scholar]
- 13.Sugden MC, Holness MJ. Recent advances in mechanisms regulating glucose oxidation at the level of the pyruvate dehydrogenase complex by PDKs. American journal of physiology. Endocrinology and metabolism. 2003;284:E855–862. doi: 10.1152/ajpendo.00526.2002. [DOI] [PubMed] [Google Scholar]
- 14.Kitabchi AE, Wall BM. Diabetic ketoacidosis. The Medical clinics of North America. 1995;79:9–37. doi: 10.1016/s0025-7125(16)30082-7. [DOI] [PubMed] [Google Scholar]
- 15.Minokoshi Y, Toda C, Okamoto S. Regulatory role of leptin in glucose and lipid metabolism in skeletal muscle. Indian journal of endocrinology and metabolism. 2012;16:S562–568. doi: 10.4103/2230-8210.105573. [DOI] [PMC free article] [PubMed] [Google Scholar]
- 16.Toda C, et al. Extracellular signal-regulated kinase in the ventromedial hypothalamus mediates leptin-induced glucose uptake in red-type skeletal muscle. Diabetes. 2013;62:2295–2307. doi: 10.2337/db12-1629. [DOI] [PMC free article] [PubMed] [Google Scholar]
- 17.Laker RC, et al. Central infusion of leptin does not increase AMPK signaling in skeletal muscle of sheep. American journal of physiology. Regulatory, integrative and comparative physiology. 2011;300:R511–518. doi: 10.1152/ajpregu.00079.2010. [DOI] [PubMed] [Google Scholar]
- 18.Previs SF, Cline GW, Shulman GI. A critical evaluation of mass isotopomer distribution analysis of gluconeogenesis in vivo. The American journal of physiology. 1999;277:E154–160. doi: 10.1152/ajpendo.1999.277.1.E154. [DOI] [PubMed] [Google Scholar]
- 19.Boden G, Chen X, Rosner J, Barton M. Effects of a 48-h fat infusion on insulin secretion and glucose utilization. Diabetes. 1995;44:1239–1242. doi: 10.2337/diab.44.10.1239. [DOI] [PubMed] [Google Scholar]
- 20.Dubuc PU. Basal corticosterone levels of young og/ob mice. Hormone and metabolic research = Hormon- und Stoffwechselforschung = Hormones et metabolisme. 1977;9:95–97. doi: 10.1055/s-0028-1095550. [DOI] [PubMed] [Google Scholar]
- 21.Coleman DL, Burkart DL. Plasma corticosterone concentrations in diabetic (db) mice. Diabetologia. 1977;13:25–26. doi: 10.1007/BF00996323. [DOI] [PubMed] [Google Scholar]
- 22.Szucs N, et al. Leptin inhibits cortisol and corticosterone secretion in pathologic human adrenocortical cells. Pituitary. 2001;4:71–77. doi: 10.1023/a:1012990928218. [DOI] [PubMed] [Google Scholar]
- 23.Loose DS, Stover EP, Feldman D. Ketoconazole binds to glucocorticoid receptors and exhibits glucocorticoid antagonist activity in cultured cells. The Journal of clinical investigation. 1983;72:404–408. doi: 10.1172/JCI110982. [DOI] [PMC free article] [PubMed] [Google Scholar]
- 24.da Silva AA, Tallam LS, Liu J, Hall JE. Chronic antidiabetic and cardiovascular actions of leptin: role of CNS and increased adrenergic activity. American journal of physiology. Regulatory, integrative and comparative physiology. 2006;291:R1275–1282. doi: 10.1152/ajpregu.00187.2006. [DOI] [PubMed] [Google Scholar]
- 25.Wang J, Wernette CM, Judd RL, Huggins KW, White BD. Guanethidine treatment does not block the ability of central leptin administration to decrease blood glucose concentrations in streptozotocin-induced diabetic rats. The Journal of endocrinology. 2008;198:541–548. doi: 10.1677/JOE-08-0135. [DOI] [PubMed] [Google Scholar]
- 26.Hathout EH, et al. Changes in plasma leptin during the treatment of diabetic ketoacidosis. The Journal of clinical endocrinology and metabolism. 1999;84:4545–4548. doi: 10.1210/jcem.84.12.6184. [DOI] [PubMed] [Google Scholar]
- 27.Kratzsch J, et al. Metabolic decompensation in children with type 1 diabetes mellitus associated with increased serum levels of the soluble leptin receptor. European journal of endocrinology/European Federation of Endocrine Societies. 2006;155:609–614. doi: 10.1530/eje.1.02261. [DOI] [PubMed] [Google Scholar]
- 28.Kitabchi AE, Umpierrez GE. Changes in serum leptin in lean and obese subjects with acute hyperglycemic crises. The Journal of clinical endocrinology and metabolism. 2003;88:2593–2596. doi: 10.1210/jc.2002-021975. [DOI] [PubMed] [Google Scholar]
- 29.Petersen KF, et al. Leptin reverses insulin resistance and hepatic steatosis in patients with severe lipodystrophy. The Journal of clinical investigation. 2002;109:1345–1350. doi: 10.1172/JCI15001. [DOI] [PMC free article] [PubMed] [Google Scholar]
- 30.Perry RJ, et al. Reversal of hypertriglyceridemia, fatty liver disease, and insulin resistance by a liver-targeted mitochondrial uncoupler. Cell metabolism. 2013;18:740–748. doi: 10.1016/j.cmet.2013.10.004. [DOI] [PMC free article] [PubMed] [Google Scholar]
- 31.Erion DM, et al. The role of the carbohydrate response element-binding protein in male fructose-fed rats. Endocrinology. 2013;154:36–44. doi: 10.1210/en.2012-1725. [DOI] [PMC free article] [PubMed] [Google Scholar]
- 32.Alves TC, et al. Regulation of hepatic fat and glucose oxidation in rats with lipid-induced hepatic insulin resistance. Hepatology. 2011;53:1175–1181. doi: 10.1002/hep.24170. [DOI] [PMC free article] [PubMed] [Google Scholar]
- 33.Krebs HA. The equilibrium constants of the fumarase and aconitase systems. The Biochemical journal. 1953;54:78–82. doi: 10.1042/bj0540078. [DOI] [PMC free article] [PubMed] [Google Scholar]
- 34.Jucker BM, Lee JY, Shulman RG. In vivo 13C NMR measurements of hepatocellular tricarboxylic acid cycle flux. The Journal of biological chemistry. 1998;273:12187–12194. doi: 10.1074/jbc.273.20.12187. [DOI] [PubMed] [Google Scholar]
- 35.Shen J, Xu S. Theoretical analysis of carbon-13 magnetization transfer for in vivo exchange between alpha-ketoglutarate and glutamate. NMR in biomedicine. 2006;19:248–254. doi: 10.1002/nbm.1021. [DOI] [PubMed] [Google Scholar]
- 36.Jurczak MJ, et al. Dissociation of inositol-requiring enzyme (IRE1alpha)-mediated c-Jun N-terminal kinase activation from hepatic insulin resistance in conditional X-box-binding protein-1 (XBP1) knock-out mice. The Journal of biological chemistry. 2012;287:2558–2567. doi: 10.1074/jbc.M111.316760. [DOI] [PMC free article] [PubMed] [Google Scholar]
- 37.Jucker BM, Rennings AJ, Cline GW, Petersen KF, Shulman GI. In vivo NMR investigation of intramuscular glucose metabolism in conscious rats. The American journal of physiology. 1997;273:E139–148. doi: 10.1152/ajpendo.1997.273.1.E139. [DOI] [PubMed] [Google Scholar]
- 38.Hosokawa Y, Shimomura Y, Harris RA, Ozawa T. Determination of short-chain acyl-coenzyme A esters by high-performance liquid chromatography. Analytical biochemistry. 1986;153:45–49. doi: 10.1016/0003-2697(86)90058-8. [DOI] [PubMed] [Google Scholar]
- 39.Roughan G. A semi-preparative enzymic synthesis of malonyl-CoA from [14C]acetate and 14CO2: labelling in the 1, 2 or 3 position. The Biochemical journal. 1994;300 (Pt 2):355–358. doi: 10.1042/bj3000355. [DOI] [PMC free article] [PubMed] [Google Scholar]
- 40.Kumashiro N, et al. Role of patatin-like phospholipase domain-containing 3 on lipid-induced hepatic steatosis and insulin resistance in rats. Hepatology. 2013;57:1763–1772. doi: 10.1002/hep.26170. [DOI] [PMC free article] [PubMed] [Google Scholar]
Associated Data
This section collects any data citations, data availability statements, or supplementary materials included in this article.


