

Abstract
Whole genome bisulfite sequencing (WGBS) allows genome-wide DNA methylation profiling but the associated high sequencing costs continue to limit its widespread application. We utilized several high coverage reference data sets to experimentally determine minimal sequencing requirements. Here, we present data derived recommendations for minimum sequencing depth for WGBS libraries, highlight what is gained with increasing coverage and discuss the trade off between sequencing depth and number of assayed replicates.
DNA methylation is essential for normal development1 and uniquely distributed in all cell types2-4. Whole genome bisulfite sequencing allows unbiased genome-wide DNA methylation profiling but currently little guidance exists with regards to the minimal required coverage and other parameters that drive the sensitivity, specificity and costs of this assay. The NIH Roadmap Epigenomics Project currently recommends the use of two replicates with a combined total coverage of 30× (http://www.roadmapepigenomics.org/protocols). This requires approximately 800 million aligned, high quality reads (101bp paired-end) for human samples and therefore remains cost prohibitive for larger scale studies. Here, we provide data driven guidance based on comprehensive simulation experiments using representative high quality WGBS datasets generated for the NIH Roadmap Epigenomics Project. Specifically, we present a detailed analysis of the recommended minimum sequencing depth for a WGBS library, highlight what is gained with increasing coverage and discuss the trade off between sequencing depth and number of assayed replicates. We focus our analysis on the discovery of differentially methylated regions (DMRs). The findings can inform decisions on the context-specific optimal experimental design strategy for methylation profiling experiments5.
We explored three experimental scenarios: ranging from a comparison of closely related sample types represented by purified CD4 vs. CD8 T-cells4, to a more divergent endodermal cell type comparison represented by embryonic stem cell (ESC) derived CD184 positive cells vs. primary adult liver tissue, and finally unrelated brain cortex tissue vs. undifferentiated ESCs 6 (Fig. 1a). We used a high coverage level of 30×7 per sample paired with regional or single-CpG based analysis paradigms to define a set of gold standard methylation differences. These reference DMRs (refDMRs) were identified using BSmooth8, an algorithm that utilizes a smoothing approach to identify regional differences, and MOABS, a Beta-Binomial hierarchical model9 approach that analyses each CpG individually followed by grouping neighboring differentially methylated cytosines into DMR blocks. As expected, the divergent sample comparisons yield larger methylation differences (median difference within brain cortex and hESC DMRs = 37.9%; median difference within liver and CD184 DMRs = 39.7%) than the comparison between the closely related cell types (median difference within CD4 and CD8 T DMRs = 21.5%) (Fig. 1b). Using these reference differential methylation sets as benchmarks, we then used downsampling analysis to ask to what extent our findings would differ had we performed lower coverage sequencing10, 11.
Figure 1. Coverage requirements for WGBS experiments.
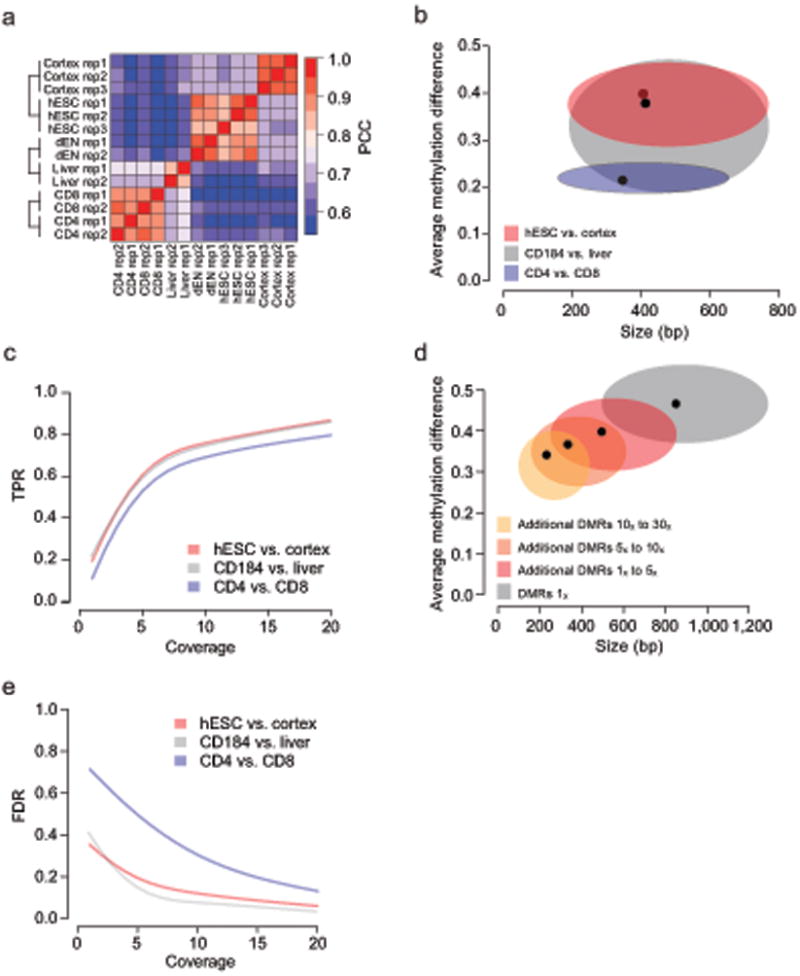
- Heatmap showing the pairwise Pearson correlation coefficients (PCC) for genome-wide methylation profiles of the samples used in this study (n=14). Average methylation levels were estimated in 1kb tiling windows.
- Distribution of DMR sizes (x-axis) and average methylation difference (y-axis) for DMRs found at 30× comparing hESCs to human cortex (red), CD184 to liver (grey) and CD4 to CD8 (blue) using 2 replicates each. Black dot indicates median and ellipsoids span from the 25th to the 75th percentile in each dimension.
- True positive rate (TPR, y-axis) as a function of coverage (x-axis) for hESC vs. cortex (red), CD184 vs. liver (grey) and CD4 vs. CD8 (blue) using 2 replicates for each group. True positive rate is defined as the fraction of high coverage (30×) reference DMRs recovered at the coverage level indicated. Grey box indicates coverage range where change in TPR exhibits the largest drop.
- Distribution of DMR sizes (x-axis) and average methylation difference (y-axis) for DMRs discovered at 1× (grey) and additional DMRs discovered when increasing the coverage from 1× to 5× (dark red), 5× to 10× (light red) and 10× to 30× (orange) in the hESCs vs. human cortex comparison using 2 replicates each. Black dots indicate median and ellipsoids span from the 25th to the 75th percentile in each dimension.
- False discovery rate (FDR, y-axis) as function of coverage (x-axis) for DMRs exhibiting a methylation difference of 20% or greater when comparing hESCs to human cortex (red), CD184 to liver (grey) or CD4 to CD8 (blue) using two replicates for each group.
Using the brain cortex vs. hESC comparison with two biological replicates per group, we observed an initial sharp rise in the fraction of recovered refDMRs as we increased coverage from 1×. The gains in the true positive rate (TPR) fall off rapidly between 8× and 10×, followed by diminished returns at higher coverage levels (Fig. 1c, Supplementary Fig. 1a). Given the large average differences in methylation levels within DMRs for the brain cortex vs. hESC comparison (Fig.1b), it is not surprising that applying a filter for minimum methylation difference in the range of 10% to 40% has little impact on overall sensitivity (Supplementary Fig. 1b). To investigate the impact of methylation difference magnitude in greater detail we utilized two closely related T cell types (CD4 and CD8) that exhibit considerably smaller between-group methylation differences (Fig. 1b). Interestingly, this results in a sensitivity curve exhibiting a similar steep reduction in TPR gains above 10× (Fig. 1c, Supplementary Fig. 1a). As expected, DMRs with greater methylation difference, size and more CpGs can be detected with improved power (Fig. 1d, Supplementary Fig. 1c). This observation is particularly relevant in the context of closely related sample types where the magnitude of the methylation differences of interest can be used to dictate sequencing depth. For example, our analysis suggests that to obtain a target TPR greater than 50%, one may apply a 20% minimum difference threshold at 5× coverage and a 10% threshold at 10× (Supplementary Fig. 1b). We also note that, while altering the minimum methylation threshold affects sensitivity, it has little impact on the coverage level of the sensitivity curve elbow. In addition, we also evaluated a single CpG based DMR detection method9. As expected, this approach has higher coverage requirements to achieve a similar TPR (Supplementary Fig. 1d,e), while at the same time providing single CpG resolution.
We observed that the number of CpGs covered by at least one read drops rapidly from 90% to 50% as coverage is reduced from 5× to 1× (Supplementary Fig. 1f-h). This uneven coverage directly contributes to a dramatic loss in sensitivity in poorly covered regions. Short DMRs with few CpGs are most susceptible to being missed as coverage decreases below 5× (Fig 1d, Supplementary Fig. 1c).
In order to examine the sensitivity of our results with respect to the stringency with which the refDMR set is defined, we used a permutation test12 to compute the family wise error rate (FWER) for all DMRs in the hESC vs. brain comparison (see Methods). Based on this statistic, we defined a very high stringency refDMR subset, accepting a high false negative rate, and confirmed that shape of the sensitivity vs. coverage curve remains unchanged (Supplementary Fig. 1i).
We investigated the impact of coverage onDMR discovery specificity and found, as expected, that the false discovery rates (FDR) in the comparison between the closely related T cell types are considerably higher than in the comparison between the brain and hESC samples (Fig 1e, Supplementary Fig. 1j, k). Similarly to the effect of coverage on the true positive rate, the greatest rate of FDR improvement occurs at less than 10× coverage for both the divergent and closely related scenarios (Fig. 1e). However, to satisfy a moderately stringent FDR threshold of 20% in our system, we recommend the use of a higher 15× coverage level for closely related cell types (Fig. 1e).
We next investigated the impact of the number of biological replicate samples on DMR discovery by selecting subsets of hESC and cortex samples to create single, two and three replicate datasets. The relationship between DMR recovery rate and per-sample coverage follows a similar pattern regardless of the number of replicate samples analyzed, with an initial sharp increase in the proportion of DMRs recovered up to an ‘elbow’ point, followed by more modest subsequent gains (Fig 2a, Supplementary Fig. 2a). While sensitivity increased with each additional replicate added, the diminishing returns point remained stable in each case between 5× and 10×. We found that decreasing from three to two samples per group resulted in a modest drop in sensitivity from 77% to 72% at 10× coverage. An experiment with a single replicate per group, however, only achieved 50% sensitivity at the same coverage level. Importantly, increasing coverage of the single replicate had limited benefit resulting in only 60% sensitivity and 18% specificity even when the single replicate was deeply sequenced to 30× (Fig. 2b, Supplementary Fig. 2b). In contrast, a single CpG based DMR detection method continued to benefit in a more linear fashion from increased per replicate coverage (Supplementary Fig. 2c).
Figure 2. Replicate recommendations.
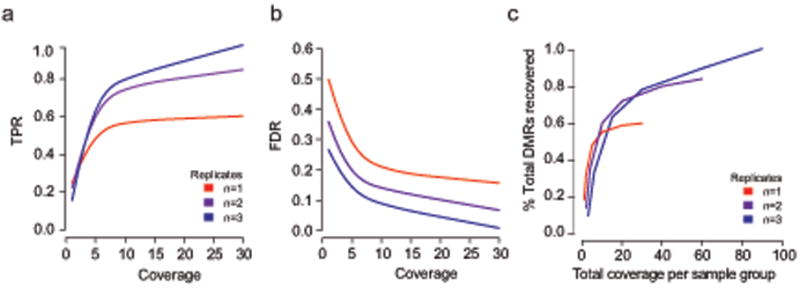
- True positive rate (TPR, y-axis) as a function of coverage (x-axis) comparing hESCs to human cortex using 1, 2 or 3 replicates per group for DMRs with a methylation difference greater than 20%.
- False discovery rate (FDR, y-axis) as a function of coverage (x-axis) comparing hESCs to human cortex using 1, 2 or 3 replicates per group for DMRs with a methylation difference greater than 20%.
- Percentage of 3 replicate based, reference DMRs with a methylation difference greater than 20% that are recovered as a function of total coverage used for the entire experiment. Lines indicate whether total experimental coverage is distributed across 1, 2 or 3 replicates
Finally, we sought to directly address the question of how to balance the number of replicates with the sequencing coverage per replicate. To answer this question we performed in silico experiments keeping the total sequencing effort across the experiment constant while trading an increase in number of biological replicates for decreased coverage per sample. We express total sequencing effort across the experiment in terms of single-genome coverage, where 10× total coverage corresponds to 27 gigabases (Gb) of sequence. We evaluated six scenarios ranging from 10× to 90× (equivalent to 27Gb to 243Gb), and evaluated sensitivity as a function of number of biological replicates (Fig 2c). We identified the number of samples and the corresponding coverage per sample that maximized sensitivity for each scenario (Fig. 2c). Notably, sensitivity was maximized by keeping the target coverage per sample fairly constant between 5× and 10×, regardless of the total sequencing effort. At a low total sequencing effort of 10×, sensitivity is optimized by dedicating this effort towards covering a single replicate per group at 5×. In contrast, with higher total sequencing resources available we found minimal benefit in sequencing deeper than 10× per sample, and rather obtained improved sensitivity most efficiently by increasing the number of replicates per group.
Conclusions
Our results highlight the minimum sequencing depth required to obtain satisfactory sensitivity and specificity in DMR discovery using WGBS in experimental settings with a limited (<=3) number of replicate samples. Importantly, we highlight the tradeoff between the two main choices for increasing power: adding additional biological replicates or adding additional persample coverage. For DMR identification using the sample types analyzed in this study, we recommend per sample coverage in the range of 5× to 15×, depending on the magnitude of methylation differences between the groups and whether a smoothing or single CpG based DMR identification strategy is used. Sequencing at levels higher than this range leads to wasted resources that would be better spent on an increased number of biological replicates. If the goal however, is primarily to identify long DMRs with large methylation differences, we find that reducing coverage down to 1× or 2× per sample is acceptable (Supplementary Fig. 1c). Our findings emphasize that biological replicates should be analyzed separately to increase power, as opposed to being pooled together for analysis. In addition, the findings strongly argue for the use of at least two separate biological replicates for DMR analysis (Supplementary Fig. 2d). Although we provide guidance based on the best currently available sample set, we caution that choosing an appropriate number of biological replicates is a complex issue influenced by the degree of within group heterogeneity, the magnitude of between-group differences, and the presence of confounding factors such as batch effects.
Methods
Analysis was performed using Python (www.python.org), R/Bioconductor13 and Snakemake14. The analysis code is available at http://aryee.mgh.harvard.edu/publications/bsdepth.
Datasets
The hESC group was composed of two biological replicates of HUES64 taken from GSE46130, GSE46644and one replicate of hESC line H9 from [GEO ID PENDING]. The HUES64 samples were collected at different passages almost one year apart. The H9 sample has a different genetic background. The cortex samples are primary tissue and were collected from different individuals of similar age (>80) and were obtained from GSE46644.The CD4 and CD8 primary samples were FACS-sorted from blood of two different human donors. The CD4, CD8, liver and human cortex data were obtained from GSE46644 and are part of the epigenome roadmap project and are available through the epigenome roadmap data portal (http://www.roadmapepigenomics.org/). The in vitro derived endoderm samples (CD184) were also published as part of the epigenome roadmap and are available in GEO under GSE46130. All libraries were sequenced with at least 800 million paired-end 100bp reads. All sex chromosomes were excluded from the analysis.
QC and read alignment
WGBS libraries were aligned using BSMap to the hg19/GRCh37 reference assembly15 and quality controlled for bisulfite conversion rate. All samples had bisulfite conversion rate greater than 97%.
Downsampled datasets
Each was downsampled by randomly selecting reads from the original aligned BAM files to create simulated samples with 1×, 2×, 5, 10×, 20× and 30× coverage. The number of 100bp reads needed to achieve these coverage levels was calculated as: [target coverage] × 2.7e9 bp / 100bp. Target coverage was defined as the total coverage across both DNA strands. For each subsampled dataset we exclusively selected reads from the corresponding high coverage dataset to create lower coverage versions of each dataset while maintaining the biological replicate information at each coverage level.
Identifying differentially methylated regions
Regional smoothing analysis
DMRs were identified using the BSmooth algorithm8. For the twoand three-replicate experiments we calculated a differential methylation t-statistic for each CpG covered by at least 1 read in each sample. These t-statistics were then smoothed across neighboring CpGs and regions with the largest smoothed values (top 1% for cortex vs. hESC and liver vs dEN, top 0.1% for CD4 vs CD8) identified as candidate DMRs. In the case of singlereplicate experiments, we substituted the methylation difference at each CpG for the t-statistic. We used a permutation approach to identify a stringently defined subset of gold-standard reference DMRs, where we accept a high false-negative rate with the goal of achieving a low false positive rate. Permutation tests were used as recently described12. The output of the permutation test is an estimated family-wise error rate (FWER), which is corrected for multiple testing. We included only DMRs with an FWER of 0 in the stringent reference set, representing those DMRs where no putative DMR in any of the permutations is larger with a bigger methylation difference. In addition, we required a minimal methylation difference on the DMR level of 0.1 between conditions.
Single-CpG analysis
We utilized the mcomp function in the MOABS9 framework with the following parameters settings -d 1 --doComp=1 --doDmcScan=1 --doDmrScan=1 --minDmcsInDmr=1. All other parameters were left at their default values. This procedure first identified differentially methylated cytosines (DMCs) followed by merging DMCs into DMRs. We required DMRs to harbor at least one DMC. We used the results of the algorithm described as #2 in Sun et al9. (Beta-Binomial hierarchical model) to determine DMRs.
Sensitivity
Sensitivity (true positive rate, TPR) was calculated as the number of refDMRs that overlapped the downsampled DMR set by at least 1bp. refDMRs were defined as DMRs present in the high coverage (30×) dataset using two replicates in each group, with the exception of Figure 2 and Supplementary Fig. 1e where three replicates were used for the hESC and cortex comparison. Sensitivity was measured at 1×, 2×, 5×, 20× and 30× and then smoothed for plotting purposes using the cubic spline fitting algorithm implemented in the R function smooth.spline in the stats package.
Specificity
In order to assess the impact of sequencing coverage on the rate of false positive DMR discovery we estimated false discovery rates (FDR) for the downsampled datasets. Under the assumption that DMRs discoverable at low coverage will not become undetectable as coverage increases, we calculated FDR as the fraction of DMRs discovered in the low coverage datasets that were not overlapping with DMRs present in the high-coverage dataset. Specificity was measured at 1×, 2×, 5×, 20× and 30× and then smoothed for plotting purposes using the cubic spline fitting algorithm implemented in the R function smooth.spline in the stats package.
Replicate analysis
To assess the impact of number of replicates on DMR discovery we identified brain cortex tissue vs. undifferentiated ESC DMRs using subsets of the 6 samples used for the reference DMR set. At each coverage level we generated DMRs from each of the nine possible 1 vs. 1 replicate pairings, and each of the nine possible 2 vs 2 replicate pairings. We calculated the average true and false positive rates across the permutations.
Supplementary Material
Acknowledgments
This work was supported by the NIH Common Fund (U01ES017155), NIGMS (P01GM099117), the New York Stem Cell Foundation. A.M. is a New York Stem Cell Foundation Robertson Investigator.
Footnotes
Data accession codes: hESC: GSE46130, GSE46644, GEO ID PENDING.
CD4 T-cells, CD8 T-cells, liver and cortex: GSE46644 (available through the epigenome roadmap data portal (http://www.roadmapepigenomics.org/).
in-vitro derived endoderm CD184: GSE46130 (available through the epigenome roadmap data portal (http://www.roadmapepigenomics.org/)
Author Contributions: M.J.A and A.M. conceived the study. M.Z, M.J.A and K.D.H. performed analysis and interpreted results. M.Z., M.J.A., K.D.H. and A.M. wrote the paper.
References
- 1.Okano M, Bell DW, Haber DA, Li E. DNA methyltransferases Dnmt3a and Dnmt3b are essential for de novo methylation and mammalian development. Cell. 1999;99:247–257. doi: 10.1016/s0092-8674(00)81656-6. [DOI] [PubMed] [Google Scholar]
- 2.Bird A. DNA methylation patterns and epigenetic memory. Genes Dev. 2002;16:6–21. doi: 10.1101/gad.947102. [DOI] [PubMed] [Google Scholar]
- 3.Reik W. Stability and flexibility of epigenetic gene regulation in mammalian development. Nature. 2007;447:425–432. doi: 10.1038/nature05918. [DOI] [PubMed] [Google Scholar]
- 4.Ziller MJ, et al. Charting a dynamic DNA methylation landscape of the human genome. Nature. 2013;500:477–481. doi: 10.1038/nature12433. [DOI] [PMC free article] [PubMed] [Google Scholar]
- 5.Mehta T, Tanik M, Allison DB. Towards sound epistemological foundations of statistical methods for high-dimensional biology. Nat Genet. 2004;36:943–947. doi: 10.1038/ng1422. [DOI] [PubMed] [Google Scholar]
- 6.Gifford CA, et al. Transcriptional and epigenetic dynamics during specification of human embryonic stem cells. Cell. 2013;153:1149–1163. doi: 10.1016/j.cell.2013.04.037. [DOI] [PMC free article] [PubMed] [Google Scholar]
- 7.Epigenome Roadmap Consortium. 2011;2013 [Google Scholar]
- 8.Hansen KD, Langmead B, Irizarry RA. BSmooth: from whole genome bisulfite sequencing reads to differentially methylated regions. Genome Biol. 2012;13:R83. doi: 10.1186/gb-2012-13-10-r83. [DOI] [PMC free article] [PubMed] [Google Scholar]
- 9.Sun D, et al. MOABS: model based analysis of bisulfite sequencing data. Genome Biol. 2014;15:R38. doi: 10.1186/gb-2014-15-2-r38. [DOI] [PMC free article] [PubMed] [Google Scholar]
- 10.Meynert AM, Bicknell LS, Hurles ME, Jackson AP, Taylor MS. Quantifying single nucleotide variant detection sensitivity in exome sequencing. BMC Bioinformatics. 2013;14:195. doi: 10.1186/1471-2105-14-195. [DOI] [PMC free article] [PubMed] [Google Scholar]
- 11.Tarazona S, Garcia-Alcalde F, Dopazo J, Ferrer A, Conesa A. Differential expression in RNA-seq: a matter of depth. Genome Res. 2011;21:2213–2223. doi: 10.1101/gr.124321.111. [DOI] [PMC free article] [PubMed] [Google Scholar]
- 12.Hansen KD, et al. Large-scale hypomethylated blocks associated with Epstein-Barr virus-induced B-cell immortalization. Genome Res. 2013 doi: 10.1101/gr.157743.113. [DOI] [PMC free article] [PubMed] [Google Scholar]
- 13.Gentleman RC, et al. Bioconductor: open software development for computational biology and bioinformatics. Genome Biol. 2004;5:R80. doi: 10.1186/gb-2004-5-10-r80. [DOI] [PMC free article] [PubMed] [Google Scholar]
- 14.Koster J, Rahmann S. Snakemake--a scalable bioinformatics workflow engine. Bioinformatics. 2012;28:2520–2522. doi: 10.1093/bioinformatics/bts480. [DOI] [PubMed] [Google Scholar]
- 15.Xi Y, Li W. BSMAP: whole genome bisulfite sequence MAPping program. BMC Bioinformatics. 2009;10:232. doi: 10.1186/1471-2105-10-232. [DOI] [PMC free article] [PubMed] [Google Scholar]
Associated Data
This section collects any data citations, data availability statements, or supplementary materials included in this article.