Abstract
The molecular basis of the interaction of KpnI restriction endonuclease (REase) and the corresponding methyltransferase (MTase) at their cognate recognition sequence is investigated using a range of footprinting techniques. DNase I protection analysis with the REase reveals the protection of a 14–18 bp region encompassing the hexanucleotide recognition sequence. The MTase, in contrast, protects a larger region. KpnI REase contacts two adjacent guanine residues and the single adenine residue in both the strands within the recognition sequence 5′-GGTACC-3′, inferred by dimethylsulfate (DMS) protection, interference and missing nucleotide interference analysis. In contrast, KpnI MTase does not show elaborate base-specific contacts. Ethylation interference analysis also showed the differential interaction of REase and MTase with phosphate groups of three adjacent bases on both strands within the recognition sequence. The single thymine residue within the sequence is hyper- reactive to the permanganate oxidation, consistent with MTase-induced base flipping. The REase on the other hand does not show any major DNA distortion. The results demonstrate that the differences in the molecular interaction pattern of the two proteins at the same recognition sequence reflect the contrasting chemistry of DNA cleavage and methylation catalyzed by these two dissimilar enzymes, working in combination as constituents of a cellular defense strategy.
INTRODUCTION
Restriction and modification (R–M) systems serve as primary cellular defense strategies against incoming DNA. Based on the complexity of structure, organization and reaction mechanisms, they have been broadly classified into three groups. Amongst the major classes, type I and type III R–M systems function as multiprotein complexes encompassing both a restriction endonuclease (REase) and a methyltransferase (MTase) (1). In contrast to type I and type III R–M systems, the components of type II systems function independently of each other (2). Type II R–M systems are composed of two proteins: an REase that cleaves DNA with a very high specificity, and a DNA MTase that methylates one of the bases within the recognition sequence. Together, they constitute an interesting class of enzymes for studying the protein–DNA interactions as they catalyze totally different enzymatic reactions in spite of binding to the same sequence. Most of the enzymes characterized from a wide variety of bacteria recognize double-stranded DNA sequences that contain a dyad axis of symmetry (3). Type II REases generally recognize the unmethylated DNA as homodimers (4). In contrast, the corresponding MTases usually recognize their cognate sequences as monomers, with hemimethylated DNA as the preferred substrate (5). Further, the proteins exhibit large differences in their tertiary structures. Even though both the enzymes interact with the same stretch of DNA sequence, the analyses of primary structures of REases and MTases revealed no obvious sequence similarity (6).
More than 3000 R–M systems have been identified, representing one of the largest groups of functionally related enzymes, which interact with DNA in a site-specific manner (7). In addition to the application of REases and, to a certain extent, MTases as tools in the laboratory, R–M systems have been studied with respect to the gene organization, evolution, regulation of their expression, kinetics of the reaction, reaction mechanism and other biochemical properties. The KpnI R–M system belonging to type IIP REases recognizes the double-stranded palindromic sequence (8). KpnI REase catalyzes the hydrolysis of the phosphodiester bond between two cytosines within the sequence GGTACC, leaving a 3′ overhang of four bases, while the cognate MTase transfers a methyl group from the cofactor, AdoMet, onto the N6-position of a single adenine on both strands within the same sequence (9). Comparison of amino acid sequences with other MTases revealed that KpnI MTase shows a high degree of similarity to the several N6-adenine MTases. Intriguingly, KpnI MTase is closely related (46–48% similarity) to EcoP1 and Ecop15I MTase, which belong to type III R–M systems (10).
Direct comparison of DNA recognition patterns of the R–M components would reveal important differences in DNA determinants upon enzyme binding. Elucidation of base-specific and phosphate backbone contacts at the target site by the enzyme during the site-specific interactions is an important step towards understanding the basis of sequence-specific DNA recognition. In this direction, a battery of footprinting techniques were employed to assess in parallel the interaction of KpnI REase and MTase at the same recognition sequence. These comparative studies revealed contrasting DNA recognition patterns for the two enzymes.
MATERIALS AND METHODS
Enzymes
KpnI REase and MTase were purified from the over-expressing cells as described previously (11). The enzymes were diluted to a suitable concentration in binding buffer (20 mM Tris–HCl pH 7.4, 25 mM NaCl and 5 mM β-mercaptoethanol) for binding and footprinting studies.
Oligonucleotide substrates
A 38mer double-stranded oligonucleotide containing the KpnI recognition sequence (5′-GAGAGGCGGTTTGCGTGGTACCCGCTCTTCCGCTTCCT-3′) was used for all binding reactions. A 38mer double-stranded oligonucleotide that does not contain the KpnI site (5′-GAGAGGCGGTTTGCGTATTGGGCGCTCTTCCGCTTCCT-3′) was used as the non-specific DNA substrate. The oligonucleotides were 5′ end labeled using T4 polynucleotide kinase and [γ-32P]ATP (6000 Ci/mmol) and purified using G-50 spin column chromatography. For surface plasmon resonance (SPR) studies, two oligonucleotides, 5′-X TGGGAAGCGGGTACCTGAATTCTT-3′ and 5′-X GAT CGA TTA TGC CCC AAT AAC CAC-3′ (where X represents biotin label at 5′ end), were used as specific and non-specific substrates, respectively. Duplex oligonucleotides were prepared by adding unlabeled complementary oligonucleotide to the labeled oligonucleotide and incubating at 80°C for 2 min, followed by slow cooling to room temperature.
Electrophoretic mobility shift assay (EMSA)
The labeled duplex oligonucleotide containing the KpnI site was incubated with KpnI REase (200 nM) in binding buffer (20 mM Tris–HCl pH 7.4, 25 mM NaCl and 5 mM β-mercaptoethanol) for 15 min on ice. The free DNA and enzyme-bound complexes were separated on an 8% native polyacrylamide gel (30:0.8) using 1× TBE as running buffer, and autoradiographed.
Surface plasmon resonance studies
The binding kinetics of KpnI REase and MTase with DNA were determined by SPR spectroscopy using the BIACore2000 optical biosensor (Amersham-Pharmacia Biotech, Uppsala, Sweden). The 5′-biotinylated oligonucleotides were immobilized on a streptavidin-coated SA chip (Amersham-Pharmacia Biotech) as per the manufacturer’s recommendations. The binding reactions were carried out in a continuous flow of the buffer containing 10 mM HEPES pH 7.4, 25 mM NaCl, 1 mM EDTA and 0.05% surfactant P-20. The surface was regenerated by passing 5 µl of 0.05% SDS followed by 10 µl of 1 M NaCl for further binding reactions. One of the four surfaces not having the biotinylated oligonucleotide was used as a negative control for the experiment. The binding data were analyzed using a 1:1 Langmuir binding model in BIAcore evaluation software version 3.0.
Glutaraldehyde cross-linking
Purified KpnI REase (2 µg each) was incubated with different concentrations of glutaraldehyde (0.003–0.05%) in a buffer containing 10 mM Tris–HCl pH 7.4, 0.1 mM EDTA, 5 mM β-mercaptoethanol and 50 mM KCl at 25°C for 30 min. The reaction was terminated by the addition of SDS sample buffer and the samples were analyzed by 8% SDS–PAGE followed by silver staining.
Gel filtration chromatography
KpnI REase was applied to a Superdex-200 column (10X30 HR Amersham Pharmacia Biotech, UK) equilibrated with buffer containing 10 mM Tris–HCl pH 7.4, 0.1 mM EDTA, 5 mM β-mercaptoethanol, 50 mM KCl and 5% glycerol. The elution was carried out in the same buffer at a flow rate of 0.2 ml/min using an Akta FPLC system (Amersham Pharmacia Biotech, UK) and the fractions were subjected to SDS–PAGE analysis followed by silver staining. The peak fractions were assayed for REase activity. The molecular masses of the native proteins were estimated by calibrating the column using thyroglobulin (669 kDa), ferritin (440 kDa), catalase (232 kDa), bovine serum albumin (66 kDa), ovalbumin (45 kDa) and cytochrome c (12.3 kDa) as standards.
DNase I footprinting
Oligonucleotides (50 fmol) were incubated with different concentrations of KpnI REase or MTase for 20 min on ice in binding buffer containing 10 mM Tris–HCl pH 7.4, 0.1 mM EDTA and 5 mM β-mercaptoethanol. The enzyme–DNA complex was treated with DNase I in a buffer containing 20 mM Tris–HCl pH 7.4, 1 mM Mg2+ and 1 mM Ca2+ to a final concentration of 1 µg/ml for 40 s at room temperature. The reaction was stopped with DNase I stop buffer (50 mM Tris–HCl pH 7.4 and 10 mM EDTA). The samples were analyzed on a 15% urea–acrylamide gel and autoradiographed.
DMS protection and interference
End-labeled double-stranded oligonucleotides (0.5 pmol) were incubated with 300 nM of KpnI REase, the enzyme–DNA complex was treated with 1% DMS for 40 s at room temperature and the reaction was terminated by the addition of 1 M β-mercaptoethanol. The sample was precipitated in the presence of 2 µl of glycogen (10 mg/ml). The DNA was dissolved in 90 µl of water, and 10 µl of piperidine was added. The samples were incubated at 90°C for 10 min, vacuum-dried and resuspended in 8 µl of formamide. The cleaved products were analyzed on a 15% denaturing polyacrylamide gel at 1500 V for 1 h followed by autoradiography. For the interference assay, the labeled DNA was methylated using 1% DMS reagent in a 200 µl reaction volume for 50 s at room temperature and the reaction was stopped by addition of 1 M β-mercaptoethanol followed by precipitation in the presence of glycogen. The modified DNA was then incubated with 250 nM KpnI REase for 20 min on ice. The bound and free DNA were separated on an 8% native polyacrylamide gel. After separation, the DNAs corresponding to the free and bound fractions were eluted. The DNA samples were analyzed after piperidine cleavage as described (12). The DMS protection analysis was carried using KpnI MTase as described above.
KMnO4 footprinting analysis
Double-stranded oligonucleotide (100 fmol) was incubated with different concentrations of KpnI REase or MTase (5, 25 and 50 nM REase; 10, 20 and 50 nM MTase) in the binding buffer in a 50 µl reaction volume for 20 min on ice. To the binding mixture, 2 µl of 50 mM KMnO4 was added and incubated for 1 min, and the reaction was stopped with 2 µl of 14 M β-mercaptoethanol. The DNA was precipitated with 5 µl of 3 M sodium acetate, 2 µl of glycogen and 180 µl of ethanol, washed with 70% ethanol and dried. The DNA samples were cleaved with piperidine, dried extensively to remove piperidine and the samples were analyzed on a 15% urea–acrylamide gel.
Depurination experiment
Oligonucleotides (400 fmol) were incubated with 1.5 µl of 1 M formic acid in a 15 µl reaction volume. The reaction mixture was incubated at 37°C for 20 min. The sample was precipitated as before and annealed with a 4-fold excess of non-radioactive complementary strand in binding buffer in a 40 µl reaction volume. The annealed DNA was incubated with 300 nM REase or 500 nM MTase on ice for 20 min. The bound and free DNA were purified from a 8% native acrylamide gel. The DNA was eluted from the gel with 1× TE and extracted with an equal volume of phenol and chloroform, and finally precipitated with an equal volume of isopropanol in the presence of glycogen. The purified DNA was treated with piperidine and processed as described.
Ethylation interference assay
Phosphate interference analysis was carried out as described previously (13). A 400 fmol concentration (200 000 c.p.m.) of DNA was incubated in a 100 µl reaction volume containing 50 mM sodium cacodylate (pH 7.0) and 100 µl of freshly prepared saturated solution of ethylnitrosourea in ethanol. The reaction mixture was incubated at 50°C for 30 min and processed as described earlier (12).
RESULTS
DNA binding property of KpnI REase
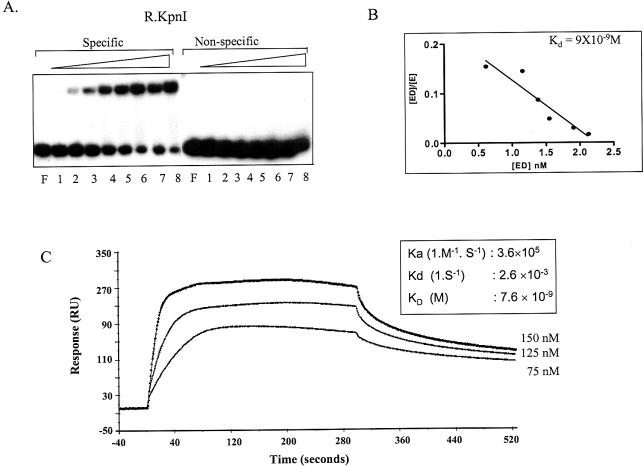
The EMSAs were carried out to analyze the binding of KpnI REase using double-stranded oligonucleotides containing either the cognate site or the non-specific sequences. A distinct enzyme–DNA complex was observed, with the DNA having a cognate site (Fig. 1A, lanes 2–8). The affinity constant (KD) determined by Scatchard plot (Fig. 1B) is 9 × 10⁻⁹ M, indicating that KpnI REase binds to DNA with high affinity. The KpnI REase is able to discriminate DNA containing a specific sequence from that containing a non-specific sequence even in the absence of any divalent metal ion. In contrast, the MTase binds to both specific and non-specific oligonucleotides (11). The enzyme binds to specific DNA with high affinity. The KD values determined by SPR spectroscopy for specific versus non-specific DNA sequences were significantly different (see Supplementary Material available at NAR Online). The KD value was found to be 6.57 × 10⁻⁸ M for specific oligonucleotide (10,14) and 1.4 × 10⁻⁷ M for non-specific oligonucleotide (see Supplementary Material). SPR spectroscopy was also used to determine the kinetics of DNA binding by KpnI REase. The association and dissociation of the proteins and DNA were monitored by changes in the resonance due to the change in mass on the sensor surface. The kinetic constants were determined by subjecting the sensorgrams of association and dissociation phases to global analysis using BIAevaluation software 3.0. The global fitting analyzes both association and dissociation data for all concentrations simultaneously using a 1:1 Langmuir binding model (Fig. 1C). The results demonstrate that KpnI REase binds to DNA with high affinity (KD 7.4 × 10⁻⁹ M). The KD values are comparable with those obtained from the EMSA.
Figure 1.
KpnI REase DNA binding. (A) Electrophoretic mobility shift assay. Labeled specific and non-specific 38mer oligonucleotides were used for the binding assay. KpnI REase: 10 nM of labeled oligonuclotides were incubated with 0.05, 0.25, 1.25, 6.5, 32, 64, 125 and 250 nM (lanes 1–8) of KpnI REase. Lane F indicates free DNA. (B) Scatchard analysis of KpnI REase DNA binding data from (A). (C) SPR analysis of the interaction of KpnI REase at its recognition sequence. The different concentrations of KpnI REase ranging from 75 to 150 nM were injected for 300 s over the SA chip immobilized with biotinylated oligonucleotide at a flow rate of 10 µl/min followed by a dissociation phase (300 s). The kinetic parameters are given in the table (inset).
DNase I footprinting
DNase I footprinting is widely used amongst various footprinting methods due to the mild reaction conditions which do not affect the protein binding (15). The duplex oligonucleotides containing the cognate sequence with either the top or the bottom strand labeled were used as substrates for individual interactions of REase or MTase. The REase protects ∼18 nt on both strands of the double helix encompassing the recognition sequence (see Supplementary Material). Similar analyses with MTase revealed that the bound enzyme protects the entire 38mer DNA from DNase I cleavage (see Supplementary Material). Footprinting studies with non-specific DNA did not show any protection (not shown). However, in vivo footprinting using a plasmid having a single KpnI site revealed a 28 bp protection pattern (16).
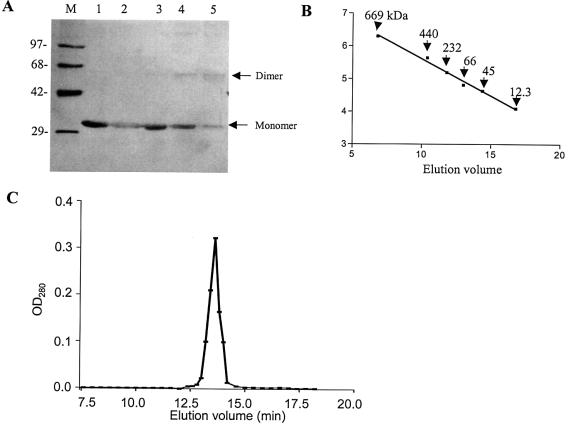
Most type II REases function as homodimers recognizing unmethylated symmetric DNA sequences and catalyzing simultaneous cleavage of phosphodiester bonds in both strands of DNA. MTases, on the other hand, usually act as monomers as their normal substrate is hemimethylated DNA. DNase I probing, which revealed a shorter footprint for REase and a larger protected region for MTase, prompted us to analyze the oligomeric status of the enzymes. The data presented in Figure 2 show that the REase exists as a dimer in solution. The proportion of cross-linked dimer increased with increasing concentration of glutaraldehyde (Fig. 2A, lanes 2–5). Subjecting the KpnI REase to gel filtration analysis further substantiated these observations (Fig. 2B and C). The protein peak corresponding to the maximum REase activity was obtained at 13.6 min elution volume corresponding to the molecular mass of 62.95 kDa (Fig. 2B). Using similar experimental conditions, we have shown that KpnI MTase also exists as a dimer (10,14). The large protection of DNA seen in the case of MTase could be a consequence of its binding as a dimer.
Figure 2.
Subunit structure of KpnI REase. (A) Glutaraldehyde cross-linking. A 2 µg aliquot of the enzyme was incubated with 0, 0.0015, 0.003, 0.006 and 0.0125% glutaraldehyde (lanes 1–5) and the sample was analyzed by SDS–PAGE. Lane M refers to the protein molecular weight markers as indicated. The monomer and dimer positions of the REase are indicated. (B and C) Gel filtration chromatographic profile. The REase was applied onto a Superdex-200 column and analyzed as described in Materials and Methods. The different molecular weight markers were run separately to obtain a calibration curve (B). The fractions were assayed for the presence of REase activity and plotted against elution volume (C).
Base-specific contacts of KpnI REase and Mtase
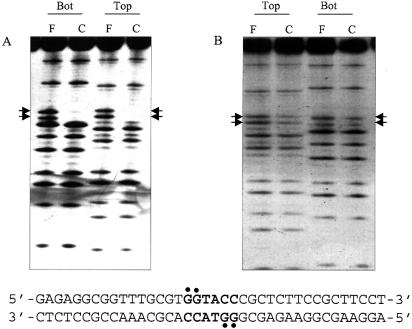
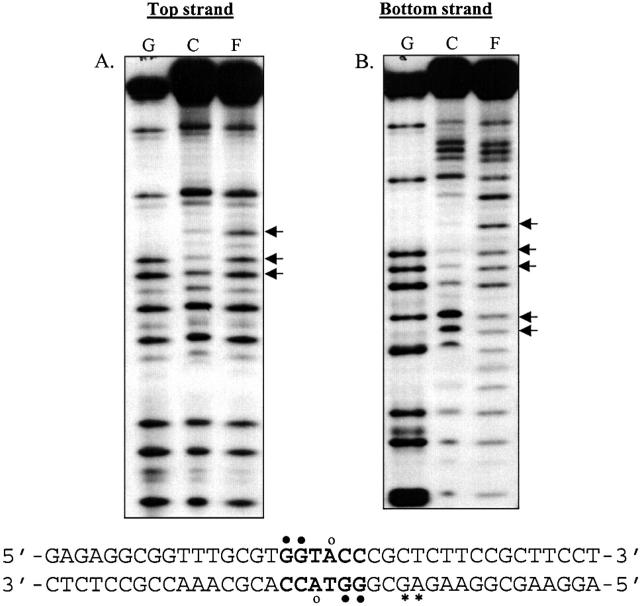
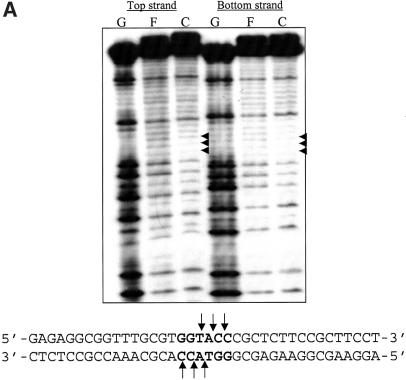
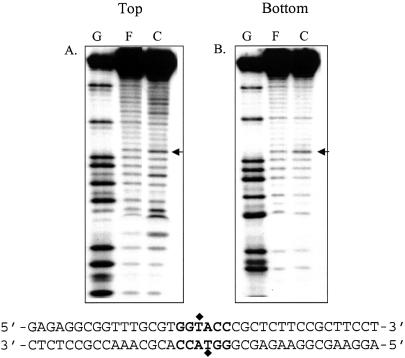
The sequence specificity of binding of proteins to DNA is determined by a number of factors, among which the direct contact with the residues at the major and/or minor groove is of vital importance. This is normally assessed using the alkylating agent DMS which methylates guanine bases at the N7-position in the major groove and adenine bases at the N3-position in the minor groove (17). The base-specific contacts made by KpnI REase were identified by DMS protection, interference (Fig. 3) and missing nucleotide interference (Fig. 4) experiments. Comparative analysis of the methylation of the oligonucleotide in the presence and absence of the protein yields information on the proximity of the functional groups of the protein in the complex. A pre-formed KpnI REase–DNA complex was treated with DMS and the pattern of methylation was compared with that of free DNA (Fig. 3A, lanes C and F, respectively). Figure 3B represents interference analysis where methylated DNA was used for the REase binding, and protein-free DNA (lane F) and DNA–protein complex (lane C) lanes were compared. Both sets of experiments reveal the interaction of two guanine residues on both strands of DNA within the palindromic recognition sequence 5′-GGTACC-3′ with the protein. While these results indicate the close proximity of the N7 guanine functional groups to the REase, it would also imply major groove interaction by the protein since the N7 guanine is a major groove determinant (17). No additional guanines are protected or hyperactive, indicating that the REase mainly interacts at the recognition sequence without distorting the DNA. In contrast, such an analysis carried out with KpnI MTase indicates that the guanine residues on both strands were not contacted (see Supplementary Material). The additional base-specific contacts (if any) were investigated by missing nucleotide interference analyses (18). KpnI REase and MTase were complexed with duplex oligonucleotides and the depurination was carried out with formic acid. In addition to the two guanine residues, a single adenine residue in the recognition sequence is involved in KpnI REase binding to both strands of DNA (Fig. 4). Again in these sets of experiments, base-specific contacts are not seen with KpnI MTase (not shown).
Figure 3.
DMS protection and interference analysis of KpnI REase. The guanine-specific contacts of KpnI REase were obtained by DMS protection (A) and interference analysis (B). Both top strand (Top) and bottom strand (Bot) interactions were probed as described in Materials and Methods. F and C refer to the methylation pattern in the absence and presence of the enzyme, respectively. The guanine contacts in the recognition sequence are indicated and summarized in the nucleotide sequence given below.
Figure 4.
Missing base contact obtained by the depurination reaction. The labeled double-stranded oligonucleotides were modified using formic acid and incubated with 300 nM KpnI REase. The cleavage products were analyzed as described in Materials and Methods. (A) and (B) indicate the depurination reaction using either top or bottom strand-labeled DNA, respectively. F and C refer to the cleavage pattern in the absence and presence of the enzyme, respectively. Lane G refers to the guanine-specific sequencing ladder. The protected purines and the hyper-reactive purines are indicated.
Analysis of protein–phosphate contacts
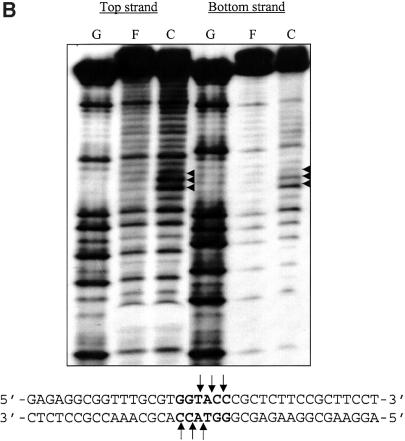
In addition to base-specific interactions, the DNA backbone contacts are known to influence binding as they are important in maintenance of the geometry between protein and DNA (19). Ethylation interference assays were used to identify the phosphate groups that contribute to the KpnI REase and MTase interactions at their recognition sequence. Ethyl nitrosourea preferentially ethylates phosphates in the backbone of the DNA and converts them to phosphotriesters. The end-labeled 38 bp oligonucleotide was partially ethylated and DNA–protein complexes were separated. The eluted complex and free DNA were analyzed by denaturing PAGE after alkali treatment. The footprint patterns depicting the comparison of the distribution of products in free (lane F) and bound (lane C) fractions are shown in Figure 5. The binding of KpnI REase was inhibited when the three phosphates in the recognition sequence GGTpApCpC on both strands of the DNA are ethylated (Fig. 5A). Thus, interaction of these phosphate groups on both strands of the DNA seems to be important in the symmetric recognition of the cognate site by KpnI REase. Similar ethylation assays with the KpnI MTase–DNA complex showed that the phosphate groups located next to the single adenine and two cytosines within the cognate site 5′-GGTApCpCp-3′ were hyperactive (Fig. 5B). The modification of these phosphates within the recognition sequence leads to enhanced cleavage of the DNA strand upon MTase binding. This pattern of phosphate interference is an indication of the reaction mechanism of MTase (see Discussion).
Figure 5.
Phosphate contacts of KpnI REase (A) and MTase (B) upon binding to their recognition sequence as revealed by ethylation interference analysis. The labeled (top or bottom strand) duplex oligonucleotides were modified by addition of saturated ethylnitrosourea. The modified DNA was incubated with KpnI REase (200 nM) and MTase (250 mM). The free and bound fractions were separated by 8% native PAGE and purified. The cleavage products were analyzed by 15% PAGE as described. The modified phosphates within the recognition sequence, which interfere with REase binding to DNA, are indicated. Similarly, modified phosphates, which favored MTase binding, are shown. Lane G = the G ladder; lane F = free DNA; lane C = bound DNA.
Structural distortion in DNA
Ethylation interference studies with MTase indicate that the altered DNA backbone structure influences the interaction of the enzyme with the DNA. The DNA MTases flip their target base out of the DNA helix during catalysis (20). The protein-induced alteration in DNA conformation as a result of base flipping was investigated by KMnO4 footprinting (21). The thymine residue on the top strand within the recognition sequence was hyper-reactive to KMnO4 oxidation, indicating KpnI MTase-induced alteration in the DNA structure (Fig. 6). A similar study using a duplex oligonucleotide lacking the KpnI recognition sequence did not reveal KMnO4-mediated hyper-reactivity in the presence of the MTase (not shown). Similar experiments with KpnI REase did not show any KMnO4-induced hypersensitivity.
Figure 6.
Potassium permanganate footprinting to detect the sensitivity of the thymine base in the recognition sequence to permanganate oxidation upon KpnI MTase binding. The labeled oligonucleotide was incubated with 250 nM MTase and treated with potassium permanganate, and the cleavage products were analyzed as described in Materials and Methods. (A) and (B) refer to 5′ end labeling of the top and bottom strand. F and C indicate the permanganate oxidative cleavage pattern obtained in the presence and absence of MTase, respectively. The arrow indicates the thymine residue within the recognition sequence.
DISCUSSION
The recognition of cognate sites by site-specific DNA-binding proteins is basically attained through a number of direct contacts between protein side chains and DNA bases. An important parameter for any site-specific DNA interaction is the ability of the enzyme to distinguish the specific from the non-specific sequence. KpnI REase is able to discriminate specific sequence from non-specific DNA, in contrast to the MTase that binds to both cognate and non-cognate sequences. The KpnI REase–DNA complex is sensitive to salt at an NaCl concentration of >100 mM. In contrast, KpnI MTase binds to DNA even in the presence of 300 mM NaCl (11). The above results suggest that these two enzymes have a different mode of interaction with the cognate DNA.
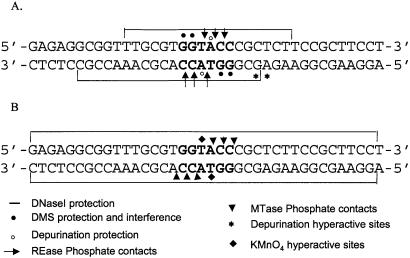
The results of footprinting studies of KpnI REase and MTase are summarized in Figure 7. The DNase I footprint of KpnI REase is comparable with the protection patterns seen with many other REases. EcoRI, HaeIII and HinPI protect 17, 15 and 13 bp of DNA containing the recognition sequence, respectively (22). A compact recognition pattern of DNA seems to be a common feature of all these REases. The unusually large degree of DNA protection by KpnI MTase could be attributed to its binding DNA as a dimer. The in vivo copper–phenanthroline footprinting of KpnI MTase on the pUC18 plasmid also showed an extended footprint protecting a region of 28 bp encompassing the KpnI recognition sequence (16). The base-specific contacts of the two enzymes were identified by DMS and missing nucleotide interference analyses. KpnI REase interacts with the adenine and both guanines within the recognition sequence (Fig. 3). This observation is corroborated by missing nucleotide interference (Fig. 4). The potential protein–phosphate contacts of KpnI REase are similar to those observed with SmaI (23) and XmaI (24). The latter two REases interact with three phosphate groups 5′ to each of the guanines within their recognition sequence 5′-CCCGGG-3′. The phosphate contacts are not only involved in DNA recognition but also play a role in substrate-assisted catalysis of many type II restriction enzymes (25,26). It has been proposed that the attacking water molecule is activated by the phosphoryl oxygen of scissile phosphate (26).
Figure 7.
Summary of footprinting data of KpnI REase (A) and MTase (B) upon binding to the recognition sequence.
The interaction pattern of KpnI MTase with the target DNA is very distinct from that of the REase. Unlike REase, MTase revealed few base-specific contacts. The phosphate recognition pattern of the two enzymes is also very different. Ethylation of phosphates would alter the backbone geometry, facilitating the MTase interaction at the target sequence. Hyperactivity of the phosphate residues seen in the case of MTase suggests that MTase mediates DNA distortion. DNA MTases are known to elicit structural distortion in their recognition sequence. A major DNA distortion that has been observed with many MTases accompanies target base flipping out of the double helix (20,21). The KMnO4 sensitivity of the thymine within the recognition sequence 5′-GGTACC-3′ is consistent with KpnI MTase engaging in a similar base flipping mechanism during the methylation reaction. Such structural distortion was observed in the case of HhaI, TaqI and EcoP15I MTases upon DNA binding when the target base was replaced by thymine within their recognition sequences (21,27).
Comparative studies of REase and cognate MTase at their substrate DNA have revealed differences in their DNA binding properties. Substitution of deoxyinosine by deoxyguanine within the EcoRI recognition sequence resulted in decreased affinity for the EcoRI MTase, but the cognate REase showed cleavage rates identical to that observed with the natural sequence (28,29). Similar results were obtained using base analog studies with EcoRI REase and MTase (30,31). Kinetic studies on non-specific inhibition in the case of the BamHI R–M system revealed a quantitative difference between REase and MTase under catalytic conditions, indicating a difference in binding to non-specific DNA (32). The DNA binding studies using modified oligonucleotides with the EcoRV R–M system showed greater cross-linking with the REase compared with the MTase (33). While these results indicate the differential interaction of REase and MTase at the cognate site, the present study delineates the differences in molecular interactions of the two enzymes using DNA binding and footprinting techniques. The difference in the base-specific recognition of the two enzymes perhaps reflects their intracellular function. The primary role of REase is rapid recognition of the specific sequence before it becomes methylated. In contrast, MTase essentially bound to specific as well as non-specific cellular DNA to protect genome integrity.
In accordance with their different properties, KpnI REase and MTase interact at their recognition sequence in contrasting fashions. The REase recognition of the specific DNA is concise, with elaborate base-specific and phosphate interactions to ensure precise DNA cleavage, emphasizing the symmetrical interaction pattern, a hallmark of dimeric site-specific DNA-binding proteins. In contrasting, few base-specific contacts and an extended protection are characteristics of MTase binding to the cognate site. The salient feature of MTase interaction is to distort DNA to ensure flipping of the target base into the active site of the enzyme to catalyze the methylation reaction. The differences in the interaction at the same sequence by the two enzymes ensure that two entirely different biochemical reactions are carried out subsequent to DNA binding. The characteristic site-specific interactions thus seem to dictate the contrasting chemistry during catalysis by two dissimilar proteins destined to function as components of the cellular defense mechanism.
SUPPLEMENTARY MATERIAL
Supplementary Material is available at NAR Online.
Acknowledgments
ACKNOWLEDGEMENTS
We thank P. Babu (Bangalore Genei, India) for his support of this work, members of the laboratory of V.N. for discussions, D. N. Rao for critical reading of manuscript, and Devanjan Sikder and D. R. Radha for their help in various experiments. Financial support for this work has been obtained from the Department of Science and Technology, Government of India.
REFERENCES
- 1.Bickle T.A. (1993) The ATP dependent restriction enzymes. In Roberts,R.J., Lloyd,R.S. and Linn,S.M. (eds), Nucleases. Cold Spring Harbor Laboratory Press, Cold Spring Harbor, NY, pp. 89–110. [Google Scholar]
- 2.Roberts R.J. and Halford,S.E. (1993) Type II restriction enzymes. In Linn,S.M., Lloyd,R.S. and Roberts,R.J. (eds), Nucleases. Cold Spring Harbor Laboratory Press, Cold Spring, Harbor, NY, pp. 35–88. [Google Scholar]
- 3.Bennett S.P. and Halford,S.E. (1989) Recognition of DNA by type II restriction enzymes. Curr. Top. Cell Regul., 30, 57–104. [DOI] [PubMed] [Google Scholar]
- 4.Pingoud A. and Jeltsch,A. (1997) Recognition and cleavage of DNA by type-II restriction endonucleases. Eur. J. Biochem., 246, 1–22. [DOI] [PubMed] [Google Scholar]
- 5.Dubey A.K. and Roberts,R.J. (1992) Sequence-specific DNA binding by the MspI DNA MTase. Nucleic Acids Res., 20, 3167–3173. [DOI] [PMC free article] [PubMed] [Google Scholar]
- 6.Heitman J. (1993) On the origins, structures and functions of restriction–modification enzymes. Genet. Eng., 15, 57–108. [DOI] [PubMed] [Google Scholar]
- 7.Roberts R.J. and Macelis,D. (2001) REBASE—restriction enzymes and methylases. Nucleic Acids Res., 29, 268–269. [DOI] [PMC free article] [PubMed] [Google Scholar]
- 8.Roberts R.J., Belfort,M., Bestor,T., Bhagwat,A.S., Bickle,T.A., Bitinaite,J., Blumenthal,R.M., Degtyarev,S.Kh., Dryden,D.T., Dybvig,K. et al. (2003) A nomenclature for restriction enzymes, DNA methyltransferases, homing endonucleases and their genes. Nucleic Acids Res., 31, 1805–1812. [DOI] [PMC free article] [PubMed] [Google Scholar]
- 9.Kiss A., Finta,C. and Venetianer,P. (1991) M.KpnI is an adenine-methyltransferase. Nucleic Acids Res., 19, 3460. [DOI] [PMC free article] [PubMed] [Google Scholar]
- 10.Bheemanaik S., Chandrashekaran,S., Nagaraja,V. and Rao,D.N. (2003) Kinetic and catalytic properties of dimeric KpnI DNA methyltransferase. J. Biol. Chem., 278, 7863–7874. [DOI] [PubMed] [Google Scholar]
- 11.Chandrashekaran S., Babu,P. and Nagaraja,V. (1999) Characterization of DNA binding activities of over-expressed KpnI REase and modification methylase. J. Biosci., 24, 269–277. [Google Scholar]
- 12.Ramesh V. and Nagaraja,V. (1996) Sequence specific DNA binding of the phage Mu C protein: footprinting analysis reveals altered DNA conformation upon protein binding. J. Mol. Biol., 260, 22–33. [DOI] [PubMed] [Google Scholar]
- 13.Sikder D. and Nagaraja,V. (2001) A novel bipartite mode of binding of M.smegmatis topoisomerase I to its recognition sequence. J. Mol. Biol., 312, 347–357. [DOI] [PubMed] [Google Scholar]
- 14.Chandrashekaran S. (2002) PhD thesis, Indian Institute of Science, Bangalore, India.
- 15.Leblanc B. and Moss,T. (1994) DNase I footprinting. In Kneale,G. (ed.), DNA–Protein Interactions—Principles and Protocols. Humana Press, Totowa, NJ, pp. 1–10. [Google Scholar]
- 16.Basak S. and Nagaraja,V. (2001) A versatile in vivo footprinting technique using 1,10-phenanthroline–copper complex to study important cellular processes. Nucleic Acids Res., 29, e105. [DOI] [PMC free article] [PubMed] [Google Scholar]
- 17.Craig N.L. and Nash,H.A. (1984) E.coli integration host factor binds to specific sites in DNA. Cell, 39, 707–716. [DOI] [PubMed] [Google Scholar]
- 18.Brunelle A. and Schleif,R.F. (1987) Missing contact probing of DNA–protein interactions. Proc. Natl Acad. Sci. USA, 84, 6673–6676. [DOI] [PMC free article] [PubMed] [Google Scholar]
- 19.Pabo C.O. and Sauer,R.T. (1992) Transcription factors: structural families and principles of DNA recognition. Annu. Rev. Biochem., 61, 1053–1095. [DOI] [PubMed] [Google Scholar]
- 20.Robert R.J. and Cheng,X. (1998) Base flipping. Annu. Rev. Biochem., 67, 181–198. [DOI] [PubMed] [Google Scholar]
- 21.Serva S., Weinhold,E., Roberts,R.J. and Klimasauskas,S. (1998) Chemical display of thymine residues flipped out by DNA methyltransferases. Nucleic Acids Res., 26, 3473–3479. [DOI] [PMC free article] [PubMed] [Google Scholar]
- 22.Fox K.R. (1988) DNase I footprinting of restriction enzymes. Biochem. Biophys. Res. Commun., 155, 779–785. [DOI] [PubMed] [Google Scholar]
- 23.Withers B.E. and Dunbar,J.C. (1995) Sequence-specific DNA recognition by the SmaI endonuclease. J. Biol. Chem., 270, 6496–6504. [DOI] [PubMed] [Google Scholar]
- 24.Withers B.E. and Dunbar,J.C. (1995) DNA determinants in sequence-specific recognition by XmaI endonuclease. Nucleic Acids Res., 23, 3571–3577. [DOI] [PMC free article] [PubMed] [Google Scholar]
- 25.Selent U., Ruter,T., Kohler,E., Liedtke,M., Thielking,V., Alves,J., Oelgeschlager,T., Wolfes,H., Peters,F. and Pingoud,A. (1992) A site-directed mutagenesis study to identify amino acid residues involved in the catalytic function of the restriction endonuclease EcoRV. Biochemistry, 31, 4808–4815. [DOI] [PubMed] [Google Scholar]
- 26.Jeltsch A., Alves,J., Maass,G. and Pingoud,A. (1992) On the catalytic mechanism of EcoRI and EcoRV. A detailed proposal based on biochemical results, structural data and molecular modelling. FEBS Lett., 304, 4–8. [DOI] [PubMed] [Google Scholar]
- 27.Reddy Y.V. and Rao,D.N. (2000) Binding of EcoP15I DNA methyltransferase to DNA reveals a large structural distortion within the recognition sequence. J. Mol. Biol., 298, 597–610. [DOI] [PubMed] [Google Scholar]
- 28.Modrich P and Rubin,RA. (1977) Role of the 2-amino group of deoxyguanosine in sequence recognition by EcoRI restriction and modification enzymes. J. Biol. Chem., 252, 7273–7278. [PubMed] [Google Scholar]
- 29.Rubin R.A. and Modrich,P. (1977) EcoRI methylase. Physical and catalytic properties of the homogeneous enzyme. J. Biol. Chem., 252, 7265–7272. [PubMed] [Google Scholar]
- 30.Brennan C.A., Van Cleve,M.D. and Gumport,R.I. (1986) The effects of base analogue substitutions on the methylation by the EcoRI modification methylase of octadeoxyribonucleotides containing modified EcoRI recognition sequences. J. Biol. Chem., 261, 7279–7286. [PubMed] [Google Scholar]
- 31.Brennan C.A., Van Cleve,M.D. and Gumport,R.I. (1986) The effects of base analogue substitutions on the cleavage by the EcoRI restriction endonuclease of octadeoxyribonucleotides containing modified EcoRI recognition sequences. J. Biol. Chem., 261, 7270–7278. [PubMed] [Google Scholar]
- 32.Nardone G., George,J. and Chirikjian,J.G. (1986) Differences in the kinetic properties of BamHI endonuclease and methylase with linear DNA substrates. J. Biol. Chem., 261, 12128–12133. [PubMed] [Google Scholar]
- 33.Nikiforov T.T. and Connolly,B.A. (1992) Oligodeoxynucleotides containing 4-thiothymidine and 6-thiodeoxyguanosine as affinity labels for the EcoRV restriction endonuclease and modification methylase. Nucleic Acids Res., 20, 1209–1214. [DOI] [PMC free article] [PubMed] [Google Scholar]
Associated Data
This section collects any data citations, data availability statements, or supplementary materials included in this article.


