

Abstract
Purpose
To determine if 2D ss-IMIV-DWEPI can be used to obtain quantitative diffusion measurements that can assist in the identification of plaque components in the cervical carotid artery.
Materials and Methods
The 2D ss-DWEPI sequence was combined with interleaved multislice inner volume region localization to obtain diffusion weighted images with 1mm in plane resolution and 2mm slice thickness. Eleven subjects, 6 of whom have carotid plaque, were studied with this technique. The ADC images were calculated using DW images with b=10.s/mm2 and b=300 s/mm2.
Results
The mean ADC measurement in normal vessel wall of the 11 subjects was 1.28±0.09×10⁻³ mm2/s. Six of the 11 subjects had carotid plaque and ADC measurements in plaque ranged from 0.29 to 0.87 ×10⁻³ mm2/s. Of the 11 common carotid artery walls studied (33 images), at least partial visualization of the wall was obtained in all ADC images, more than 50% visualization in 82% (27/33 images), and full visualization in 18% (6/33 images).
Conclusion
2D ss-IMIV-DWEPI can perform diffusion weighted carotid MRI in vivo with reasonably high spatial resolution (1×1×2 mm3). ADC values of the carotid wall and plaque are consistent with similar values obtained from ex vivo endarterectomy specimens. The spread in ADC values obtained from plaque indicate that this technique could form a basis for plaque component identification in conjunction with other MRI/MRA techniques
Keywords: MRI, Plaque component identification, diffusion weighted imaging, ADC values, 2D ss-IMVI-DWEPI
Disease in the cervical carotid artery is a major cause of stroke and subsequent disability and mortality (1). Plaques resulting from the development and progression of atherosclerosis may grow to obstruct the arterial lumen, resulting in stenosis and impaired cerebral perfusion. In addition, they may rupture leading to cerebral embolization and focal cerebral ischemia. The risk of clinical manifestation depends on the characteristics of the individual lesion. Although clinical risk factors for atherosclerosis help to identify patients at risk of stroke, identification of the plaque components in patients with carotid atherosclerosis is not possible by imaging techniques such as angiography that only visualize the lumen. CT and ultrasound lack sufficient spatial and/or density resolution to accurately differentiate tissue components. There is a strong need for noninvasive in vivo imaging methods that can assist in characterization of atherosclerotic plaques and identification of vulnerable plaques prior to the development of clinical symptoms (2). The availability of different MR imaging techniques appears to provide potential for noninvasive characterization of atherosclerotic plaque composition (3-5).
To adequately characterize atherosclerotic plaque, it is important to identify the components of the plaque that predispose it to thrombosis or embolization. These plaque components include lipid (necrotic) core, fibrous tissue and cap, intraplaque hemorrhage or thrombus, calcification, and surface abnormalities including ulceration. The presence of a significant necrotic core, ruptured fibrous cap, intraplaque hemorrhage, and ulceration have been found to correlate with plaque rupture and clinical symptoms (6-8).
There are several MRI sequences that are currently used to identify atherosclerotic plaque composition. These sequences include 3D TOF, FIESTA (True FISP), T1w, and T2w black blood techniques. Each sequence is able to discriminate certain plaque components, but has significant limitations in identifying others (9-12). No single sequence or combination of existing sequences has proven to be uniformly accurate in identifying all plaque components. Contrast enhanced MRI in atherosclerotic plaque has been used to increase the accuracy of identification of plaque structures indicative of vulnerability such as necrotic lipid core and fibrous cap. It is also used in the dynamic phase to evaluate the parameters associated with the plaque neovasculature (13-15).
Diffusion weighted imaging (DWI) has the potential to provide complementary information that, when used in conjunction with existing sequences, will allow better discrimination of plaque components. There is evidence that intraplaque thrombus can be detected by diffusion weighted MRI (DWI) (12,16,17). Further there is evidence that DWI can uniquely discriminate necrotic core from fibrous tissue. Recently, Clarke et al. demonstrated by MRI of in vitro carotid specimens, that DWI may provide additional contrast of the atherosclerotic plaque (18,19) that better identifies the necrotic (lipid) core.
2D single shot (ss) and multishot DW Echo Planner Imaging (EPI) techniques have both been used in general intracranial MRI. However, EPI acquisition leads to imaging distortion, drop-out, blurring and signal loss. In general, an intrinsically low bandwidth along the phase-encoding dimension contributes geometric distortion, which is associated with a progressive evolution and dispersion of the signal phase throughout the readout period. Dispersion of the signal phase arises in part from magnetic susceptibility differences near the air/tissue or bone/tissue interfaces around the cervical carotid artery (20). Geometric distortion in EPI is proportional to the inverse of ky travel speed in EPI acquisition, which is proportional to the imaging FOV. Further, blurring caused by T2* decay during the course of EPI readout is even more increased in attempting to improve resolution. Thus, it is difficult to obtain DWI with a spatial resolution sufficient to discriminate the plaque component from surrounding cervical carotid artery structures.
The susceptibility artifact and blurring may be reduced by reducing the imaging FOV in the phase-encoding direction. Reducing the phase-FOV generally induces an aliasing artifact. Multishot DWI, which also has increased ky increments and therefore reduced susceptibility artifacts, is unfortunately highly sensitive to motion artifacts. For example, multishot-DWEPI acquisition techniques suffer from the instability of phase errors between shots due to global or localized motion including swallowing and breathing during application of the large diffusion gradients. These motion-induced phase errors render images of the carotid artery unsuitable for plaque component identification. Therefore, neither technique has been used with spatial resolution sufficient for plaque component discrimination in the cervical carotid artery.
Although 2D ss-DWEPI has the greatest potential to be useful in carotid artery imaging because of the reduced sensitivity to motion artifacts and its high time efficiency, it is still limited by susceptibility-induced geometric distortion. This distortion can be improved by the use of parallel imaging (21,22) or a reduced FOV to increase k-space travel speed. The reduction factor in parallel imaging depends upon the sensitivity profiles of the receiver coils. A reduction factor larger than two would be advantageous in reducing artifacts, but would require improvements to the coil arrays that are typically used for cervical carotid artery imaging. Such coils are not currently available.
In an attempt to reduce the geometric distortion and blurring, we have investigated inner volume (IV) imaging (23,24). IV imaging uses refocusing RF (radio frequency) pulses that are slice selective in the phase-encoding (PE) direction to limit the excited FOV to the anatomy of interest. Conventional IV imaging has low time efficiency because the PE selective RF pulse precludes interleaved multislice data acquisition. To address this limitation, a modified IV imaging technique which is called “interleaved multiple inner volume” (IMIV) imaging has been recently developed. When combined with 2D ss-DWEPI, the resulting technique, 2D ss-IMIV-DWEPI, can perform high-resolution interleaved multiple slice DWI (25,26) resulting in improved time efficiency. 2D ss-IMIV-DWEPI allows efficient DWI of anatomical regions where conventional 2D ss-DWEPI does not provide accurate information due to the severity of the susceptibility distortion. Because spatial coverage in the phase-encoding direction is limited by the reduced FOV inherent in 2D ss-IMIV-DWEPI, this method allows acquisition of DWI data from nearly any localized region of the body, many of which cannot be currently studied with other available DWI techniques.
The purpose of this paper is to determine if 2D ss-IMIV-DWEPI can be used to obtain quantitative diffusion measurements that can assist in the identification of plaque components in the cervical carotid artery.
Materials and Methods
2D ss-IMIV-DWEPI Technique
To create the 2D ss-IMIV-DWEPI pulse sequence, the Siemens 2D single shot spin-echo DWEPI sequence was modified using the IDEA pulse sequence development environment (Siemens Medical Solutions, Erlangen, Germany) to image a reduced field of view by incorporating interleaved multiple inner volume (IMIV) imaging pulses (26). The pulse sequence is illustrated in Fig. 1. In the IMIV implementation, the localized volume for interleaved multiple inner volume (IMIV) imaging is implemented by two adiabatic 180° RF pulses (the pulses enclosed in the dotted box in Fig. 1). The two adiabatic pulses are slice-selective in the phase encoding direction and each is surrounded by two crusher gradients. The two adiabatic RF pulses are used to first invert and then restore the magnetization in the entire inner volume. For the transverse magnetization within the inner volume in the imaging plane each of the two adiabatic pulses acts as a refocusing pulse and each imparts a spatially non-linear phase to the transverse magnetization. However, the phase imparted by the first adiabatic pulse is cancelled by the phase imparted by the second pulse. Finally, the crusher gradients around the adiabatic pulses eliminate signal from all out-of-volume transverse magnetization. This IMIV process allows time-efficient interleaved reduced-FOV acquisition of multiple slices 26. The inversion pulses are closely spaced in time, minimizing the time for T1 decay of the spins in the other slices of the imaged volume. The application of IMIV increased TE by about 12 ms, which included the two 5.12 ms duration RF pulses and the two pairs of crusher gradients.
Figure 1.

Pulse Sequence diagram of 2D ss-IMIV DWEPI. Three reference gradient echoes for EPI phase correction are acquired before the first diffusion gradient lobe. IMIV contains two adiabatic 180° RF pulses and crusher gradients for inner-volume imaging. The two adiabatic pulses are slice-selective in the phase encoding direction (vertical arrows) and each is surrounded by two crusher gradients (horizontal arrows). τ1 is the time between excitation and the first adiabatic inversion RF pulse and τ2 is the spacing between the two adiabatic inversion RF pulses.
Fig. 2 describes the magnetization evolution in the imaged (Slice 1) and other slices (Slices 2, 3, 4) in the location of interest during one cycle of 2D-ss-IMIV-DWEPI application. The spins residing in the imaged slices are excited by the 90° RF pulse and subjected to strong dephasing by the first diffusion encoding gradient (Fig. 2, second column, first row). Two adiabatic 180° pulses follow. The first pulse inverts the spins outside the slice selected by the initial 90° excitation, and refocuses the spins within this slice. Refocusing with a single adiabatic pulse causes phase in the refocused magnetization, which depends on the local B1 amplitude. The second adiabatic pulse again inverts spins outside the slice selected by the initial 90° excitation, returning them to the +z direction. Spins within the slice are refocused. The phase imparted to these spins by the first adiabatic refocusing pulse is cancelled by the second adiabatic refocusing pulse (27). However, this pulse creates additional non-linear phase variation along the phase-encode direction. This appears as phase variation along the phase-encode direction in the final image, and does not affect the results. Signal from the out of volume magnetization in the imaged plane is totally eliminated because this magnetization is not refocused and experiences crusher gradients with the same effective polarity (Fig. 2, first row, columns 3 and 4). The magnetization within the region to be imaged but external to the imaged slice experiences two 180° pulses separated by a short time period τ2 and therefore decreases only slightly, enabling the acquisition of multiple interleaved slices. Finally, the magnetization within the selected FOV of the imaged slice is refocused twice by the 180° adiabatic pulses and produces a spin-echo.
Figure 2.
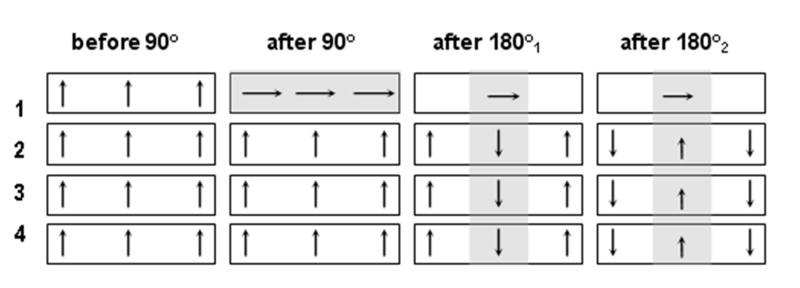
The magnetization evolution while imaging slice #1 from an interleaved acquisition of four slices using 2D ss-IMIV-DWEPI.
The schematic diagram describing the IMIV RF pulses experienced by a particular slice during an interleaved multiple slice acquisition is shown in Fig. 3. Each pair of pulses is separated by a time interval equal to TR/n. Assuming that there are n slices acquired in the repetition time, TR, and assuming perfect adiabatic pulses, the longitudinal magnetization at a specific location just before the excitation RF pulse is described by the Bloch equation
Figure 3.
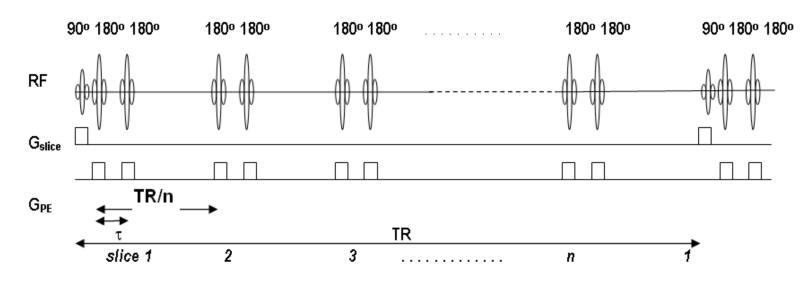
Diagram of RF pulses experienced by a particular slice when imaging using 2D ss-IMIV DWEPI. Before the excitation RF pulse is applied to the specific slice it has seen multiple pairs of the refocusing 180° pulses. All preceding 180° pulses are for imaging other slices with reduced phase FOV, for which the slice-selection gradient is applied along the phase-encoding direction.
| [1] |
where T1 is the spin-lattice relaxation time, τ1 is the time between excitation and the first adiabatic inversion RF pulse, τ2 is the spacing between the two adiabatic inversion RF pulses. Eq. [1] resembles the signal intensity reported previously, except for the additional term τ2 which is the time between the 2nd adiabatic pulse and the 180° refocusing pulse in spin echo EPI. τ1 is the same as TE/2 in DWEPI and is determined by the value of b and ETL.
Eq.[1] was used to simulate the signal intensity of blood with respect to the number of interleaved slices and τ1(TE/2). To estimate the signal loss in our human carotid study, a time interval in the simulation was chosen for the DWI of b=300 mm2/sec at 1.0×1.0×2.0 mm3 resolution. Parameters in the simulation were: TR = 3 s, TE= 55, 64 ms (ETL=41, 81), τ2 = 9.4 ms, τ3 = 3.6 ms, T1 = 1.5 s for blood at 3T. As shown in Fig. 4, signal loss in the IMIV method is relatively small but increases with the number of interleaved slices and the ETL.
Figure 4.

Signal intensity of blood by simulation using IMIS DWEPI technique. The signal intensity decreases linearly over the number of interleaved slices and ETL. Parameters used in the simulation were: TR = 3 s, TE = 55 and 64ms, τ2 = 9.4 ms, τ3 = 3.4 ms, T1 = 1.5 s for blood at 3 T. Signal loss in the IMIV method is relatively small but increases with the number of interleaved slices.
Imaging Studies
All studies were performed on a Siemens Trio 3T MRI scanner (Siemens Medical Solutions, Erlangen, Germany). Diffusion weighted images (DWI) of the carotid arteries of five normal volunteers and six patients with atherosclerosis were acquired using 2D ss-IMVI-DWEPI with the images centered approximately at the flow divider of the bifurcation. The carotid bifurcation was localized using a low resolution multiple overlapping thin slab acquisition (MOTSA) scan. Custom designed bilateral dual-element phased array surface coils were placed on each side of the neck and centered over the region of the bifurcation. The imaging parameters in DWI were: receiver bandwidth = 1.086 kHz/pixel, FOV=160×40 mm2, imaging matrix = 160×40, 2 mm slice thickness, effective TE = 56 ms, TR = 3 s, 40 echoes per each slice, 32 averages (magnitude) and interleaved acquisition of 12 contiguous slices. The in-plane spatial resolution for a typical data acquisition was 1×1 mm2 with display resolution 0.5×0.5 mm2, after zero-filled interpolation. DW images were acquire with b =10 s/mm2 and with b = 300 s/mm2 along the slice selection direction. Images of b=10 and 300 s/mm2 were interleaved.(review1: 3) The total imaging time for both b-values in one diffusion direction with 32 averages was 3 min 20 sec. Conventional DW images from some normal subjects were acquired to compare the imaging quality of the two techniques. Imaging parameters for DWI using conventional 2D ss-DWEPI were: FOV=160×160 mm2, imaging matrix = 160×160, effective TE = 137 ms, and 160 echoes per each slice. The imaging time and b value were kept the same as for the IMIV technique.
T1w images were acquired with three interleaved 2D TSE with our modified version of the double inversion preparation (28,29) with TR = 950 ms, TI = 500 ms, TE = 9.5 ms, and ETL =11, spatial resolution of 0.5×0.5×2 mm3. T2w images of the same slice location as T1w were acquired using 2D TSE with 0.5×0.5×2 mm3, TR = 2.0 s, TE = 65 ms and ETL = 15. Spatial saturation RF pulses were applied superior and inferior to the imaging location to suppress both arterial and venous blood signals. A chemical-shift fat saturation RF pulse was applied to eliminate perivascular fat.
ADC Measurement
Using the expected signal dependence of diffusion weighted factor b
| [2] |
the apparent diffusion coefficient (ADC) maps(mm2/s) were constructed using two diffusion weighted images:
| [3] |
The diffusion weighting factor b is given by
| [4] |
where γ is the gyromagnetic ratio(45.576 MHz/T for proton), G is the strength of diffusion gradient (40 mT/m for maximum gradient strength per axis), time variables δ and Δ are the duration(ms) and the separation of the two diffusion gradients, respectively (30) (see Fig. 1).
ADC values were obtained for the normal wall segments on 3 adjacent slices of the common carotid artery on all 11 subjects. The average ADC value for the 3 slices of each subject was obtained and the mean and standard deviation of the 11 values are reported.
ADC values in the plaque of the 6 subjects were measured at 3 different slice locations within the plaque. On each slice, the average ADC value was determined within an ROI that was drawn to include plaque while excluding calcium. For each subject, the mean plaque ADC from the 3 slices and the standard deviation were calculated and are reported.
Image Quality Assessment
A semi-quantitative assessment of image quality in the ADC maps was performed by visually estimating the fraction of the normal wall that was visible in each of the 3 common carotid images that were used for measuring the ADC of normal wall. A rating scale of 0 to 5 was used for the following fractions of the normal wall circle visible: 0: 0%, 1: <25%, 2: 25%<50%, 3: 50%<75%, 4: 75%<90%, 5: 90%<100%. To display the visual assessment in the 2D-ss-IMIV DWEPI technique, ADC maps of 11 subjects were created. 33 walls in ADC maps were measured (3 walls per each subject). The same visual measurement in ADC maps created by the 2D DWEPI method was also performed except that 9 walls in one subject were examined.
Results
A total of 12 slice locations of diffusion weighted images were acquired on each of 11 subjects, 6 of whom had visible plaque. Typical DWI images obtained using ss 2D-IMIV-DWEPI of a subject without carotid artery plaque are shown in Fig. 5. The images were acquired with (a) b=10 s/mm2, (b) b=300 s/mm2, and (c) the ADC maps calculated from the DW images of (a) and (b). The displayed images are the magnitude-average of 32 images (acquisition time of 1 min 40 sec) for each b value. These images demonstrate that the arterial wall can be seen in most slices. A quantitative assessment of the fraction of common carotid arterial wall cross sections that can be seen in each of the 3 images in which the ADC of normal wall is measured is given in the histogram of Fig. 6. The mean and standard deviation of the measure of this visual assessment was 3.42±0.54. The measurement of visual assessment in the conventional 2D DWEPI was 1.6±0.72.
Figure 5.

b=10. sec/mm2(a), b=300.sec/mm2(b), and ADC map(c) from normal volunteer. ADC maps clearly demonstrate the vessel wall.
Figure 6.

Number of walls visualized by measuring the ADC of normal wall and applying a rating scale of 0 to 5. The mean and standard deviation of the measure in 2D IMIV-DWEPI was 3.42±0.54. The measurement in the conventional 2D DWEPI was1.6±0.72.
ADC measurements were made on 3 slices of the normal wall in the common carotid artery of each of the 11 subjects. The mean and standard deviation of the vessel wall ADC for all subjects was 1.28±0.09×10⁻³ mm2/s.
Fig. 7 displays the ADC images calculated from 2D ss-IMIV-DWEPI (a) conventional 2D ss-DWEPI (b) and T1w images(c), DWI of b=10 s/mm2 acquired using 2d IMIV-DWEPI (d) and conventional 2D DWEPI(e) from a normal volunteer. The DW images and ADC maps using the IMIV technique show clearer vessel wall definition with less signal loss and less distortion compared to the DWI and ADC obtained using the conventional technique (white arrows).
Figure 7.

ADC maps of normal carotid artery calculated from IMIV DWI(a) and conventional DWI(b), T1w images(c), DW images of b=10 s/mm2 acquired using IMIV (d) and conventional (e) method. The DW images and ADC maps using the IMIV technique show clearer vessel wall definition with less signal loss and less distortion compared to the DWI and ADC obtained using the conventional technique (white arrows).
Fig. 8 displays the ADC map (c), and T1w (a) and T2w (b) images of six contiguous slices from a typical subject with plaque (subject 5 in Table 1). The vessel wall structure that can be seen in the corresponding T1w images is well presented in the ADC map. The ADC values near the plaque area are reduced compared to those of the surrounding vessel wall area. The ADC value of the plaque areas (indicated with the red arrows) is 0.67×10⁻³ mm2/sec.
Figure 8.

T1w (a), T2w (b) and ADC map (C) from patient volunteer 5. Arrows indicate the clear contrast between wall and plaque areas.
Table 1.
The mean ADC values of plaque area from six subjects with carotid artery plaque.
| Subject 1 | Subject 2 | Subject 3 | Subject 4 | Subject 5 | Subject 6 | |
|---|---|---|---|---|---|---|
| ADC(10-3 mm2/s) | 0.29±0.09 | 0.49±0.08 | 0.52±0.09 | 0.58±0.10 | 0.67±0.11 | 0.87±0.10 |
Fig. 9 shows T1w (a), T2w (b) images and the ADC map (c) of six contiguous slices of subject 6. The plaque area in a single slice, indicated by a solid white line in Fig. 8b, shows a bright signal on T1w, moderate signal on T2w and low ADC value (0.29×10⁻³ mm2/s). The color image in Fig. 9 is a composite obtained by combining images with 3D TOF, T1w, and T2w contrasts. The plaque area on the color map is spatially well matched with the dark area of the ADC map (inside the white box). The mean plaque ADC of the six subjects with plaque was calculated using ADC measurements from three different plaque locations in each subject (Table 1). The standard deviation is also estimated from these three values.
Figure 9.

Top: T1w (a), T2w (b) and ADC map (c) of six contiguous slices from patient subject 6. Bottom: ADC map, T1w, T2w and composite image from multiple contrast (3D TOF=red, T1w=blue, T2w=green) of same slice location. The plaque area in a single slice shows a bright signal on T1w, moderate signal on T2w and low ADC value (0.29×10⁻³ mm2/s). The plaque area on the color map is spatially well matched with the dark area of the ADC map (inside the white box).
Discussion
In this work 2D ss-IMIV-DWEPI was investigated to address the fundamental problems inherent in obtaining high resolution diffusion images in a single shot and to use the technique to obtain high resolution DW images of the cervical carotid artery. Whereas increased resolution typically contributes more geometric distortion and blurring in 2D ss-DWEPI, the present technique reduces these problems by limiting the volume to a small region of interest. The IMIV technique presented is unique in that it allows efficient interleaved multiple inner volume image acquisitions with very little loss in image quality. The results presented are very encouraging (12 slices in 3 min 20 sec with 32 averages at each of two diffusion b-values). The signal intensity of images from 2D ss-IMIV-DWEPI decreases with increase in the number of interleaved slices and the separation time between the two 180° RF pulses used for inner volume excitation. In principle, applying the IMIV pulses before the refocusing pulse rather than as part of the imaging sequence has the advantage of reduced signal loss, although it adds about 12 ms delay to the echotime (TE).
The results obtained to date on 11 subjects, 6 with carotid plaque, provide good evidence that the 2D ss-IMIV-DWEPI technique can yield good quality in vivo diffusion weighted images of the carotid arteries with a spatial resolution of 1×1×2 mm3. In the visual assessment of image quality, an average of about 75% of the normal vessel wall could be visualized in the resulting ADC map. Plaque is typically larger and more easily visualized in the ADC map. To our knowledge, this is the first study to obtain in vivo diffusion measurements in the carotid wall and plaque. Although no in vivo comparison measurements are available, the diffusion values we obtained for normal arterial wall (1.28×10⁻³ mm2/s) are consistent with ex vivo measurements observed by others (1.50×10⁻³ mm2/s) (31,32).
A large range of diffusion values was observed within the plaques of our patient volunteers and these values were all lower than the ADC of normal wall as might be expected from diffusion measurements in ex vivo studies (33). The large range of diffusion values observed within the plaques of diseased arteries indicates some level of heterogeneity between subjects within this small population. The consistency of diffusion values within the normal wall as compared with the large range of values in plaque suggest that diffusion weighting or, equivalently, ADC images, may be of substantial value as an additional contrast for carotid plaque imaging. However, further work will be required to correlate observed ADC values with types of plaque components confirmed from histology. We believe that the technique demonstrated here can now be used to further investigate the ADC in all types of plaque components.
It should be note that IMIV EPI images also suffer from chemical shift artifacts. For EPI, chemical shift artifacts along the readout direction are effectively suppressed because the receiver bandwidth is considerably larger than in conventional imaging. However, lipid spins with a chemical shift of 440 Hz relative to the water frequency on a 3T system produces a spatial shift along the phase direction. With a receiver bandwidth of 1084Hz and matrix of 160×160 the spatial shift is estimated as 45 pixels, but this spatial shift in DW images using the IMIV technique is decreased by one fourth of the displacement in the conventional EPI. The lipid core component of plaque is actually lipid rich necrotic core and has a very large water component. It appears that the lipid component of the lipid core in plaque is only about 10% (33). Thus, although there may be some lipid signal that is displaced, the great majority of the signal from the lipid core is from water and is not displaced.
In principle, parallel imaging can be used in addition to or in place of IMIV to increase the speed of k in phase direction without additional sacrifice imaging reduction in the phase-encoding direction and to decrease the corresponding susceptibility-induced artifact of conventional 2D ss-DWEPI by a factor of two or more. However, parallel imaging results in a loss in image SNR which depends strongly on a geometric factor determined by the coil sensitivity profiles. The SNR loss increases with reduction factor. For the bilateral 4 element RF coils used in this study (typical of the RF coils used for most clinical carotid artery MRI studies) the full field of view can be reduced by a factor of 2, but the SNR loss increases greatly for higher reduction factors. When the field of view is already reduced, by some other means, parallel imaging cannot effectively achieve further reduction. Because the IMIV method used in this paper achieves a factor of four reduction in the phase FOV, parallel imaging cannot be used to reduce it further. However, combining the IMIV method with parallel imaging could be used to increase the FOV by a factor of two with no increase in distortion artifact. With better sensitivity profiles from improved RF coil design, it might be possible to increase resolution by combining parallel acquisition with IMIV.
As discussed in the methods section, the IMIV technique results in total elimination of the signal from the magnetization outside of the imaged region. Although spatial RF saturation can be performed to limit wrap-around, it is much less effective than the IMIV technique utilized here.
Motion can cause phase errors and blurring. Because it is a single shot acquisition, each image is free from ghosting due to phase errors caused by motion during the diffusion gradients. However, such phase errors will cause the phase at each voxel within each image to vary, depending on the motion that occurs during the diffusion encoding gradients. Thus, although averaging of multiple images would be useful to improve SNR, it has been found necessary to average the magnitude of the acquired images. Such magnitude averaging does increase SNR, but is much less efficient than complex averaging when the original image SNR is low (34).
Although the effects of phase errors are eliminated by using magnitude averaging, various neck motions such as swallowing, respiration, and blood pulsations may still occur and introduce inconsistency among the different averages. To reduce the effects of neck motion on the ADC calculation we interleaved the acquisition of the low and high b-value images for all averages. It is possible to reduce further the motion sensitivity of the ADC calculation by registering each DW image prior to averaging the magnitude images. The effects of carotid wall motion due to blood pulsations might be reduced further by synchronizing the acquisition with the ECG. Because the wall should be more stable in diastole, the incorporation of cardiac gating and a trigger delay may improve the accuracy of the DWI measurement in the in vivo human carotid artery.
In conclusion, these results demonstrate that 2D ss-IMIV-DWEPI can perform diffusion weighted carotid MRI in vivo with reasonably high spatial resolution (1×1×2 mm3). In the study of 11 subjects nearly 70% of the common carotid wall could be visualized in the ADC images. We have used this technique to obtain the first in vivo ADC values of the carotid wall and plaque and the values obtained are consistent with similar values obtained from ex vivo endarterectomy specimens. The spread in ADC values obtained from plaque provide hope that this technique could form a basis for plaque component identification in conjunction with other MRI/MRA techniques.
Acknowledgments
This work was supported by NIH grants R01 HL 48223, R01 HL 57990, R21 NS052424, R21 EB005705, Clinical Merit Review Grant from the Veterans Administration Health Care System, Siemens Medical Solutions, the Mark H. Huntsman Endowed Chair, and the Margolis Foundation.
References
- 1.Fisher M, Paganini-Hill A, Martin A, et al. Carotid plaque pathology: thrombosis, ulceration, and stroke pathogenesis. Stroke. 2005;36:253–257. doi: 10.1161/01.STR.0000152336.71224.21. [DOI] [PubMed] [Google Scholar]
- 2.Lovett JK, Gallagher PJ, Hands LJ, Walton J, Rothwell PM. Histological correlates of carotid plaque surface morphology on lumen contrast imaging. Circulation. 2004;110(15):2190–2197. doi: 10.1161/01.CIR.0000144307.82502.32. [DOI] [PubMed] [Google Scholar]
- 3.Rothwell PM, Gibson R, W CP. Interrelation between plaque surface morphology and degree of stenosis on carotid angiograms and the risk of ischemic stroke in patients with symptomatic carotid stenosis. On behalf of the European Carotid Surgery Trialists' Collaborative Group. Stroke. 2000;31:615–621. doi: 10.1161/01.str.31.3.615. [DOI] [PubMed] [Google Scholar]
- 4.Wrothley S, Helft G, Fuster V, et al. Serial in vivo MRI documents aterial remodeling in experience atherosclerosis. Ciculation. 2000;101:586–589. doi: 10.1161/01.cir.101.6.586. [DOI] [PubMed] [Google Scholar]
- 5.Fayad Z, Fallon J, Shinnar M, et al. Noninvasive in vivo high-resolution magnetic resonance imaging of atherosclerotic lesions in geneticallt engineered mice. Ciculation. 1998;98:1541–1547. doi: 10.1161/01.cir.98.15.1541. [DOI] [PubMed] [Google Scholar]
- 6.Fayad Z, Nahar T, Fallon J, et al. In vivo magnetic resonance evaluation of atherosclerotic plaques in human thoratic aota. Ciculation. 2000;101:2503–2509. doi: 10.1161/01.cir.101.21.2503. [DOI] [PubMed] [Google Scholar]
- 7.Cai J, Hatsukami T, et al. Classification of human carotid atherosclerotic lesions in vivo muticontrast magnetic resonance imaging. Ciculation. 2002;106:1368–1373. doi: 10.1161/01.cir.0000028591.44554.f9. [DOI] [PubMed] [Google Scholar]
- 8.Dhume AS, Soundararajan K, Hunter WJ, A DK. Comparison of vascular smooth muscle cell apoptosis and fibrous cap morphology in symptomatic and asymptomatic carotid artery disease. Ann Vasc Surg. 2003;17:1–8. doi: 10.1007/s10016-001-0331-1. [DOI] [PubMed] [Google Scholar]
- 9.Molloy J, M HS. Asymptomatic embolization predicts stroke and TIA risk in patients with carotid artery stenosis. Stroke. 1999;30:1440–1443. doi: 10.1161/01.str.30.7.1440. [DOI] [PubMed] [Google Scholar]
- 10.Gortler M, Goldmann A, Mohr W, W B. Tissue characterisation of atherosclerotic carotid plaques by MRI. Neuroradiology. 1995;37:631–635. doi: 10.1007/BF00593376. [DOI] [PubMed] [Google Scholar]
- 11.Fleiner M, Kummer M, Mirlacher M, et al. Arterial neovascularization and inflammation in vulnerable patients: early and late signs of symptomatic atherosclerosis. Circulation. 2004;110:2843–2850. doi: 10.1161/01.CIR.0000146787.16297.E8. [DOI] [PubMed] [Google Scholar]
- 12.Moody AR, Allder S, Lennox G, Gladman J, F P. Direct magnetic resonance imaging of carotid artery thrombus in acute stroke. Lancet. 1999;353:122–123. doi: 10.1016/s0140-6736(05)76159-6. [DOI] [PubMed] [Google Scholar]
- 13.Wasserman BA, Smith WI, Trout HH, 3rd, Cannon RO, 3rd, Balaban RS, Arai AE. Carotid artery atherosclerosis: in vivo morphologic characterization with gadolinium-enhanced double-oblique MR imaging initial results. Radiology. 2002;223(2):566–573. doi: 10.1148/radiol.2232010659. [DOI] [PubMed] [Google Scholar]
- 14.Kerwin W, Hooker A, Spilker M, et al. Quantitative magnetic resonance imaging analysis of neovasculature volume in carotid atherosclerotic plaque. Circulation. 2003;107(6):851–856. doi: 10.1161/01.cir.0000048145.52309.31. [DOI] [PubMed] [Google Scholar]
- 15.Kerwin WS, O'Brien KD, Ferguson MS, Polissar N, Hatsukami TS, Yuan C. Inflammation in carotid atherosclerotic plaque: a dynamic contrast-enhanced MR imaging study. Radiology. 2006;241(2):459–468. doi: 10.1148/radiol.2412051336. [DOI] [PMC free article] [PubMed] [Google Scholar]
- 16.Yuan C, Mitsumori LM, Ferguson MS, et al. In vivo accuracy of multispectral magnetic resonance imaging for identifying lipid-rich necrotic cores and intraplaque hemorrhage in advanced human carotid plaques. Circulation. 2001;104:2051–2056. doi: 10.1161/hc4201.097839. [DOI] [PubMed] [Google Scholar]
- 17.Winn W, Schmiedle U, Reichenbach D, et al. Detection and characterization of astherosclerotic fibrous caps with T2-weighted MR. Am J Neuroradiol. 1998;19:129–134. [PMC free article] [PubMed] [Google Scholar]
- 18.Clarke SE, Hammond RR, Mitchell JR, Rutt BK. Quantitative assessment of carotid plaque composition using multicontrast MRI and registered histology. Magn Reson Med. 2003;50(6):1199–1208. doi: 10.1002/mrm.10618. [DOI] [PubMed] [Google Scholar]
- 19.Clarke SE, Beletsky V, Hammond RR, Hegele RA, Rutt BK. Validation of automatically classified magnetic resonance images for carotid plaque compositional analysis. Stroke. 2006;37(1):93–97. doi: 10.1161/01.STR.0000196985.38701.0c. [DOI] [PubMed] [Google Scholar]
- 20.Schmitt F, Stehling MK, Tuner R, Fisher H, Leadback R. Echo-planner. Imaging. 1998:179–200. [Google Scholar]
- 21.Sodickson D, M W. Simultaneous acquisition of spatial harmonics (SMASH): fast imaging with radiofrequency coil arrays. Magn Reson Med. 1997;38:591–603. doi: 10.1002/mrm.1910380414. [DOI] [PubMed] [Google Scholar]
- 22.Pruessmann KP, Weiger M, Scheidegger MB, B P. SENSE: Sensitivity encoding for fast MRI. Magn Reson Med. 1999;42:952–962. [PubMed] [Google Scholar]
- 23.Feinberg D, Hoenninger J, Crooks L, Kaufman L, Watts J, A M. Inner volume MR imaging: technical concepts and their application. Radiology. 1985;156:743–747. doi: 10.1148/radiology.156.3.4023236. [DOI] [PubMed] [Google Scholar]
- 24.Conturo TE, Price RR, B AH. Rapid local rectangular views and magnifications: reduced phase encoding of orthogonally excited spin echoes. Magn Reson Med. 1988;6(4):418–429. doi: 10.1002/mrm.1910060407. [DOI] [PubMed] [Google Scholar]
- 25.Jeong EK, Kim SE, Guo JY, Kholmovski EG, P DL. High-resolution DTI with 2D interleaved multislice reduced FOV singleshot diffusion-weighted EPI (2D ss-rFOV-DWEPI) Magn Reson Med. 2005;54:1575–1579. doi: 10.1002/mrm.20711. [DOI] [PubMed] [Google Scholar]
- 26.Jeong EK, Kim SE, Kholmovski EG, Parker DL. High-resolution DTI of a localized volume using 3D single-shot diffusion-weighted STimulated echo-planar imaging (3D ss-DWSTEPI) Magn Reson Med. 2006;56(6):1173–1181. doi: 10.1002/mrm.21088. [DOI] [PubMed] [Google Scholar]
- 27.Conolly S, Glover G, Nishimura D, Macovski A. A reduced power selective adiabatic spin-echo pulse sequence. Magn Reson Med. 1991;18(1):28–38. doi: 10.1002/mrm.1910180105. [DOI] [PubMed] [Google Scholar]
- 28.Parker D, Goodrich K, Masiker M, Tsuruda J, et al. Improved efficiency in double-inversion fast spin-echo imaging. Magn Reson Med. 2002;47:1017–1021. doi: 10.1002/mrm.10152. [DOI] [PubMed] [Google Scholar]
- 29.Kim SE, Kholmovski EG, Jeong EK, Buswell HR, Tsuruda JS, Parker DL. Triple contrast technique for black blood imaging with double inversion preparation. Magn Reson Med. 2004;52(6):1379–1387. doi: 10.1002/mrm.20296. [DOI] [PubMed] [Google Scholar]
- 30.Stejskal E. Spin Diffusion Measurement: spin echoes in a presence of time dependent field gradient. J Chem Phys. 1965;42:288–292. 1965;42:288-292. TJSDMseiapotdfgJCP. [Google Scholar]
- 31.Viereck J, Ruberg FL, Qiao Y, et al. MRI of atherothrombosis associated with plaque rupture. Arterioscler Thromb Vasc Biol. 2005;25(1):240–245. doi: 10.1161/01.ATV.0000149673.00564.0a. [DOI] [PubMed] [Google Scholar]
- 32.Qiao Y, Ronen I, Viereck J, Ruberg FL, Hamilton JA. Identification of atherosclerotic lipid deposits by diffusion-weighted imaging. Arterioscler Thromb Vasc Biol. 2007;27(6):1440–1446. doi: 10.1161/ATVBAHA.107.141028. [DOI] [PMC free article] [PubMed] [Google Scholar]
- 33.Toussaint J, LaMuraglia G, Southern J, et al. Magnetic resonance images lipid, fibrous, calcified, hemorrhgic and thrombotic components of human atheroscleosis in vivo. Ciculation. 1996;94:932–938. doi: 10.1161/01.cir.94.5.932. [DOI] [PubMed] [Google Scholar]
- 34.Kristoffersen A. Diffusion measurements and diffusion tensor imaging with noisy magnitude data. J Magn Reson Imaging. 2009;29(1):237–241. doi: 10.1002/jmri.21589. [DOI] [PubMed] [Google Scholar]