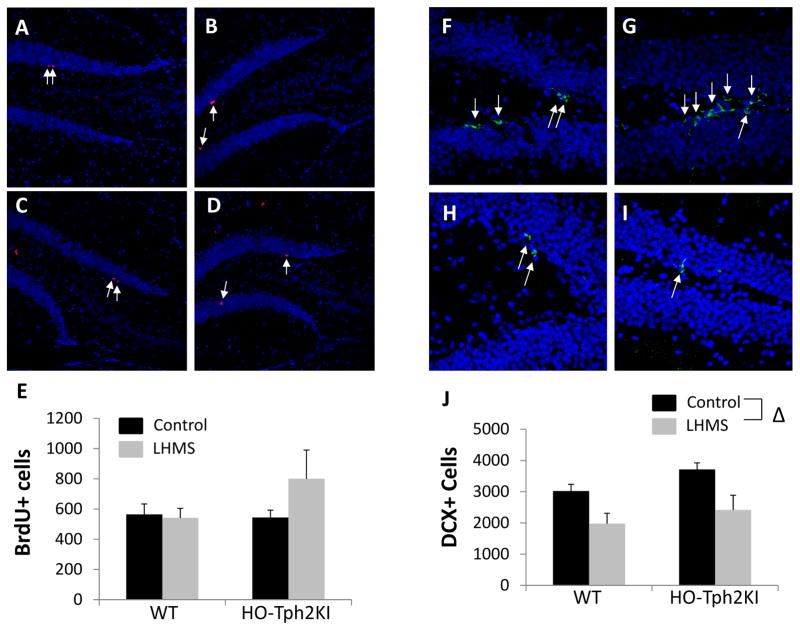
Figure 5.
The effects of LH/MS on cell proliferation and doublecortin expression in the hippocampus. Representative images depicting BrdU immunoreactivity from the hippocampus of WT-Control (A), HO-Tph2KI-Control (B), WT-LH/MS (C), and HO-Tph2KI-LH/MS (D) mice. The results of quantification are shown in (E). Representative maximum-intensity-projection images of confocal z-stacks depicting DCX immunoreactivity from the hippocampus of WT-Control (F), HO-Tph2KI-Control (G), WT-LH/MS (H), and HO-Tph2KI-LH/MS (I) mice. The results of quantification are shown in (J). Δ indicates a significant main effect of stress by two-way ANOVA (p < 0.001). N = 6–15 per group.

