
Figure 4. Transient sampling dsDNA lacking microhomology.
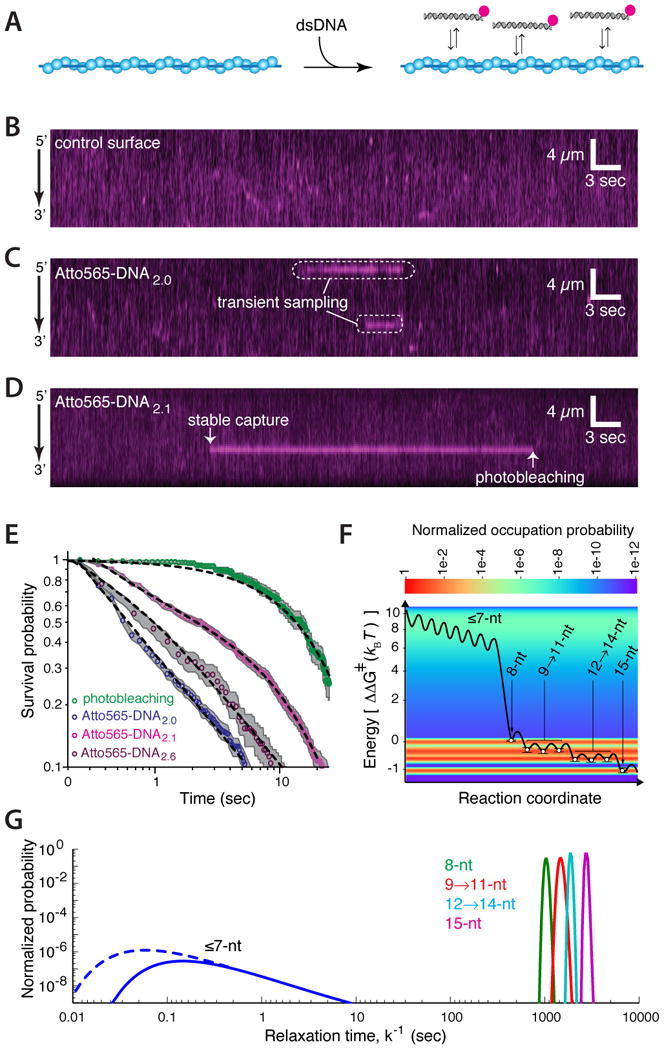
(A) Strategy for visualizing dsDNA sampling at 60-msec resolution. Kymographs showing (B) Atto565-DNA1.0 in the absence of the PC (control surface), and Rad51 PCs sampling (C) Atto565-DNA2.0 or (D) Atto565-DNA2.1. (E) Log-log plot revealing the power-law dependence of the transient search intermediates. Dashed lines represent a single exponential fit to the photo-bleaching data, power-law fits for Atto565-DNA2.0 and Atto565-DNA2.6, and combination of a power-law and single exponential fit for Atto565-DNA2.1. (F) Energy landscape describing dsDNA sampling and strand invasion by Rad51; the heat map and open circles (±S.D.) represent calculated values for normalized occupation probability and ΔΔG‡ values based on experimental data, respectively; the black line is a representation of the landscape and the heights of the energy barriers between states is for illustrative purposes only. Additional details are presented in the main text and Supplemental Information. (G) Distribution of kinetic rates for dsDNA sampling and capture by Rad51; solid lines represent experimental data and the dashed line reflects intermediates that are sampled too rapidly to be detected.