Abstract
Background
It is well known that different species have different protein domain repertoires, and indeed that some protein domains are kingdom specific. This information has not yet been incorporated into statistical methods for finding domains in sequences of amino acids.
Results
We show that by incorporating our understanding of the taxonomic distribution of specific protein domains, we can enhance domain recognition in protein sequences. We identify 4447 new instances of Pfam domains in the SP-TREMBL database using this technique, equivalent to the coverage increase given by the last 8.3% of Pfam families and to a 0.7% increase in the number of domain predictions. We use PSI-BLAST to cross-validate our new predictions. We also benchmark our approach using a SCOP test set of proteins of known structure, and demonstrate improvements relative to standard Hidden Markov model techniques.
Conclusions
Explicitly including knowledge about the taxonomic distribution of protein domains can enhance protein domain recognition. Our method can also incorporate other context-specific domain distributions – such as domain co-occurrence and protein localisation.
Background
Protein domains are the structural, functional and evolutionary units of proteins. Several statistical techniques are currently used for detecting protein domains. In particular, Profile hidden Markov models (profile HMMs) have been successfully applied to this problem [1,2], and form the basis for databases such as Pfam [3]. Profile HMMs can be more sensitive than methods which look for pairwise homology [4]. Our ability to detect distant homology is limited by noise. This is due to the divergence of the amino acid sequence too far away from the profile to detect the similarity, despite the preservation of structure and function. We attempt to take into account extra information concerning the patterns of occurrence of domains in order to recognize distant homology. We have previously discovered that using the probabilities of domains occurring together in a sequence as contextual information significantly enhances domain detection [5]. In this paper we investigate using the species distribution of domains to enhance detection.
Fig. 1 shows examples of domains which have biased taxonomic distribution. For example, the 4Fe-4S binding domain comprises 2.9% of archaeal domains in Pfam, but only 0.5% of bacterial domains and 0.05% of eukaryota domains. Therefore, a weak 4Fe-4S binding domain signal in archaea is more likely to be a real signal than a weak eukaryota 4Fe-4S binding domain signal. Intuitively, we need less amino-acid based evidence to believe an 4Fe-4S binding domain in archaea than a 4Fe-4S binding domain in eukaryota, and we should adjust our thresholding to reflect this. We justify such an approach through an application of Bayes rule and develop an algorithm for incorporating species distribution information into our calculations.
Figure 1.
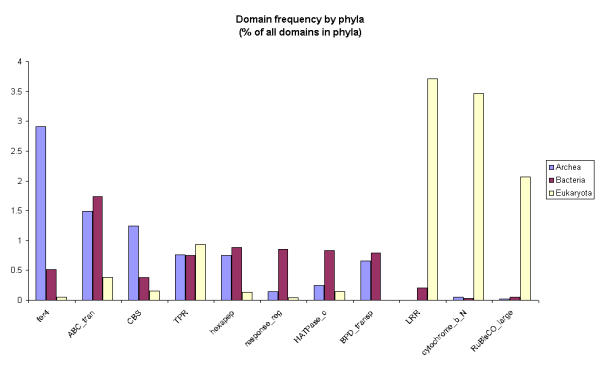
Distribution of example domains amongst archaea, eukaryota and bacteria. The top 5 domains for each phyla are included.
Results
For each sequence fragment A from a species S, our approach is to annotate the sequence as domain D if the probability P(D|A,S) is sufficiently high. This probability can be split (using Bayes' rule) into an amino-acid based and species based term:

Taking logs and approximating P(A|D,S) by P(A|D), we obtain
![]()
with domain score threshold  . We note that P(A|D) represents the probability that our model for domain D generated the sequence A; and that P(A|S) represents the probability that the sequence was generated independently residue by residue according to a species dependent composition model S. The term P(D|S) represents the probability of obtaining domain D in a random draw from species S; and P(D) represents the probability of obtaining D according to a background distribution over domains.
In the Pfam annotation [3], a domain D annotating the sequence fragment A is recognized as real if the domain log-odds ratio is greater than a manually curated threshold,
![]()
The log-odds ratio is calculated using the HMMER package [6]. In this formulation P(A|D) represents the probability that the profile HMM representing D generated the sequence A. The term P(A|R(D)) represents the probability that the sequence was generated independently residue by residue according to a baseline composition model. The composition model is derived from the domain model by looking at the average composition of sequences generated by the model. This removes spurious matches based on composition alone.
In eq. 2 we replace the species composition model P(A|S) with a domain specific compositional model P(A|R(D)). By comparing eqs. 2 and 3, we see that the taxonomic adjustment is the right-hand bracket of eq. 2, and so our taxonomic score is:
![]()
The procedure we used to estimate the right-hand adjustment term is described in detail in the Methods section.
SCOP/ASTRAL benchmark
SCOP is a database which classifies all proteins of known structure [7]. SCOP classifies protein domains: multi-domain proteins are split into component protein domains which are classified hierarchically in four levels: family, superfamily, fold and class. Sequences belonging to the same family share sequence similarity, suggesting a common function and implying a clear common evolutionary origin; families are clustered into superfamilies on the basis of structural similarity, suggesting a probable common evolutionary origin; superfamilies are grouped into folds on the basis of similar secondary structure topology. ASTRAL is a database of protein sequences of known structure, annotated with SCOP family classifications [8]. ASTRAL provides protein sequences filtered to various levels of sequence similarity. Our test set consisted of ASTRAL sequences filtered so that no pair of sequences has more than 40% identity.
Pfam is a database of multiple sequence alignments and hidden Markov models [3]. Pfam classifies all sequences in SWISS-PROT/TrEMBL on the basis of sequence similarity. This study focuses on extending homology detection of Pfam models at the SCOP superfamily level, as this represents a 'hard' test of homology recognition. Our set of test models consists of 869 Pfam families each of which overlap one and only one SCOP superfamily. We classify proteins in the same superfamily as homologous. We classify proteins which are in different folds as non-homologous. Proteins which are in the same fold but different superfamily are not classified.
We compare the detection of homologies by the HMMER package [6] to HMMER with a taxonomic adjustment. We calculate both the HMMER log-odds score and the taxonomically adjusted log-odds score. From both of these values, we calculate an e-value (based on the parameters of the extreme value distribution previously obtained for the Pfam HMMER model). This e-value is the expected number of sequences with greater or equal log-odds score in a randomly selected database of the same size as our test database. We investigate here the extent to which a global e-value threshold on both the log-odds score and the taxonomically adjusted log-odds score can be used to separate homologous from non-homologous sequences. We rank the aggregated list of matches over all models according to significance. Ideally such a list contains all homologous sequences at the top of the list above some cut-off, followed by all non-homologous sequences. However, this is not possible with current techniques. Fig. 2 shows a coverage vs error curve, which plots at each point in the ranked list the number of homologous sequences above this point against the number of non-homologous sequences above this point. A randomly ranked list would give (on average) an equal proportion of homologous and non-homologous sequences identified. We see that taxonomy systematically improves homology detection across all ranges of false classification rates. We also plot for each method the number of false positive and false negative matches at a given e-value significance (fig. 3). We see that taxonomy systematically improves error rates over a range of e-values, by reducing false positive matches with negligible impact on false negative matches. This demonstrates that at a given e-value threshold, HMMER-taxonomy has a lower error rate than HMMER alone. From the point of view of large scale classification of protein homology with profile HMMs this is an important result, as classification is often done on the basis of a global e-value threshold.
Figure 2.
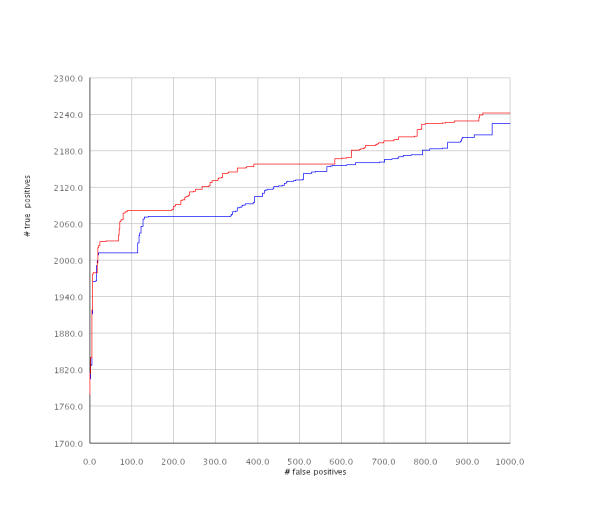
Coverage vs error curve for detection of remote homologies using HMMER and HMMER-taxonomy. The blue line represents the HMMER score, the red line represents the HMMER-taxonomy score. A higher line indicates a better classification of remote homologies. We display only up to 1000 false positives.
Figure 3.
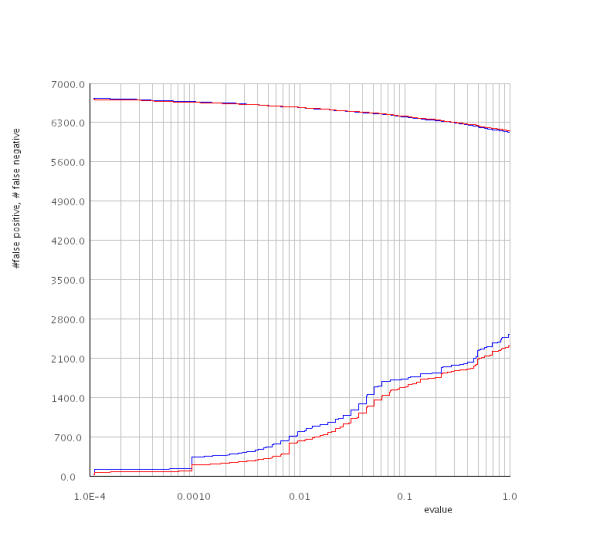
Number of false negative (upper two lines) and false positive (lower two lines) matches versus e-value threshold for HMMER (blue lines) and HMMER-taxonomy (red lines). At a given e-value threshold, taxonomy substantially decreases false positive rates with negligible impact on false negatives.
One family with significant improvement is the Delta Atracotoxin domain (PF05353). HMMER alone scores 1 positive sequence from the ASTRAL test set above the first negative sequence, whereas HMMER-taxonomy scores 4 sequences above the first negative sequence. This improvement is obtained both by increasing the significance of three homologous low significance scores (from 57,43, 76 to 5,5,6 respectively) and decreasing the significance of non-homologous high significance scores (from 3,6 to 180,130 respectively). In the Pfam annotation, this domain is restricted to the Mygalomorphae infraorder (which includes funnel web, trapdoor and tarantula spiders and belongs to the Araneae order – spiders – of the Arachnida class). The improvement in classification includes 1 protein from the Scorpionida order (or Scorpions, which also belongs to the Arachnida class). Fig. 4 displays the significance scores for both HMMER and HMMER-taxonomy on this family. Another family in which taxonomy performs well is the immunoglobulin domain (PF00047). HMMER scores 86 positive sequences above the first negative sequence, whereas with the taxonomy adjustment, 93 positive sequences are scored above the first negative sequence.
Figure 4.
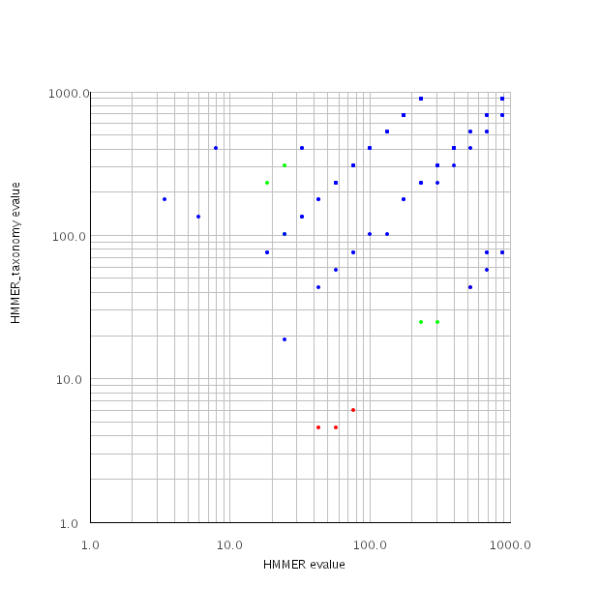
E-value significance scores for HMMER-taxonomy vs HMMER for PF05353 (Atracotoxin), plotted on a log-log scale. The red dots represent sequences in the same SCOP superfamily (which are treated as homologous). The blue dots represent sequences in different SCOP folds (which are treated as non-homologous). The green dots represent sequences in the same SCOP fold but different superfamily (which are treated as neither homologous or non-homologous). Note that the most significant match (with e-value of 3.9e - 33 unchanged by the taxonomic adjustment) is not shown. The three red dots in the bottom half of the graph are homologous sequences which are more significant (e-values 4–6) under HMMER-taxonomy than under HMMER alone (e-values 40–80). In general points below the diagonal line y = x are more significant under the HMMER-taxonomy model than under HMMER alone, whereas those above are less significant.
Pfam scan
We apply our method for detecting protein domains to the Pfam database. We consider whether we can improve the coverage of existing Pfam models by incorporating taxonomic information. In contrast with the SCOP/ASTRAL benchmark, we use manually curated thresholds from Pfam, rather than e-value thresholds, as we wish to compare our new annotation with the existing Pfam annotation. Our rationale is that the Pfam annotation is based on these thresholds, and we wish to evaluate the effect of taxonomically adjusting log-odds scores independently of modifying the thresholding technique. By rescanning SWISS-PROT/TrEBML, we found 4447 extra occurrences of Pfam families in proteins from SWISS-PROT/TrEMBL in the Pfam database, with sequence coverage equivalent to the last 8.3% of Pfam families (401 of 4,832 families in release 7.7). This corresponds to a 0.7% increase in the number of domain predictions. The new occurrences are limited to 461 Pfam families, of which 242 families contribute 95% of new hits.
Fig. 5 displays the families that the method detects most frequently. Our method particularly enhances detection of short Pfam families: the new occurrences have an average length of 51 residues, compared to the database average of 155 residues. This is due to the lower amino acid based information available for short families, and hence the higher relative importance of contextual information.
Figure 5.
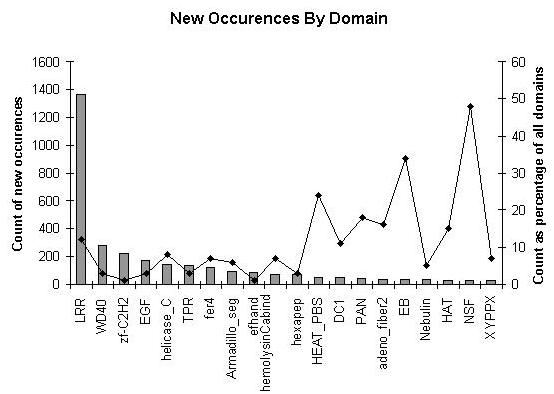
Domain occurrences amongst top 20 'species' families. The bars shows the absolute number of new predictions; the solid line shows the percentage increase in that family.
Fig. 6 shows examples of new domain occurrences found by this method. We find a pair of TPR repeats in Aspartyl (asparaginyl) beta-hydroxylase (Q9Y4JO). This protein has been shown to be over-expressed in an enzymatically active form in hepatocellular carcinoma and cholangiocarcinoma [8]. The enzyme acts by catalyzing post-translational hydroxylation of β carbons of aspartyl and asparaginyl residues in EGF-like domains with the appropriate consensus sequence. In particular, the Notch homologues – which are known to be involved in cell differentiation and have been shown to be oncogenic – have the appropriate consensus sequence. TPR domains are thought to be involved in protein-protein interactions [10], and may therefore help to mediate this interaction.
Figure 6.
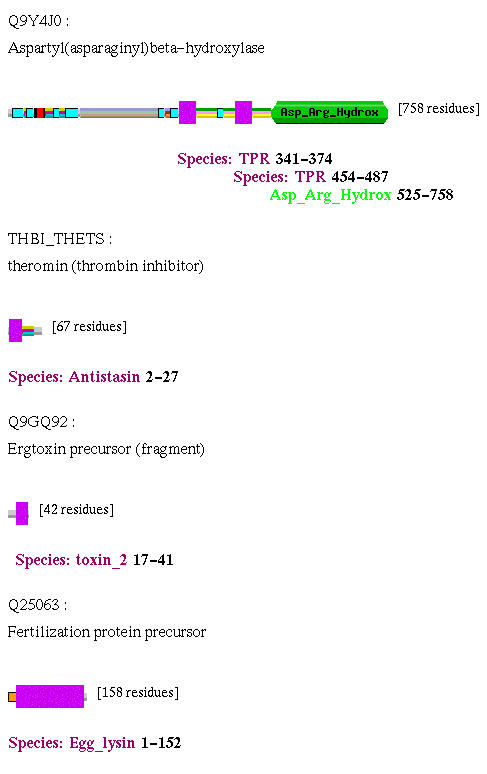
Emergence of new domains occurrences, identified using the taxonomy adjustment, indicated by magenta boxes and 'Species:' labels. Standard Pfam domains are indicated by angled boxes.
We find a novel antistasin domain on the theromin protein (THBI_THETS) in Theromyzon tessulatum, a leech. This protein has important medical applications as a potent thrombin inhibitor, and is found in the head of the leech [11]. The antistasin family is an inhibitor of trypsin-family proteases and is often found in anti-coagulants. Again we find that the function of the protein concurs with the novel domain occurrence. We also find a novel occurrence of the toxin_2, or scorpion short toxin domain on the ErgToxin protein (Q9GQ92) in Centuroides noxius (Mexican scorpion). The ErgToxin protein blocks the ERG-K+-channels of nerve, heart and endocrine cells [12]. Other members of the toxin_2 family also inhibit potassium channels.
Finally, in the fertilization 18 kda protein (Q25063) in Haliotis fulgens (Green Abalone), we identify a novel Egg_lysin domain. Egg_lysin is found in other Haliotidae, as well as other Archaeogastropoda. The 18 kda fertilization protein acts in conjunction with a paralogous 16 kda lysin protein on the egg vitelline envelope. The 16 kda protein creates a hole in the vitelline envelope. The 18 kda protein is a potent fusagen of liposomes, and is thought to mediate membrane fusion between the gametes, a step in gamete recognition which is important in restricting heterospecific fertilization in other species [13]. These authors also found very high divergence amongst the group of orthologous 18 kda proteins in California abalone; together with a high frequency of non-synonymous to synonymous substitution, indicating a high selective pressure toward differentiation between species and thus furthering the gamete recognition hypothesis. Furthermore, the 18 kda protein exhibits a rate of evolution 2–3× that of the 16 kda protein. The 18 kda protein in Haliotis fulgens is the most distantly related of this group (with 27%–34% identity to the others), and hence standard profile methods fail to detect the similarity. We see that the taxonomic score adjustment helps to correctly identify a distantly related domain.
The predictions of our method have been validated by a PSI-BLAST [14] test (table 1). For each novel predicted domain occurrence, PSI-BLAST was used to generate a set of similar sequence fragments. These sequences were then searched for matches to Pfam families. For 41.8% (100% - 58.2%) of novel domain occurrences PSI-BLAST found matches that are annotated in Pfam. In 87.4% (36.5%/41.8%) of these the majority of annotations matched the correct family; a further 11.0% (4.6%/41.8%) had at least one match to the correct family; 0.2% (0.1%/41.8%) matched a related family and 1.4% (0.6%/41.8%) had all matches to incorrect families. This also demonstrates our approach can detect matches which PSI-BLAST does not.
Table 1.
Blast Results For New Positives Predicted By Model.
| PSI-BLAST does not find match in Pfam Family | 2590 | 58.2% | |
| Majority of matches to correct Pfam family | 1619 | 36.5% | |
| Majority of matches to incorrect family | Has 1 match to correct family | 206 | 4.6% |
| Has matches to related family | 5 | 0.1% | |
| All matches to unrelated families | 27 | 0.6% | |
We compare these results with our previous results detected using a variable order Markov model to detect domain co-occurrence [5]. We reported there 15,263 new domain occurrences, equivalent to the last 15.6% of Pfam families. Furthermore, we find that of the two sets of new domain occurrences, 3803 of the new occurrences occur in both. This suggests that domain co-occurrence and taxonomic distribution often reinforce each other. The new domain occurrences from the paper are available via the Pfam website, and we will incorporate the incremental new detections of the method of this paper into Pfam in a similar manner.
Conclusion
We have demonstrated that taxonomic distribution can be used to enhance protein domain detection. Furthermore, we have found several examples in which the increased predictive power has discovered domains which are biologically important. From a theoretical point of view, this method is significant in that it provides a way of evaluating in a probabilistic fashion the appropriate trade-off between amino-acid signal strength and species information. Lastly, from a pragmatic perspective, the method increases sequence coverage. The taxonomic adjustment is a general technique which can be applied to other similarity searches, including BLAST and PSI-BLAST [14].
We can also see this more broadly as an example of a general method which can be used to integrate contextual information into a similarity detection algorithm. In particular, we have already used similar techniques to integrate information pertaining to domain co-occurrence. One line of future development is to use both types of information together. Another possible form of contextual information is protein localisation. There are, however, challenges in deciding the best way to integrate this information into a single model, and this remains a basis for ongoing research.
Methods
Algorithm
The first term in eq. 4 is pre-calculated using HMMER. We keep all those hits which have HMMER e-value less than 1000 to search with the taxonomic adjustment.
The probability P(D) is estimated from currently annotated domains in Pfam:
![]()
where N(D) represents the count of domain D in the database, and Ntot the total number of domains in the database.
We also need to estimate the probabilities for each domain conditional on each species, P(D|S), which is complicated by sparsity of the data set. To combat data sparsity, and to avoid constructing thresholds which preclude the possibility of observing certain species-domain pairs, we recursively interpolate frequencies of taxa and domain combinations along a guide species tree. For i = 0,..., m - 1, where S0 = S is the species and Si is the ith parent taxon, we write

We denote by Sm the kingdom, and write

The parameter α represents the degree to which the estimation is based on nodes higher up in the taxonomy, rather than the leaves. We have found that the choice α = 0.5 works well in practice. Note that this strategy is a smoothing strategy which recursively interpolates counts of species which are similar according to the taxonomy. The taxonomy is taken from SWISS-PROT.
Databases
The protein database used is SWISS-PROT40 + TrEMBL18. Release 7.7 of the Pfam database was used both for training the model and for searching against the protein database. Release 7.7 contains 4,832 families, with matches to 74% proteins in SWISS-PROT40/TrEMBL18, and sequence coverage of 53%.
For the SCOP test, we used SCOP release 1.63 and the test set consisted of proteins from ASTRAL release 1.63 filtered to 40% identity, which consisted of 5226 proteins.
Authors' contributions
LC developed and implemented the algorithm, ran the Pfam scan and benchmarking tests and principally wrote the paper. AGB and RD provided oversight and guidance. All authors have read and approved the manuscript.
Acknowledgments
Acknowledgments
The Wellcome Trust Sanger Institute is supported by the Wellcome Trust. LC holds a Leslie Wilson Scholarship from Magdelene College Cambridge and a Cambridge Australia Trust studentship.
Contributor Information
Lachlan Coin, Email: lc1@sanger.ac.uk.
Alex Bateman, Email: agb@sanger.ac.uk.
Richard Durbin, Email: rd@sanger.ac.uk.
References
- Krogh A., Brown M., Mian I. S., Sjölander K., Haussler D. Hidden Markov models in computational biology: applications to protein modeling. J Mol Biol. 1994;235:1501–1531. doi: 10.1006/jmbi.1994.1104. [DOI] [PubMed] [Google Scholar]
- Durbin R., Eddy S., Krogh A., Mitchison G. Biological Sequence Analysis: Probabilistic Models of Proteins and Nucleic Acids. Cambridge, UK: Cambridge University Press; 1998. [Google Scholar]
- Bateman A., Coin L., Durbin R., Finn R. D., Hollich V., Griffiths Jones S., Khanna A., Marshall M., Moxon S., Sonnhammer E. L., Studholme D. J., Yeats C., Eddy S. R. The Pfam protein families database. Nucl Acids Res. 2004;32:D138–D141. doi: 10.1093/nar/gkh121. [DOI] [PMC free article] [PubMed] [Google Scholar]
- Park J., Karplus K., Barrett C., Hughey R., Haussler D., Hubbard T., Chothia C. Sequence comparisons using multiple sequences detect three times as many remote homologues as pairwise methods. J Mol Biol. 1998;284:1201–1210. doi: 10.1006/jmbi.1998.2221. [DOI] [PubMed] [Google Scholar]
- Coin L., Bateman A., Durbin R. Enhanced protein domain discovery by using language modeling techniques from speech recognition. Proc Natl Acad Sci USA. 2003;100:4516–4520. doi: 10.1073/pnas.0737502100. [DOI] [PMC free article] [PubMed] [Google Scholar]
- Eddy S. R. Profile-hidden Markov models. Bioinformatics. 1998;14:755–763. doi: 10.1093/bioinformatics/14.9.755. [DOI] [PubMed] [Google Scholar]
- Hubbard T. J. P., Murzin A, Brenner S, Chotia C. SCOP: a structural classification of proteins database. Nucl Acids Res. 1997;25:236–239. doi: 10.1093/nar/25.1.236. [DOI] [PMC free article] [PubMed] [Google Scholar]
- Chandonia J. M., Walker N. S., Conte LL, Koehl P., Levitt M., Brenner S. E. ASTRAL compendium enhancements. Nucl Acids Res. 2002;30:260–263. doi: 10.1093/nar/30.1.260. [DOI] [PMC free article] [PubMed] [Google Scholar]
- Lavaissiere L., Jia S., Nishiyama M., Monte S., Stern A. M., Wands J. R., Friedman P. A. J Clin Invest. Vol. 98. Molecular Hepatology Laboratory, Massachusetts General Hospital Cancer Center, Charlestown 02129, USA.; 1996. Overexpression of human aspartyl(asparaginyl)beta-hydroxylase in hepatocellular carcinoma and cholangiocarcinoma. pp. 1313–1323. [DOI] [PMC free article] [PubMed] [Google Scholar]
- Das A. K., Cohen P. W., Barford D. The structure of the tetratricopeptide repeats of protein phosphatase 5: implications for TPR-mediated protein-protein interactions. EMBO J. 1998;17:1192–1199. doi: 10.1093/emboj/17.5.1192. [DOI] [PMC free article] [PubMed] [Google Scholar]
- Salzet M., Chopin V., Baert J., Matias I., Malecha J. Theromin, a novel leech thrombin inhibitor. J Biol Chem. 2000;275:30774–30780. doi: 10.1074/jbc.M000787200. [DOI] [PubMed] [Google Scholar]
- Scaloni A., Bottiglieri C., Ferrara L., Corona M., Gurrola G. B., Batista C., Wanke E., Possani L. D. Disulfide bridges of ergtoxin, a member of a new sub-family of peptide blockers of the ether-a-go-go-related K+ channel. FEBS Lett. 2000;479:156–157. doi: 10.1016/S0014-5793(00)01891-3. [DOI] [PubMed] [Google Scholar]
- Swanson W. J., Vacquier V. D. Extraordinary divergence and positive Darwinian selection in a fusagenic protein coating the acrosomal process of abalone spermatozoa. Proc Natl Acad Sci USA. 1995;92:4957–4961. doi: 10.1073/pnas.92.11.4957. [DOI] [PMC free article] [PubMed] [Google Scholar]
- Altschul S. F., Madden T. L., Schaffer A. A., Zhang J., Zhang Z., Miller W., Lipman D. J. Gapped BLAST and PSI-BLAST: a new generation of protein database search programs. Nucl Acids Res. 1997;25:3389–3402. doi: 10.1093/nar/25.17.3389. [DOI] [PMC free article] [PubMed] [Google Scholar]


