

Abstract
The evolution of neural activity during a perceptual decision is well characterized by the evidence parameter in sequential sampling models. However, it is not known whether accumulating signals in human neuroimaging are related to the integration of evidence. Our aim was to determine whether activity accumulates in a non-perceptual task by identifying brain regions tracking the strength of probabilistic evidence. Functional magnetic resonance imaging was used to measure whole-brain activity as choices were informed by integrating a series of learned prior probabilities. Subjects first learned the predictive relationship between a set of shape stimuli and one of two choices. During scanned testing, they made binary choices informed by the sum of the predictive strengths of individual shapes. Sequences of shapes adhered to three distinct rates of evidence (RoE), rapid, gradual, and switch. We predicted that activity in regions informing the decision would modulate as a function of RoE prior to the choice. Activity in some regions, including premotor areas, changed as a function of RoE and response hand, indicating a role in forming an intention to respond. Regions in occipital, temporal, and parietal lobes modulated as a function of RoE only, suggesting a pre-response stage of evidence processing. In all of these regions, activity was greatest on rapid trials and least on switch trials, which is consistent with an accumulation-to-boundary account. In contrast, activity in a set of frontal and parietal regions was greatest on switch and least on rapid trials, which is consistent with an effort or time-on-task account.
Keywords: categorization, probability, decision-making, fMRI, evidence accumulation
The time course of neural activity during sensory decisions has been well described by sequential sampling models (Audley & Pike, 1965; Cisek, Puskas, & El-Murr, 2009; Link & Heath, 1975; Ratcliff, 1978; Usher & McClelland, 2001). In this class of models, momentary bits of sensory information furnish evidence for or against available options, and a choice made when the accumulated evidence sufficiently favors one option over another. For example, in monkeys the rate of change in neuronal activity leading up to a choice adheres to a diffusion process in which an evidence variable changes in value over time until it surpasses a threshold value (Glimcher, 2003; Hanes & Schall, 1996; Ratcliff, Hasegawa, Hasegawa, Smith, & Segraves, 2007; Roitman & Shadlen, 2002). This process, which may represent an integration-to-bound mechanism, has been observed in multiple areas of the non-human primate brain, including the lateral intraparietal area (Shadlen & Newsome, 2001), frontal eye fields (Hanes & Schall, 1996), somatosensory cortex (Romo & Salinas, 2003), and superior colliculus (Ratcliff et al., 2007).
Changes in accumulating neuronal activity have been found to reflect the integration of probabilistic evidence across sequences of stimuli. Yang and Shadlen (2007) used a variant of the weather prediction task (Knowlton, Squire, & Gluck, 1994) in which monkeys first learned a set of stimulus-response associations that were made to vary in predictive strength by manipulating reinforcement probabilities during training. At test, monkeys watched as four of the learned stimuli were presented sequentially, and then made a response to indicate the choice favored by the sum of probabilistic evidence. During the presentation of shapes, the spiking rate of neurons in area LIP reflected the cumulative log likelihood ratio of evidence favoring one choice over the other, indicating that LIP neurons integrate evidence informing the monkeys' decisions. Comparable research in humans has identified accumulating functional magnetic resonance imaging (fMRI) activity in the parietal lobes and other brain regions during perceptual (James & Gauthier, 2006; Kayser, Buchsbaum, Erickson, & D'Esposito, 2010; Nosofsky, Little, & James, 2012; Ploran et al., 2007; Ploran, Tremel, Nelson, & Wheeler, 2011; Tosoni, Galati, Romani, & Corbetta, 2008; Wheeler, Petersen, Nelson, Ploran, & Velanova, 2008) and value-based (Gluth, Rieskamp, & Buchel, 2012) decisions. While the fMRI results are in general accord with an accumulation-to-boundary account, it is not clear whether the fMRI activity is directly related to the accumulation of task-relevant evidence. The imaging studies have used a relatively limited set of tasks and the low temporal resolution of fMRI makes it difficult to firmly relate ongoing cognitive operations with the amount of activation measured at a given moment in time. Furthermore, the presence of accumulating neural signals may be present in certain task configurations, such as when it is possible to form a concrete motor plan during evidence sampling (J. I. Gold & Shadlen, 2003). Thus, to establish a clear relationship it is necessary to use converging operations across tasks and cognitive domains.
The aim of the current study was to determine whether the integration of probabilistic evidence in a binary categorization task modulates human brain activity prior to choice. In a modification of Yang and Shadlen's categorization task (2007), subjects first learned a set of stimulus-response associations with a range of associative strength from strong to weak, and were then scanned using fMRI while they made a binary choice following the sequential presentation of four of the stimuli. Critically, the rate of evidence (RoE) toward a given choice was manipulated so that, as more shapes were presented, evidence favoring the choice grew rapidly, gradually, or switched after first favoring the other choice. Based on the findings of Yang and Shadlen (2007), and fMRI studies of perceptual decision-making (Carlson, Grol, & Verstraten, 2006; James, Humphrey, Gati, Menon, & Goodale, 2000; Kayser et al., 2010; Ploran et al., 2007; Ploran et al., 2011; Tosoni et al., 2008), we predicted that activity in regions most sensitive to the impending choice would increase more rapidly on Rapid than Gradual than Switch trials, adhering to the rate of evidence. This outcome would provide additional support for an accumulation account of neural function during human decision-making.
Methods
Subjects
Twenty-eight right-handed subjects were recruited to participate in the study. Eight subjects were excluded from behavioral and imaging analyses. One subject did not complete the pre-scan training protocol, two were trained but not scanned due to a technical problem with the projector, and five were discarded due to excessive movement. The remaining subjects (12 female) ranged in age from 18 to 32 years (mean = 23.72). Informed consent was obtained in a manner approved by the Institutional Review Board of the University of Pittsburgh. Participants received $25/hr.
Procedures
Training
Stimuli consisted of six line-drawn figures (shapes) of simple objects (e.g., Fig. 1a). During two days of training, the strength of association between each of the six shapes and left (L) or right (R) hand response options was learned by trial-and-error, with positive and negative feedback guiding learning. Positive feedback consisted of a purring sound accompanied by visual presentation of the text “correct”, centered on screen. Negative feedback consisted of a mildly unpleasant hammer on metal sound accompanied by the text “incorrect”. Note that the term “true accuracy” refers to the proportion of correct choices, regardless of feedback. During training, subjects were presented one shape at a time centered on the display and responded L or R. The display was replaced with a feedback display for 1.5 sec after the response.
Figure 1.
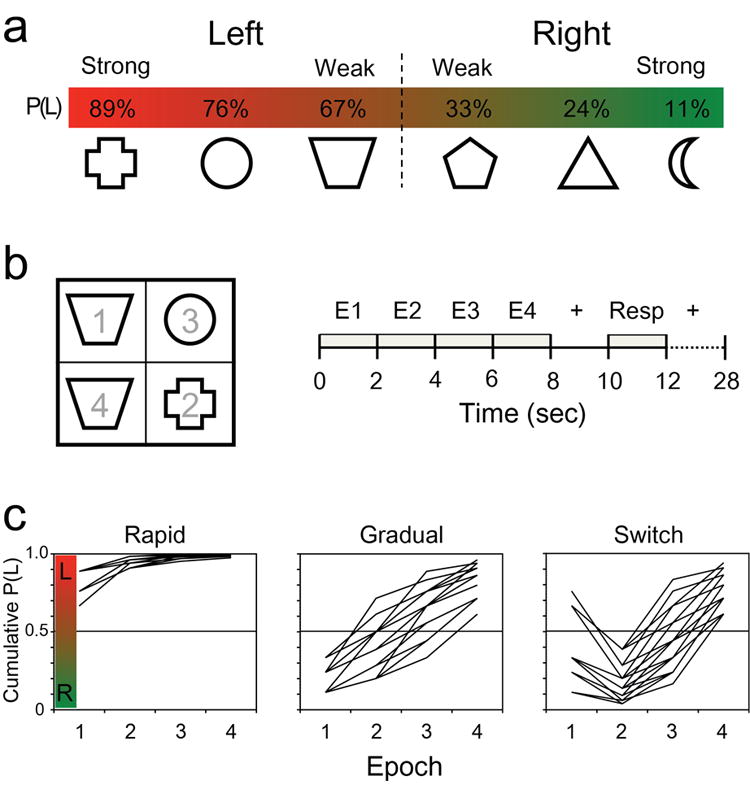
a) Training session. Six shapes were associated to varying degrees with Left (red) and Right (green) hand button presses through trial-and-error learning. Reward percent relative to an “L” response is noted above each shape. b) Test design. A sequence of four stimuli was displayed at the center of the screen in four quadrants, with random placement from trial to trial (left panel). The numbers illustrate one possible sequence of stimulus placement. A new stimulus appeared every 2 sec in four epochs (E1-E4), beginning with trial onset at 0 sec (right panel). Responses were withheld until the response window (Resp), after which there were sixteen seconds of fixation, followed by a variable inter-trial interval. c) Rates of evidence. The cumulative probability of a Left hand response being rewarded, P(L), is plotted across the four trial epochs for each of the three RoE conditions. Each trial (N = 20 for each RoE condition) has a unique path, or rate of evidence, as indicated by the plotted vectors. Vectors for P(R) are not shown.
Three of the shapes favored an L response, and three favored an R response. The strength of association was varied across the three shapes for each hand by variably reinforcing the stimulus-response mapping at 89%, 76%, and 67% probability of positive feedback (Fig. 1). For example, the plus outline shape (Fig. 1a) was associated with positive/negative feedback on 89/11% of L choices and 11/89% of R choices, and the trapezoid 67/33% of L choices and 33/67% of R choices. Subjects were instructed simply to make an L or R choice for each shape in order to minimize negative feedback.
Training occurred in stages. The two highest probability shapes for each hand were learned to criterion in the first stage, the next two in the second stage, and the final two in the third stage. Progression to the next stage occurred when an 80% blockwise true accuracy rate was achieved, with 200 trials per block in the first stage, 300 per block in the second stage, and 400/block trials in the final stage of training. Stages were repeated, if necessary, until criterion for that stage was reached. Unlike the standard weather prediction task format, shapes were presented individually in random order. Previously learned shapes were included in subsequent training stages to reinforce associative strength. The training parameters were established via pilot testing to achieve reasonably accurate test performance.
Probabilistic Reasoning Test
During the scanned test, subjects saw a sequence of four individual shapes presented over 8 sec in a 2×2 grid centered on the screen (Fig. 1b). Their task was to respond R or L based on the aggregate of the four probabilities. The first shape appeared at time 0 sec and each new shape appeared 2 sec later, in a new epoch coinciding with the onset of a new whole-brain fMRI measure. Stimuli remained on the screen throughout the trial after they appeared. Quadrant placement was determined randomly, without replacement. Two seconds of fixation followed the fourth epoch, after which subjects had a 2 sec response window in which they made an L or R response to indicate the choice favored by the combined probabilities. The response window occurred from 10-12 sec following trial onset (Fig. 1b). Sixteen seconds of central fixation followed the response window to allow the blood-oxygen-level-dependent (BOLD) response to return to baseline. In total, each trial lasted 30s. Trial onsets were jittered in time to ensure clean separation of signal between trials. Because our primary interest was in evaluating the shape of the evolving BOLD response as probabilistic evidence accrued over time, the within-trial event onsets (i.e., epochs and response period) were not jittered in time. On each trial, feedback was determined by the aggregate of probabilities and the R/L choice. The scanned test included 120 trials. A widely spaced design was used to obtain a measure of the hemodynamic response for each trial. Thus, trials could be combined as needed or analyzed separately.
The four shape sequences during the scanned test were configured to follow three general “rates” of evidence (RoE) so that 60 eventually favored an L choice and 60 favored an R choice. For each choice, the cumulative rate of evidence rapidly favored that choice (n = 20), gradually favored that choice after initially favoring the other choice (n = 20), and switched from first strongly favoring one to eventually favoring the other (n = 20). Another way to define these three conditions is by when a switch occurred. In the Rapid condition, evidence only favored one choice and never switched. In the Gradual condition, the switch from one choice to another occurred relatively early in the trial, between epochs 2 and 3. In the Switch condition, the switch occurred later in the trial, between epochs 3 and 4. Figure 1b depicts a Rapid trial in which the evidence for all four shapes favors a Left hand response. Examples of the cumulative probabilities for individual trials in the rapid, gradual, and switch conditions favoring L are depicted in Fig. 1c (left, middle and right panels, respectively). In Fig. 1c, the cumulative probability of evidence favoring a Left response (P(L)) is plotted as a function of epoch. Values above 0.5 favor a Left response, while values below 0.5 favor a Right response. Note that a given shape could appear a maximum of three times during a trial.
For some analyses, shape probabilities were converted into weights of evidence (WoE) representing the log likelihood that a given shape s predicted an L choice (P(L)). The weights corresponding with the probability of a left reward (P(L)) of 0.89, 0.76, 0.67, 0.33, 0.24, and 0.11 were {w1, w2, …, w6} = {+0.9, +0.5, +0.3, -0.3, -0.5, -0.9}. Note that the trained reinforcement probabilities were selected a priori to yield this set of weights. A variant of Equation 2 from Yang and Shadlen (2007) was used to calculate the training reinforcement rates P(L) and P(R) for each shape: P(L|s) = 10w/1 + 10w, and P(R|s) = 1 – P(L|s) where L and R are Left and Right responses, P(L|s) is the probability of a reward for a Left response to a given shape s, and w is the pre-designated weight for that shape. Cumulative probabilities during the test were computed using a more general form of the equation (Yang and Shadlen, 2007; Equation 2), reproduced in the Supplementary Materials. Table 1 lists three sample trials, including the sequence of shapes in Epochs 1-4, P(L), cumulative P(L), WoE and cumulative WoE. On each of the 120 trials, the RoE was drawn randomly from the pool of stimuli. This approach produced three evidence conditions (rapid, gradual, switch) for each choice (L, R), resulting in six total RoE conditions.
Table 1. Three sample scanned-test trials in which evidence favors a Left response by trial end.
| Epoch 1 | Epoch 2 | Epoch 3 | Epoch 4 | |
|---|---|---|---|---|
| Rapid Left |

|

|

|

|
| P(L) | .67 | .89 | .76 | .67 |
| Cumulative P(L) | .67 | .94 | .98 | .99 |
| WoE | +.30 | +.90 | +.50 | +.30 |
| Cumulative WoE | +.30 | +1.20 | +1.70 | +2.00 |
| Gradual Left |

|

|

|

|
| P(L) | .24 | .76 | .76 | .76 |
| Cumulative P(L) | .24 | .50 | .76 | .91 |
| WoE | -.50 | +.50 | +.50 | +.50 |
| Cumulative WoE | -.50 | 0.00 | +.50 | +1.00 |
| Switch Left |

|

|

|

|
| P(L) | .33 | .24 | .89 | .89 |
| Cumulative P(L) | .33 | .14 | .56 | .91 |
| WoE | -.30 | -.50 | +.90 | +.90 |
| Cumulative WoE | -.30 | -.80 | +.10 | +1.00 |
Notes: P(L) = probability of a left response being rewarded during training; WoE = weight of evidence. ΣWoE is the sum of the four weights, +2.00 for Rapid Left, +1.00 for Gradual Left, and +1.00 for Switch Left.
Image Acquisition
Imaging was conducted using a Siemens Allegra 3-Tesla scanner. The paradigm was presented using E-Prime (Psychology Software Tools, Inc., Pittsburgh, PA) on a PC computer. Stimuli were projected onto a screen at the head of the magnet bore using a Sharp PG-M20X digital multimedia projector. Subjects viewed the stimuli through a mirror attached to the head coil. Earplugs were worn to reduce scanner noise. R and L index finger responses were made using two fiber optic glove response pads (one for each hand). Response pads were connected to the desktop computer, which recorded response data.
Anatomic images were obtained using a high signal-to-noise, magnetization-prepared rapid-acquisition gradient echo (MP-RAGE) sequence (repetition time [TR] = 1540 msec, echo time [TE] = 3.04 msec, flip angle [FA] = 8º, inversion time [TI] = 800 ms). BOLD-sensitive functional images were acquired during performance of the task using a whole-brain spin-echo echo-planar T2*-weighted series (TR = 2000 msec, TE = 30 msec, FA = 79º, Field of View = 200mm, 3.2 × 3.2 mm in-plane resolution with 3.2 mm slice thickness, 38 slices). The first three image acquisitions of each of six functional runs were discarded to allow net magnetization to reach steady state.
Imaging Analysis
Imaging data from each subject were preprocessed to remove noise and artifacts and compute atlas transformation parameters. Motion was corrected across and within runs using a rigid-body rotation and translational algorithm (Snyder, 1996). Whole-brain functional data were then normalized to a mode of 1000 to facilitate inter-subject comparisons. To account for differences in slice acquisition times within each TR, slices were realigned to the temporal midpoint of the first slice using sinc interpolation.
After preprocessing, BOLD data were resampled into 2 mm isotropic voxels and transformed into Talairach 1988 atlas space by aligning the T1-weighted image to an atlas-transformed target T1-weighted template using a series of affine transformations (Lancaster et al., 1995; Michelon, Snyder, Buckner, McAvoy, & Zacks, 2003; Talairach & Tournoux, 1988). After subject data were in a common space, functional data were analyzed on a voxel-by-voxel basis using a general linear model (GLM) approach (Friston, Jezzard, & Turner, 1994; Miezin, Maccotta, Ollinger, Petersen, & Buckner, 2000; Ollinger, Shulman, & Corbetta, 2001). Two GLMs were created for each subject, one to investigate the effect of RoE on evolving BOLD activity and the other to investigate single trial effects.
In the first GLM, BOLD data at each time point (i.e., each whole brain acquisition) and for each run were modeled as the sum of modeled events and unexplained error. Twelve trial-level regressors were coded into each model according to response hand (L or R), rate of evidence (rapid, gradual, switch), and accuracy (correct, incorrect). Correct and incorrect trials were those receiving positive and negative feedback, respectively. Each trial was modeled over 30s (16 time points) from trial onset. Within each run, signal drift was modeled using a linear trend parameter, while baseline signal was modeled by a constant term. One series of 16 delta functions described each of the six event-related terms as a time series of the percent BOLD signal change relative to the constant term. It is important to note that because this approach makes no assumptions about the shape of the BOLD response, resulting model estimates are not biased by a priori expectations. The approach does assume that overlapping BOLD-related activity from adjacent trials sums linearly at each time point. It also assumes that the BOLD responses for all trials of a given condition are identical. Software developed at Washington University (FIDL) was used for image processing and analyses (Ollinger et al., 2001).
In the second GLM, only trend and constant terms were modeled. Trial level effects were thus treated as part of the residual error. To analyze trial level data, the residuals were extracted to yield a time series of data points expressed as a percent signal change from the constant term. As in the first GLM, the BOLD response for each trial was defined as evolving over 30 sec (16 time points) from trial onset.
Group level imaging analyses used trial level estimates from each subject's GLM in various ANOVA models, with subject treated as a random factor and time point as a repeated measure. This analysis produces a different image for each term in the ANOVA model. Uncorrected z-transformed F-statistical images from the ANOVA were smoothed using a 4mm full-width at half maximum Gaussian filter. Each statistical image was then corrected for sphericity and for multiple comparisons based on false positive rates determined by Monte Carlo simulation with a threshold of z = 3.0 and 45 contiguous voxels, resulting in a cluster-wise p < .05. While trial level events were modeled over 16 time points, a priori defined group analyses focused on a subset of time points within the modeled time series. Specific aspects of group analysis models are described in more detail in the Results section.
To define regions of interest, uncorrected images were smoothed again using a 4-mm hard sphere kernel. Voxels of peak activity were then identified using an automated algorithm. Peak voxels that were separated by less than 10mm were consolidated by averaging their xyz-coordinates. Regions were grown around each peak by including all contiguous voxels within 10mm radius so that a given voxel could be assigned to a maximum of one region. Voxels failing sphericity and Monte Carlo corrections were then removed from the ROIs.
Results
Performance
Overall, true accuracy was high (92.4% correct), but decreased across levels of RoE, from Rapid to Gradual to Switch (Table 2). The effects of RoE and response hand on accuracy were tested by entering the percent correct data for each subject into a 3 (Rapid, Gradual, Switch) x 2 (L, R) ANOVA. This analysis produced significant main effects of RoE (F[2, 19] = 29.40, p < .0001) and Response Hand (F[1, 19] = 7.42, p < .01), and a significant interaction (F[2, 19] = 3.10, p < .05). Thus, accuracy decreased reliably across levels of RoE, and was higher for L than R responses. Furthermore, the L>R effect was most pronounced in the Switch condition.
Table 2. Behavioral Performance: Percent correct on probabilistic reasoning task.
| Rate of Evidence | ||||
|---|---|---|---|---|
| Rapid | Gradual | Switch | ||
| Left | 99.2 | 96.0 | 88.6 | |
| Hand | (0.5) | (1.7) | (2.4) | |
| Right | 97.3 | 94.7 | 78.1 | |
| (1.0) | (2.0) | (3.9) | ||
Notes. Standard error of the mean noted in parentheses.
The behavioral data were then analyzed to evaluate the relationship between the sum of evidence and choice accuracy. The four weights from each trial were entered into a series of logistic regression analyses, calculated separately for each subject, and other supporting analyses as noted below. To assess the relationship between choice behavior and P(L), trials were divided into 10 bins according to the sum of weights of evidence (ΣWoE) from all four epochs. Rate of evidence (RoE) refers to the vector of four weights presented on each trial, whereas ΣWoE refers to the arithmetic sum of the four weights. For example, a sequence of four stimuli reinforced at P(L) = 0.89, 0.89, 0.67, and 0.67 during training can be represented by the RoE vector of individual weights (+0.9, +0.9, +0.5, +0.5: Rapid Left). Summing the four weights yields ΣWoE = +2.8, strongly favoring an L response. The potential range of ΣWoE values was from +3.60 (favoring L) to -3.60 (favoring R). In Fig. 2a, the individual subject data are plotted as gray circles, one for each subject and for each ΣWoE bin. For this analysis, data were collapsed across the three RoE conditions. Note that there was some variance in binned weights across subjects (indicated by the distribution of subject level data points along the x-axis) resulting from the random selection of trial types (and thus ΣWoEs) from a larger pool of possible trials. The means of the binned ΣWoE are denoted by black circles. The dashed line indicates a sigmoidal fit. The sharp transition of the fit from L to R is indicative of overall high performance, supported by the accuracy analyses described earlier.
Figure 2.

a) Categorization performance across conditions. The probability of responding L is plotted across ten bins of ΣWoE. Individual subject means for each bin are plotted in gray, group means in black. A sigmoidal fit is indicated by the dashed curve. b) Effect of each shape on choice. Plotted are the results of a logistic regression assessing the relative weights between shapes, as expressed by L and R choices on the test. Logistic coefficients reflecting subject weight are plotted as a function of the trained weights. Individual subject data for each shape are plotted in gray, group means in black. c) Effect of each epoch on choice. Plotted are the results of a logistic regression assessing the relative impact of epoch on choice.
Next, we determined the extent to which the probabilities were subjectively internalized during learning, as expressed by choice accuracy during the test. It was possible that subjects would adopt a binary classification (i.e., rule-based) strategy for each shape or sequences of shapes (i.e., strict L or R, instead of weighted by reinforcement probability), or some other strategy that would decrease the need to integrate probabilistic information (Gluck, Shohamy, & Myers, 2002). Two analyses were conducted to test for this possibility. In the first, subjective weights were inferred for each shape using a logistic regression on all trials, including errors, to evaluate its influence on the choice (Yang & Shadlen, 2007, Equation 7). If subjects used a rule-based strategy such as counting shapes, then the subjective weights would not vary according to trained weights. This analysis was conducted separately for each subject and produced fit values that varied substantially across subjects. However, in most subjects the relative relationship between subjective and trained weights was similar. Numerical differences between subjects were eliminated by expressing each subject's logistic parameter as a deviation from the absolute within-subject mean. This procedure preserved the relative pattern of data points within each subject. The transformed subjective weights from this analysis are plotted as a function of the six trained weights in Fig. 2b. Gray circles denote data for each shape from the individual subject analyses, and black circles denote the means. The linear trend across shapes indicates that subjective and trained weights were correlated, with the relationship lessened somewhat by the weakest R shape (weight = -0.3), likely reflecting a relative under-training of the weakest stimuli. The observation of an overall increasing linear pattern across weights was reinforced by a significant nonparametric Spearman's rank correlation (ρ = 0.86, p < .0001). A 2 × 3 factor ANOVA with subjective weight as the dependent measure, and factors of response hand (L, R) and trained WoE (.3, .5, .9), revealed significant main effects of hand (F[1,19] = 718.02, p. < .0001) and WoE (F[2, 19] = 11.88, p < .0001), as well as an interaction of hand x WoE (F[2,19] = 3.14, p < .05). Post-hoc Tukey HSD tests (p < .05) identified that the main effect of WoE was driven primarily by a difference between the strongest trained WoE (.9) and each of the other two WoE conditions (.5 and .3). The subjective weights did not vary reliably between the two weaker trained WoE conditions, indicating that these two weights had a similar effect on behavior. In the imaging analyses, we therefore examined the effect of both trained and subjective WoE.
The second subjective weight analysis focused on trials in which two of the shapes favored one choice and two shapes favored the other choice, and ΣWoE was not zero. If subjects adopted a simple Left/Right counting strategy, then the sum would be equal for the two choices, and performance at chance level, P(L) = 0.5. To test whether performance was greater than chance, accuracy on these trials was computed for each subject and entered into group level one-sample Student's T-tests, with subject treated as a random factor. Performance on trials in which ΣWoE favored L (81.1% correct; t(19) = 8.16, p < 0.001) and R (70.3% correct; t(19) = 3.14, p = 0.0027) responses deviated significantly from chance, indicating that the weights were subjectively internalized, though not perfectly.
Our next aim was to determine the degree of impact of each of the four epochs on choice outcome. This aim was particularly important because the shape in Epoch 4 of the scanned test favored the correct choice. The presence of this deterministic relationship was imposed by the nature of the RoEs selected for the study and the small set of stimuli. If subjects learned this relationship, then Epoch 4 would have a greater impact on choice than the other epochs, and the task could be successfully completed without the need to integrate probabilistic evidence during epochs 1-3. In post-scan debriefing, and in pilot testing, none of the subjects reported discovering this relationship. Nonetheless, we wanted to rule out the possibility objectively by testing for epoch-dependent effects on choice behavior. We therefore evaluated the impact of epoch on choice using logistic regression on individual subject data. The individual data are plotted by epoch in gray circles in Fig. 2c, along with the mean subjective weights (black circles). The mean data indicate that, on average, there was a similar degree of influence on choice outcome across epochs, with a slight increase in the contribution of, and greater variance in, epoch 3. The effect in epoch 3, however, was not significant at α = 0.05, as tested by a one-way ANOVA with four levels of epoch (F[3,19] = 2.50, p > .05).
Overall, the behavioral data indicate that performance increased as RoE increased, that the different weights of evidence were learned (though not perfectly) during training and influenced behavior on the test, and that subjects attended during all epochs at test.
Imaging Data
Conjunction Effects of Rate of Evidence and Response Hand
Our a priori hypothesis was based on observations that some brain regions demonstrate an evidence-dependent change in the rate of increasing activity from trial onset. In the current task, evidence could accrue toward two possible choices at different rates on different trials. To test for response-specific effects of evidence, we searched for regions in which pre-response activity modulated both as a function of the rate of evidence and the response hand. When precisely should this modulation in activity occur? We considered a number of factors. First, stimulus onset typically precedes onset of the hemodynamic response by 1-3 sec (Miezin et al., 2000). Second, evidence accrual begins after some nominal “non-decision” processing time related to task initiation and encoding of stimulus features (Ratcliff, Cherian, & Segraves, 2003). Third, in past studies we found that accumulation began at 2-4 sec from trial onset (Ploran et al., 2007; Ploran et al., 2011). Fourth, later time points could be contaminated by the response. Thus, we reasoned that RoE would begin to affect the hemodynamic response by ∼3-4 sec from trial onset, and emerge over at least the next five time points as evidence accrued. This timing corresponds with time points 3-7, or 4-12 sec, from trial onset, and precedes the response window. This relatively wide window should be resilient to variance in hemodynamic response properties such as time to onset and time to peak throughout the brain. To test the hypothesis, the time series data from each subject's GLM were entered into a 3 × 2 × 5 mixed effects repeated measures ANOVA, with three levels of RoE (Rapid, Gradual, Switch), two levels of response hand (L, R), and five levels of the repeated measure time (time points 3-7). Other time values were not tested. Subject was treated as a random factor. This analysis produced uncorrected and corrected (multiple comparisons corrected and sphericity adjusted, see Methods) F-to-Z transformed statistical maps for each term in the model, including a main effect of time, main effects of evidence and response hand, and interactions of evidence x time, hand x time, and evidence x hand x time. We note that there were no significant voxels in the corrected evidence x hand x time image, indicating that there were no mirror effects of evidence across the two hands in which the order of effect flipped from one hand to the other, as has been reported in some electrophysiological studies (Shadlen & Newsome, 2001).
Of first interest was whether there was both an interaction of evidence with time and an interaction of response hand with time. That is, was there an RoE effect at each level of the response hand condition? If so, then evidence would have a direct effect on motor planning or execution (Cisek & Kalaska, 2010). This conjunction of effects was not tested in the ANOVA model. Therefore, regions of interest were formed by identifying voxels showing both interaction effects at Z = 3.09 (p < .001), and defining ROI masks using the approach described in the Methods section. Voxels not surviving multiple comparisons and sphericity corrections were removed from ROIs. This procedure identified six ROIs (Table 3). The ROIs were located the inferior aspect of the right central sulcus, the insula near Brodmann area 13, and the medial frontal gyrus, in Brodmann area 6 (premotor). To evaluate the pattern of data across conditions, the full time series (the 16 time points modeled in the GLM) for each condition was extracted from each ROI. Figure 3 displays the ROIs on inflated cortical surfaces of the left and right hemispheres, along with the group mean time series data for each of the six conditions from three of the ROIs in 3a-c. The response (and feedback) window is demarcated by a gray rectangle. Note that the placement of the window on the x-axis is in real time relative to trial onset, and thus does not factor in the 1-3 sec lag in hemodynamic response. In most ROIs, such as right inferior postcentral gyrus (∼BA 40), left medial frontal gyrus (∼BA 6), and right insula (BA 13), the pre-response modulation by hand and RoE was quite evident upon visual inspection and persisted until at least the peak of the evoked response (Fig. 3a-c). In many of these regions, there was a clear difference related to both hand and RoE by 10 sec from trial onset. Notably, increases in activity in five out of the six regions, including those displayed in Fig. 3a-c, were preceded by decreased activity relative to baseline.
Table 3. Regions with conjunction of evidence x time and hand x time interactions.
| Sp. rho | |||||||||
|---|---|---|---|---|---|---|---|---|---|
|
|
|||||||||
| # | ∼Anatomic Location | Hem. | ∼BA | X | Y | Z | #vox | L | R |
| 1 | Inf Postcentral Gyrus (3a) | R | 40 | 56 | -31 | 24 | 167 | .28* | .31* |
| 2 | Med. Frontal Gyrus (3c) | L | 6 | -7 | -20 | 51 | 154 | .19 | .34* |
| 3 | Insula (3b) | R | 13 | 37 | -22 | 17 | 97 | .38* | .21 |
| 4 | Insula | R | 13 | 37 | -3 | 15 | 28 | .31* | .33* |
| 5 | Thalamus | R | NA | 14 | -22 | 11 | 53 | .03 | -.20 |
| 6 | Medial Frontal Gyrus | R | 6 | 1 | -18 | 53 | 22 | .23† | .31* |
|
| |||||||||
| 7 | Med. Frontal Gyrus (3d) | R | 6 | 7 | -20 | 51 | 154 | .27* | .43* |
Notes: Anatomic locations and Brodmann areas (BA) are approximate. XYZ = Talairach 1988 atlas coordinates of ROI peak voxel. # = Region number; #vox = number of voxels in ROI; Sp rho = Spearman's rank order correlation coefficient;
= p < .05;
= .05 < p < .10.
() = ROI time series data displayed in Fig. 3. Region #7 is the same as Region #2, but flipped into the right hemisphere for exploratory analysis. Post = posterior; Inf = inferior; D = dorsal; R = right; L = left; LR = bilateral; NA = not applicable.
Figure 3.
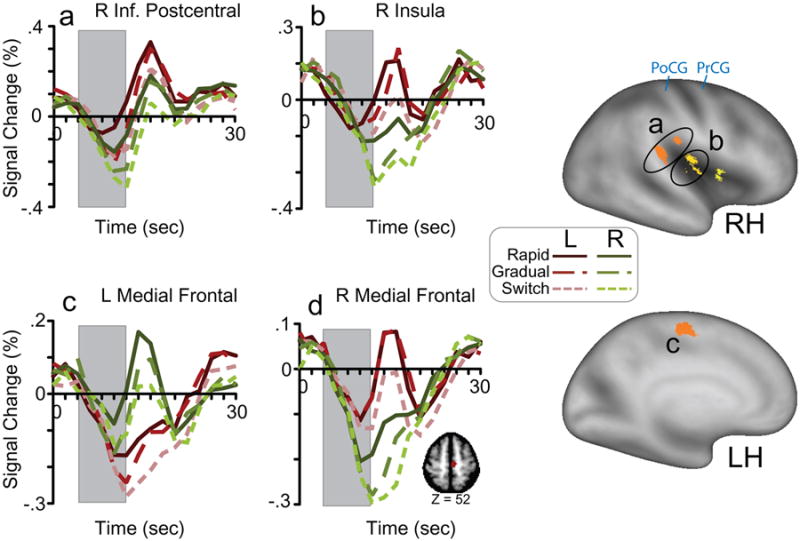
ROIs with a significant interaction of both Rate of Evidence x time and Response Hand x time over time points 3-7 (Table 3). On the right side, ROIs are projected onto lateral (top right) and medial (bottom right) inflated cortical surfaces using Caret software (Van Essen et al., 2001) and the PALS-B12 atlas (Van Essen, 2005). Different ROIs are indicated by different shades. Time series data from three of the ROIs are shown in a-c, beginning at trial onset (time 0 sec). Time points 3-7 are indicated by a gray rectangle. a) right inferior postcentral gyrus b) right posterior insula c) left medial frontal gyrus d) The right hemisphere homologue of the left medial frontal ROI. The inset shows the region at Talairach z-coordinate = 52. PrCG = precentral gyrus; PoCG = postcentral gyrus; L = left hand response; R = right hand response; RH = right hemisphere; LH = left hemisphere.
One interesting outcome from this analysis was the lack of a bilateral representation that would be expected in a task encouraging bimanual preparation. For example, the left medial frontal ROI near BA 6 is in putative premotor cortex, likely supplementary motor area (SMA), and was more active for contralateral (right) than ipsilateral (left) responses. The effect of hand and RoE in this region is thus potentially related to the preparation to make right-hand responses. What about the preparation to make a left-hand response? If function is related to motor planning, there should be a bilateral medial frontal representation. To test whether a similar effect occurred in the right hemisphere, a right homologue (Table 3, ROI #7) of the left medial frontal ROI was created by flipping the sign of the x-coordinate from negative to positive, and time series for the six RoE x Response Hand conditions were extracted from the ROI. As shown in Fig. 3d, the pattern of RoE effects in this ROI was quite similar to the left medial frontal ROI (Fig. 3c), but with the hand effects reversed (left > right).
Rate of Evidence
Because the RoE effects observed in the conjunction analysis may have been driven by response-independent processing at earlier, non-motor, stages of processing (J.I. Gold & Shadlen, 2007), we searched for such regions by looking for an interaction of evidence x time, but no effect of hand. Using procedures described in the methods, 72 regions of interest were defined from the evidence x time image from the ANOVA noted above. Of the 72 ROIs, there was a significant evidence x time interaction and a non-significant hand x time interaction in 61 regions. The 61 ROIs are displayed on an inflated cortical surface in Figure 4. Regions with a significant hand effect (R<>L) at timepoints 3-7 are noted in Tables 4 and 5. Signal change in some of the 61 ROIs changed at a rate that was most consistent with an information accumulation to boundary account, following the order Rapid > Gradual > Switch (abbreviated hereafter as ‘RGS’) percent signal change from the baseline term. Most ROIs showed the opposite pattern, Switch > Gradual > Rapid (SGR). In Figure 4, ROIs showing an RGS pattern (n = 16) are in green (Table 4) and ROIs showing an SGR pattern (n = 45) are in red (see Table 5 for a partial list of the most reliable ROIs).
Figure 4.

Lower left, ROIs showing a significant Rate of Evidence x time interaction over time points 3-7. Time series data from the three RoE conditions (collapsed across response hand) are plotted from five ROIs, including a) left superior temporal gyrus, b) left middle occipital gyrus, c) right middle occipital gyrus, d) right middle temporal gyrus, and e) left superior frontal gyrus (pre-supplementary motor area). L = left; pCG = precentral gyrus; MFG = middle frontal gyrus; MeFG = medial frontal gyrus; aI = anterior insula; Ins = insula; IPS = intraparietal sulcus; STG = superior temporal gyrus; MTG = middle temporal gyrus; mOcc = middle occipital; precun = precuneus; CN = caudate nucleus; Thal = thalamus; CalcS = calcarine sulcus.
Table 4. Regions with early Rapid > Gradual > Switch activity.
| # | ∼Anatomic Location | Hem. | ∼BA | X | Y | Z | #voxels | Hand |
|---|---|---|---|---|---|---|---|---|
| 13 | Sup. Temporal G. (4a) | L | 22 | -54 | -5 | 4 | 198 | ns |
| 16 | Inf. Parietal Lobule | R | 40 | 58 | -36 | 26 | 267 | ** |
| 17 | Sup. Temporal Gyrus | R | 22 | 59 | -42 | 6 | 169 | ns |
| 19 | Mid. Occipital G. (4c) | R | 19/37 | 50 | -66 | 8 | 141 | ns |
| 23 | Anterior Cingulate Cortex | R | 32 | 2 | 40 | -4 | 139 | ns |
| 25 | Insula | R | 13 | 35 | 1 | 16 | 77 | * |
| 30 | Sup. Temporal G. | R | 22 | 52 | 0 | 5 | 240 | ** |
| 32 | Sup. Temporal G. | L | 22 | -58 | -37 | 17 | 229 | ns |
| 35 | Mid. Temporal G. (4d) | R | 39 | 55 | -54 | 11 | 144 | ns |
| 38 | Paracentral Lobule | L | 31 | -5 | -18 | 43 | 182 | ns |
| 43 | Postcentral G. | L | 43 | -51 | -13 | 18 | 59 | ns |
| 47 | Mid. Occipital G. (4b) | L | 19/37 | -52 | -63 | 8 | 66 | ns |
| 52 | Insula | L | 13 | -37 | -4 | 15 | 78 | ns |
| 58 | Sup. Temporal G. | L | 21 | -51 | -6 | -8 | 65 | ns |
| 59 | Medial Frontal G. / SMA | L | 6 | -7 | -21 | 56 | 52 | * |
| 64 | Mid. Temporal G. | R | 22 | 47 | -43 | 7 | 76 | ns |
Notes: G = gyrus; Mid = middle; SMA = supplementary motor area. () = ROI time series data displayed in Fig. 4. Hand = results of t-test on Left and Right conditions on activity at timepoints 3-7:
= p < .001,
= p < .01, ns = not significant.
Table 5. Most reliable regions with early Switch > Rapid activity.
| # | ∼Anatomic Location | Hem. | ∼BA | X | Y | Z | #voxels | Hand |
|---|---|---|---|---|---|---|---|---|
| 1 | Sup. Frontal G. (4e) | L | 6 | -2 | 13 | 55 | 405 | ns |
| 2 | Sup. Frontal G. | L | 8 | -2 | 23 | 49 | 399 | ns |
| 3 | Insula | L | 13 | -31 | 21 | 3 | 230 | ns |
| 4 | Insula | R | 13 | 32 | 19 | 3 | 257 | ns |
| 5 | Precentral Gyrus | L | 6 | -48 | -2 | 38 | 307 | ns |
| 6 | Precuneus | L | 7 | -6 | -71 | 42 | 397 | ns |
| 7 | Caudate | L | NA | -10 | 0 | 13 | 239 | ns |
| 8 | Caudate | R | NA | 11 | 4 | 10 | 220 | ns |
| 9 | Thalamus | R | NA | -8 | -14 | 9 | 234 | ns |
| 10 | Precuneus | L | 7 | -28 | -73 | 40 | 332 | ns |
| 11 | Thalamus | R | NA | 10 | -16 | 11 | 234 | ns |
| 12 | Sup. Parietal Lobule | L | 7 | -31 | -65 | 50 | 186 | ns |
| 14 | Inf. Parietal Lobule | L | 40 | -40 | -52 | 43 | 316 | ns |
| 15 | Mid. Frontal G. | L | 9 | -48 | 18 | 34 | 168 | ns |
| 18 | Midbrain | L | NA | -6 | -24 | -8 | 196 | * |
| 20 | Mid. Frontal G. | L | 6 | -31 | -6 | 59 | 260 | ns |
| 21 | Mid. Frontal G. | R | 6 | 30 | -7 | 56 | 237 | * |
ROIs with an RGS pattern (and no effect of Hand) were found in and around the left and right Sylvian fissure, including ROIs near the superior and middle temporal gyri (BA 22, 39) and left insula (BA 13). Other regions included ventral ACC (BA 32), paracentral lobule (BA 31), and bilateral occipital/temporal cortex (BA 19/37). RoE time series data from four of these regions, collapsed across the non-significant response hand factor, are shown in Fig. 4a-d (Table 4, ROI#s 13, 47, 19, 35, respectively).
ROIs with an SGR pattern were found in bilateral superior (BA 6, 8) and middle (BA 6) frontal gyrus, insula (BA 13), caudate nucleus, thalamus, and large sections of the superior and inferior parietal lobes (BA 7, 40). Figure 4e displays a typical example of the SGR pattern, from an ROI on the medial wall of the frontal lobes, near the presupplementary motor area (Table 5, ROI #1). Notably, the pattern of pre-response activity in RGS regions was in opposition to the pattern we would expect if processing were related to ongoing difficulty or effort. An effort account is more consistent with the SGR ROIs in which activity was greater in magnitude and duration on Switch than Rapid trials (with Gradual often falling in between). By design, the Switch trials were more difficult than the Rapid trials.
Is ΣWoE related to peak activity?
As shown in Fig 3, RoE modulated activity prior to the response window. In some cases, the modulation persisted until activity returned to baseline. The largest modulation occurred when activity peaked, at approximately 16-18 seconds from trial onset. Because ΣWoE varied markedly in the Gradual and Switch RoE conditions, it is possible that some variance in peak signal change was due to ΣWoE. Note that ΣWoE was almost always near the maximum, ±3.6, in the Rapid condition (ΣWoE is proportional to cumulative P(L) in epoch 4 in Fig. 1C). We next tested whether trial-by-trial peak signal change in the seven regions listed in Table 3 was related to ΣWoE. This analysis was made possible by use of a widely spaced design in which single trial activity could be measured (see Methods). Peak signal change on each trial was computed by averaging across time points 8-9, corresponding with 16-18 sec after trial onset. Single trial time series data from one subject and one ROI (left medial frontal gyrus, ∼BA 6; Table 3, ROI #2) are displayed horizontally in the heat map in Fig. 5a. Time series are ordered by ΣWoE along the y-axis, with percent signal change indicated by color-code (see legend). The window used to estimate peak activity is encompassed by the rectangle. The heat map shows greater peak activity on R (ΣWoE < 0) than L (ΣWoE > 0) trials. However, the figure also shows that within each response hand condition, peak activity tended to increase as ΣWoE deviated from 0. This effect can be seen more clearly in Fig. 5b, which plots the peak signal estimate for each trial (same region, same subject) as a function of ΣWoE. A general upward trend was observed for both choices, R and L, as ΣWoE became more positive and more negative. To test the consistency of this effect across subjects and ROIs, trials were binned into six levels of ΣWoE for each subject (three levels for each response hand), and at the group level were entered into separate Spearman's rank order correlation analyses for each choice. Binned data from the same left medial frontal ROI are shown in Fig. 5c, and from the right inferior postcentral gyrus ROI (Table 3, ROI #1) in Fig. 5d. Peak activity in the flipped Medial Frontal Gyrus ROI in the right hemisphere (Table 3, ROI #7) also significantly correlated with ΣWoE. Of the seven RoE-sensitive ROIs listed in Table 3, six had at least one significant Spearman's rho, indicating a rank order relationship between peak activity and ΣWoE. Table 3 lists the Spearman rho p-values for each response hand condition for each ROI. Unlike the direction of effect in other ROIs, the correlation in right thalamus was negative, decreasing signal as ΣWoE increased.
Figure 5.

Trial-by-trial relationship between sum of weight of evidence (ΣWoE) and signal change in regions showing both an RoE x time and Response hand x time interaction. a) Time series data from one subject and one ROI (left medial frontal gyrus; Table 3, ROI #2) are plotted horizontally, sorted along the y-axis by ΣWoE. Each rectangular unit on the x-axis represents one time point from one trial. Each line represented the time series from one trial. Signal change at each time point is indicated by the color bar to the right (0 = GLM constant term). The rectangle indicates the time window used to compute peak signal change. b) Peak signal changes from a are plotted as a function of ΣWoE. Each data point represents a single trial. c) Same as b, but data are binned (see text) and plotted for each subject (gray data points), with the group mean indicated by black data points (* = Spearman's rho < .05). d) Same as c but for the left inferior postcentral ROI (Table 3, ROI #1).
Subjective Weight of Evidence
The behavior analyses revealed that learning of the weights was imperfect. The deviation of the subject weights from the trained weights (Fig. 2b) may affect the fMRI findings reported above, in which trials were sorted into conditions according to trained weights. To assess whether this was the case, all trials for each subject were recoded according to the subjective weights that were computed for that subject via logistic regression. After recoding, most trials for most subjects could be readily classified as rapid, gradual, or switch according to our original sorting protocol. However some subjects were missing a gradual type of trial, and their recoded trials could be classified as only rapid or switch. Therefore, all trials for all subjects were recoded as either rapid or non-rapid (i.e., non-rapid being a combination of switch for some subjects and switch and gradual for the remaining subjects) as determined by a hierarchical cluster analysis. The time series data in ROIs defined using the trained weights revealed no notable differences between the patterns of data observed using the trained and the subjective weights to categorize trials. For example, subjective weight time series data from the right inferior postcentral gyrus, right insula, and left medial frontal gyrus ROIs from Fig. 3a-c are displayed in Fig. 6a-c. As shown, RoE effects were also present in the subjective weight data. Furthermore, the general shape of the time series data are comparable between the two methods of stimulus coding, trained vs. subjective weights. Thus, we conclude that any departure of the subjective weights from the trained weights had little, if any, effect on the imaging results.
Figure 6.

Subjective-weighted time series data from the three ROIs depicted in 3a-c. a) right inferior postcentral gyrus b) right posterior insula c) left medial frontal gyrus. Non-R = non-rapid, referring to a combination of gradual and switch type trials. Other notations follow those in Fig. 3.
Discussion
Using a probabilistic reasoning task in which evidence favoring one of two possible choices accrued over time, we found hand-independent and hand-dependent regions that tracked the rate of evidence prior to choice behavior. Regions near the inferior central sulcus, insula, and the medial wall of the frontal lobes activated earlier when probabilistic evidence rapidly favored one choice over another than when evidence slowly favored one choice over another. In these regions, activity was influenced both by RoE and response hand prior to the choice response. The findings cannot be attributed to differences in the strength of visual input because sensory input on all trials was four shapes. The effects also cannot be attributed to the execution of motor behavior, or to the evaluation of feedback based on performance, because activity related to those events occurred later in the trial. The RoE-dependent effects appeared instead to be related to the formation of an intention for potential action based on the available evidence (e.g., Cisek & Kalaska, 2005).
In a separate analysis, we found that activity in regions near the occipital/temporal lobe junction and superior/middle temporal gyrus increased according to RoE (R > G > S)(and other regions, see Table 4), but not response hand. Pre-response activity in these regions was greatest on Rapid trials, when evidence favoring a choice accumulated rapidly, and least on Switch trials, when evidence favoring a choice occurred late in the trial. These regions may function as an intermediate stage of processing between bottom-up analysis of relevant information and later response planning. There is support for multiple stages of response in the literature. For example, Bernier and colleagues used a bimanual reaching-to-target task with fMRI and EEG (Bernier, Cieslak, & Grafton, 2012). Targets were to the left or right of midline, and subjects were instructed on each trial to reach to the target with either the left or right hand. The results support a two-stage process in which one set of frontal and parietal regions code the target independently of arm, and another set code the arm-specific motor intention after the reach instruction.
These analyses also revealed two distinct patterns of RoE modulation prior to the behavioral response window. The most common pattern was one in which signal change was greater on Switch than on Rapid trials, with activity on Gradual trials often intermediate (Table 5, Figure 4). This S > G > R pattern was found in MFG, medial frontal gyrus near the presupplementary motor area, anterior insula, IPS, caudate nucleus, and thalamus (among other regions), and is most consistent with an effort or time-on-task account. Indeed, the pattern is identical to the buildup of activity in visual cortex on 1-trial, 2-trial, and 3-trial sequences of flickering checkerboard stimuli reported by Dale and Buckner (1997; see Figure 4A) in their selective averaging experiment. It seems most likely that the operations performed by these regions were repeated, or continued, as long as uncertainty about the choice persisted. The findings are not consistent with an information accumulation account because signal change during timepoints 3-7 was greatest on the switch condition, in which evidence favoring one choice over the other was most ambiguous. The function of these regions may be to support task maintenance operations, such as attention, working memory, and mental calculation. Interestingly, the observation of accumulating activity has not been pervasive in the single unit physiology literature. For example, in a motion discrimination task Gold and Shadlen (2003) found accumulating signals in the frontal eye fields when saccade target locations were known during motion presentation, but not when target locations appeared after the motion stimulus. Bennur and Gold (2011) later found that accumulating activity in some LIP neurons but not others when target locations appeared after the motion stimulus. Thus, accumulation effects in frontal and parietal areas are not observed under all circumstances.
Regions showing the opposite, R > G > S, pattern independently of response hand (Table 4, Figure 4) were located primarily in the occipital and temporal lobes. The locations suggest a role in processing of visually- and semantically-relevant information. For example, the bilateral ROIs near the middle occipital/temporal border (BA 19/37) are near regions that have been preferentially activated for visual stimuli over other modalities (Lepage, McIntosh, & Tulving, 2001; Stevens, Skudlarski, Gatenby, & Gore, 2000). As indicated by visual inspection in Caret, and by comparison with published coordinates, the regions are lateral and anterior to putative motion-sensitive area MT (e.g., Shulman et al., 1999). They also do not appear to be located near regions typically associated with the default mode network, in which activity decreases during goal-directed behavior (Greicius, Krasnow, Reiss, & Menon, 2003; Raichle et al., 2001). Similar regions have been reported during visual observation of hand movements (Grosbras & Paus, 2006), and to evaluating the emotional aspects or the relevance of visually-presented stimuli such as body parts (hands, faces), photos, and concept words (Cunningham, Raye, & Johnson, 2004; Gorno-Tempini et al., 2001; Grosbras & Paus, 2006; Ochsner et al., 2004). The left anterior superior temporal and the right middle temporal ROIs have been associated with speech and language (Binder et al., 2000; Meyer, Alter, Friederici, Lohmann, & von Cramon, 2002). However, somewhat surprisingly, both regions have also been associated with the learning of reward contingencies (Hartstra, Oldenburg, Van Leijenhorst, Rombouts, & Crone, 2010; Knutson, Wimmer, Kuhnen, & Winkielman, 2008) and value inference (Hampton, Bossaerts, & O'Doherty, 2008; Knutson, Wimmer, Rick, et al., 2008) during decision-making tasks. These regions may have played a role in the value assessment of integrated probabilistic information.
Surprisingly, we did not find the predicted RoE-dependent accumulation effects prior to the response. The pattern of RoE-dependent activity observed here differed from the pattern reported in experiments using a gradual reveal paradigm (Carlson et al., 2006; James & Gauthier, 2006; James et al., 2000). For example, in past studies of object identification (Ploran et al., 2007; Ploran et al., 2011; Wheeler et al., 2008), objects were gradually revealed from under a mask and subjects made a recognition response when they were reasonably confident about the identity of the object. It was assumed that the timing of the recognition response, relative to trial onset, would reflect the degree of evidence influencing identification, and hypothesized a diffusion-like response that would be marked by an early onset of activity followed by an evidence-dependent change in BOLD activity, with a faster rate of change when object recognition was early and a slower rate when object recognition was late. This pattern of fMRI activity, observed in a number of frontal, parietal, and temporal regions in previous studies, is qualitatively consistent with evidence-dependent patterns observed at the neuronal level using single unit recordings in monkeys (Hanes & Schall, 1996; Shadlen & Newsome, 2001). In the current task, however, there was no sign of the accumulation pattern described above. Instead, activity typically decreased initially after trial onset before increasing as a function of RoE.
There are several potential explanations for this unusual finding. First, the probabilistic reasoning task likely required greater top-down, controlled, processing. In our object identification studies, objects were gradually revealed and subjects needed only to passively view the screen and wait for sufficient accumulated information before committing to a response. In the present task, subjects integrated and maintained probabilistic information over time, which required the completion of a sequence of mental computations. The persistent load on executive functions such as working memory and mental calculation may have masked bottom-up effects. Indeed it is for this reason that Ratcliff and others have argued that diffusion models apply to rapid decisions, typically under 1.0–1.5 sec, and single-stage decisions (Ratcliff & McKoon, 2008). Note however, that other models have successfully accounted for multiple stage decisions (Gluth et al., 2012; Lee & Cummins, 2004), and we have found that a variant of Ratcliff's diffusion model (Wiecki, Sofer, & Frank, 2013) fit perceptual discrimination data from 6-sec trials (Dunovan, Tremel, & Wheeler, 2014). A second explanation is that the need to withhold a response to the end of the trial affected the timing of activity. In our past studies subjects could commit to a decision at any time in the trial and respond at that point in time. However, in the current task the response was withheld until the response window. Withholding a response increases demands on working memory, which could introduce top-down modulation of the accumulation process. A third possibility is that the number and nature of choices influences strategy. The current task was a two-choice forced-decision task, whereas the prior object recognition study was more consistent with detection task. In the current task, competition between the two choices, perhaps a form of push-pull mechanism, may have influenced the shape of the time series profile. Indeed, the initial decrease in activity observed in many RoE-dependent regions (Figs. 3a-d, 4a-d) suggests the presence of competitive inhibition during the task, perhaps arising from contralateral homologous regions of motor cortex (Ferbert et al., 1992). At present, there is insufficient data to discriminate between these explanations.
Of final note, the data were not entirely consistent with those of Yang and Shadlen (2007). Specifically, we did not find parametric RoE effects tracking the strength of evidence (R > G > S) in the intraparietal sulcus, near the human LIP analogue. IPS regions instead were most active when RoE was most ambiguous (Fig. 4). While there were undoubtedly different outcomes due to differences in techniques and species, it is worthwhile discussing task differences that may have also contributed to the discrepant findings. Most notably, monkeys learned to associate each shape with a color target that could appear on either side of fixation at test, and indicated responses via saccade. In our task, a manual choice (L, R) was tightly coupled with each shape during training and reinforced during the task. Thus, key differences between tasks are the output modality (eye vs. hand) and foreknowledge of the stimulus-response mapping. Thus the evidence-dependent effects in the two studies may reflect task-specificity, occurring in the appropriate motor system (Bernier et al., 2012). For example, Gluth and colleagues (2012) used a stock-purchasing task in which evidence for or against the stock purchase accrued over time and found evidence-dependent effects in primary motor areas. Task differences may also explain why the IPS, which has been linked to evidence accumulation in other fMRI studies (Kayser et al., 2010; Ploran et al., 2007; Ploran et al., 2011; Tosoni et al., 2008), did not increase proportionally with the strength of evidence. An additional factor may be the degree to which intention can be represented peripherally in the form of muscle activity, and centrally in the form of neural activity (Decety, Jeannerod, Durozard, & Baverel, 1993; Jeannerod, 1995). Motor preparation has been shown to have small but reliable effects on muscle activity, as measured by electromyography (EMG), in the absence of a change in force (Duclos, Schmied, Burle, Burnet, & Rossi-Durand, 2008) and when the timing of the response is known ahead of time (as was the case in the present study). While it can be advantageous to establish a “motor set” (Strick, 1983) in anticipation of limb or trunk movement, doing so in the oculomotor system is less straightforward. Thus, it is possible that intention for action in the present task was less dependent on central operations because “evidence” could be represented, in part, peripherally in the form of muscle activity.
In summary, we found that the rate of probabilistic evidence toward a choice modulated the evolution of pre-response fMRI activity in hand-independent and hand-dependent regions of the brain. Contrary to our prediction, the temporal profile of activation in these regions was not as clearly consistent with an accumulation-to-boundary mechanism as in past studies, and may reflect competition between responses or a limitation on the measurement of accumulation effects using fMRI, among other possibilities.
Supplementary Material
Acknowledgments
This work was supported by the National Institute of Mental Health at the National Institutes of Health (R01-MH086492 to M.E.W.). The authors declare no competing financial interests. We thank Michael Shadlen and Steven Nelson for their thoughtful comments. Abraham Snyder and Mark McAvoy provided imaging analysis software and statistical support, and Max Novelli assisted with image processing and data management.
References
- Audley RJ, Pike AR. Some stochastic models of choice. British Journal of Mathematical and Statistical Psychology. 1965;18:183–192. [Google Scholar]
- Bennur S, Gold JI. Distinct representations of a perceptual decision and the associated oculomotor plan in the monkey lateral intraparietal area. Journal of Neuroscience. 2011;31(3):913–921. doi: 10.1523/JNEUROSCI.4417-10.2011. [DOI] [PMC free article] [PubMed] [Google Scholar]
- Bernier PM, Cieslak M, Grafton ST. Effector selection precedes reach planning in the dorsal parietofrontal cortex. Journal of Neurophysiology. 2012;108:57–68. doi: 10.1152/jn.00011.2012. [DOI] [PMC free article] [PubMed] [Google Scholar]
- Binder J, Frost J, Hammeke T, Bellgowan P, Springer J, Kaufman J, et al. Human temporal lobe activation by speech and nonspeech sounds. Cerebral Cortex. 2000;10:512–528. doi: 10.1093/cercor/10.5.512. [DOI] [PubMed] [Google Scholar]
- Carlson T, Grol AJ, Verstraten FA. Dynamics of visual recognition revealed by fMRI. Neuroimage. 2006;32(2):892–905. doi: 10.1016/j.neuroimage.2006.03.059. [DOI] [PubMed] [Google Scholar]
- Cisek P, Kalaska JF. Neural correlates of reaching decisions in dorsal premotor cortex: specification of multiple direction choices and final selection of action. Neuron. 2005;45(5):801–814. doi: 10.1016/j.neuron.2005.01.027. [DOI] [PubMed] [Google Scholar]
- Cisek P, Kalaska JF. Neural mechanisms for interacting with a world full of action choices. Annu Rev Neurosci. 2010;33:269–298. doi: 10.1146/annurev.neuro.051508.135409. [DOI] [PubMed] [Google Scholar]
- Cisek P, Puskas GA, El-Murr S. Decisions in changing conditions: the urgency-gating model. J Neurosci. 2009;29(37):11560–11571. doi: 10.1523/JNEUROSCI.1844-09.2009. [DOI] [PMC free article] [PubMed] [Google Scholar]
- Cunningham WA, Raye CL, Johnson MK. Implicit and explicit evaluation: FMRI correlates of valence, emotional intensity, and control in the processing of attitudes. J Cogn Neurosci. 2004;16(10):1717–1729. doi: 10.1162/0898929042947919. [DOI] [PubMed] [Google Scholar]
- Dale A, Buckner R. Selective averaging of rapidly presented individual trials using fMRI. Human Brain Mapping. 1997;5:329–340. doi: 10.1002/(SICI)1097-0193(1997)5:5<329::AID-HBM1>3.0.CO;2-5. [DOI] [PubMed] [Google Scholar]
- Decety J, Jeannerod M, Durozard D, Baverel G. Central activation of autonomic effectors during mental simulation of motor actions in man. J Physiol. 1993;461:549–563. doi: 10.1113/jphysiol.1993.sp019528. [DOI] [PMC free article] [PubMed] [Google Scholar]
- Duclos Y, Schmied A, Burle B, Burnet H, Rossi-Durand C. Anticipatory changes in human motoneuron discharge patterns during motor preparation. J Physiol. 2008;586(4):1017–1028. doi: 10.1113/jphysiol.2007.145318. [DOI] [PMC free article] [PubMed] [Google Scholar]
- Dunovan KE, Tremel JJ, Wheeler ME. Prior probability and feature predictability interactively bias perceptual decisions. Neuropsychologia. 2014;61:210–221. doi: 10.1016/j.neuropsychologia.2014.06.024. [DOI] [PMC free article] [PubMed] [Google Scholar]
- Ferbert A, Priori A, Rothwell JC, Day BL, Colebatch JG, Marsden CD. Interhemispheric inhibition of the human motor cortex. J Physiol. 1992;453:525–546. doi: 10.1113/jphysiol.1992.sp019243. [DOI] [PMC free article] [PubMed] [Google Scholar]
- Friston K, Jezzard P, Turner R. Analysis of functional MRI time-series. Human Brain Mapping. 1994;1:153–171. [Google Scholar]
- Glimcher PW. The neurobiology of visual-saccadic decision making. Annu Rev Neurosci. 2003;26:133–179. doi: 10.1146/annurev.neuro.26.010302.081134. [DOI] [PubMed] [Google Scholar]
- Gluck MA, Shohamy D, Myers C. How do people solve the “weather prediction” task?: individual variability in strategies for probabilistic category learning. Learn Mem. 2002;9(6):408–418. doi: 10.1101/lm.45202. [DOI] [PMC free article] [PubMed] [Google Scholar]
- Gluth S, Rieskamp J, Buchel C. Deciding when to decide: time-variant sequential sampling models explain the emergence of value-based decisions in the human brain. J Neurosci. 2012;32(31):10686–10698. doi: 10.1523/JNEUROSCI.0727-12.2012. [DOI] [PMC free article] [PubMed] [Google Scholar]
- Gold JI, Shadlen MN. The influence of behavioral context on the representation of a perceptual decision in developing oculomotor commands. Journal of Neuroscience. 2003;23(2):632–651. doi: 10.1523/JNEUROSCI.23-02-00632.2003. [DOI] [PMC free article] [PubMed] [Google Scholar]
- Gold JI, Shadlen MN. The neural basis of decision making. Annual Review of Neuroscience. 2007;30:535–574. doi: 10.1146/annurev.neuro.29.051605.113038. [DOI] [PubMed] [Google Scholar]
- Gorno-Tempini ML, Pradelli S, Serafini M, Pagnoni G, Baraldi P, Porro C, et al. Explicit and incidental facial expression processing: an fMRI study. Neuroimage. 2001;14(2):465–473. doi: 10.1006/nimg.2001.0811. [DOI] [PubMed] [Google Scholar]
- Greicius MD, Krasnow B, Reiss AL, Menon V. Functional connectivity in the resting brain: a network analysis of the default mode hypothesis. Proc Natl Acad Sci U S A. 2003;100(1):253–258. doi: 10.1073/pnas.0135058100. [DOI] [PMC free article] [PubMed] [Google Scholar]
- Grosbras MH, Paus T. Brain networks involved in viewing angry hands or faces. Cereb Cortex. 2006;16(8):1087–1096. doi: 10.1093/cercor/bhj050. [DOI] [PubMed] [Google Scholar]
- Hampton AN, Bossaerts P, O'Doherty JP. Neural correlates of mentalizing-related computations during strategic interactions in humans. Proc Natl Acad Sci U S A. 2008;105(18):6741–6746. doi: 10.1073/pnas.0711099105. [DOI] [PMC free article] [PubMed] [Google Scholar]
- Hanes DP, Schall JD. Neural control of voluntary movement initiation. Science. 1996;274(5286):427–430. doi: 10.1126/science.274.5286.427. [DOI] [PubMed] [Google Scholar]
- Hartstra E, Oldenburg JF, Van Leijenhorst L, Rombouts SA, Crone EA. Brain regions involved in the learning and application of reward rules in a two-deck gambling task. Neuropsychologia. 2010;48(5):1438–1446. doi: 10.1016/j.neuropsychologia.2010.01.012. [DOI] [PubMed] [Google Scholar]
- James TW, Gauthier I. Repetition-induced changes in BOLD response reflect accumulation of neural activity. Hum Brain Mapp. 2006;27(1):37–46. doi: 10.1002/hbm.20165. [DOI] [PMC free article] [PubMed] [Google Scholar]
- James TW, Humphrey GK, Gati JS, Menon RS, Goodale MA. The effects of visual object priming on brain activation before and after recognition. Current Biology. 2000;10(17):1017–1024. doi: 10.1016/s0960-9822(00)00655-2. [DOI] [PubMed] [Google Scholar]
- Jeannerod M. Mental imagery in the motor context. Neuropsychologia. 1995;33(11):1419–1432. doi: 10.1016/0028-3932(95)00073-c. [DOI] [PubMed] [Google Scholar]
- Kayser AS, Buchsbaum BR, Erickson DT, D'Esposito M. The functional anatomy of a perceptual decision in the human brain. J Neurophysiol. 2010;103(3):1179–1194. doi: 10.1152/jn.00364.2009. [DOI] [PMC free article] [PubMed] [Google Scholar]
- Knowlton BJ, Squire LR, Gluck MA. Probabilistic classification learning in amnesia. Learning & Memory. 1994;1:106–120. [PubMed] [Google Scholar]
- Knutson B, Wimmer GE, Kuhnen CM, Winkielman P. Nucleus accumbens activation mediates the influence of reward cues on financial risk taking. Neuroreport. 2008;19(5):509–513. doi: 10.1097/WNR.0b013e3282f85c01. [DOI] [PubMed] [Google Scholar]
- Knutson B, Wimmer GE, Rick S, Hollon NG, Prelec D, Loewenstein G. Neural antecedents of the endowment effect. Neuron. 2008;58(5):814–822. doi: 10.1016/j.neuron.2008.05.018. [DOI] [PubMed] [Google Scholar]
- Lancaster JL, Glass TG, Lankipalli BR, Downs H, Mayberg H, Fox PT. A modality-independent approach to spatial normalization of tomographic images of the human brain. Human Brain Mapping. 1995;3:209–223. [Google Scholar]
- Lee MD, Cummins TD. Evidence accumulation in decision making: unifying the “take the best” and the “rational” models. Psychon Bull Rev. 2004;11(2):343–352. doi: 10.3758/bf03196581. [DOI] [PubMed] [Google Scholar]
- Lepage M, McIntosh AR, Tulving E. Transperceptual encoding and retrieval processes in memory: a PET study of visual and haptic objects. Neuroimage. 2001;14(3):572–584. doi: 10.1006/nimg.2001.0866. [DOI] [PubMed] [Google Scholar]
- Link S, Heath R. A sequential theory of psychological discriminations. Psychometrika. 1975;40(1):77–105. [Google Scholar]
- Meyer M, Alter K, Friederici AD, Lohmann G, von Cramon DY. FMRI reveals brain regions mediating slow prosodic modulations in spoken sentences. Hum Brain Mapp. 2002;17(2):73–88. doi: 10.1002/hbm.10042. [DOI] [PMC free article] [PubMed] [Google Scholar]
- Michelon P, Snyder AZ, Buckner RL, McAvoy M, Zacks JM. Neural correlates of incongruous visual information. An event-related fMRI study. Neuroimage. 2003;19(4):1612–1626. doi: 10.1016/s1053-8119(03)00111-3. [DOI] [PubMed] [Google Scholar]
- Miezin F, Maccotta L, Ollinger J, Petersen S, Buckner R. Characterizing the hemodynamic response: Effects of presentation rate, sampling procedure, and the possibility of ordering brain activity based on relative timing. NeuroImage. 2000;11:735–759. doi: 10.1006/nimg.2000.0568. [DOI] [PubMed] [Google Scholar]
- Nosofsky RM, Little DR, James TW. Activation in the neural network responsible for categorization and recognition reflects parameter changes. Proc Natl Acad Sci U S A. 2012;109(1):333–338. doi: 10.1073/pnas.1111304109. [DOI] [PMC free article] [PubMed] [Google Scholar]
- Ochsner KN, Knierim K, Ludlow DH, Hanelin J, Ramachandran T, Glover G, et al. Reflecting upon feelings: an fMRI study of neural systems supporting the attribution of emotion to self and other. J Cogn Neurosci. 2004;16(10):1746–1772. doi: 10.1162/0898929042947829. [DOI] [PubMed] [Google Scholar]
- Ollinger JM, Shulman GL, Corbetta M. Separating processes within a trial in event-related functional MRI I. The method. Neuroimage. 2001;13(1):210–217. doi: 10.1006/nimg.2000.0710. [DOI] [PubMed] [Google Scholar]
- Ploran EJ, Nelson SM, Velanova K, Donaldson DI, Petersen SE, Wheeler ME. Evidence accumulation and the moment of recognition: dissociating perceptual recognition processes using fMRI. J Neurosci. 2007;27(44):11912–11924. doi: 10.1523/JNEUROSCI.3522-07.2007. [DOI] [PMC free article] [PubMed] [Google Scholar]
- Ploran EJ, Tremel JJ, Nelson SM, Wheeler ME. High quality but limited quantity perceptual evidence produces neural accumulation in frontal and parietal cortex. Cereb Cortex. 2011;21:2650–2662. doi: 10.1093/cercor/bhr055. [DOI] [PMC free article] [PubMed] [Google Scholar]
- Raichle ME, MacLeod AM, Snyder AZ, Powers WJ, Gusnard DA, Shulman GL. A default mode of brain function. Proceedings of the National Academy of Sciences of the United States of America. 2001;98:676–682. doi: 10.1073/pnas.98.2.676. [DOI] [PMC free article] [PubMed] [Google Scholar]
- Ratcliff R. A theory of memory retrieval. Psychological Review. 1978;85(2):59–108. [Google Scholar]
- Ratcliff R, Cherian A, Segraves M. A comparison of macaque behavior and superior colliculus neuronal activity to predictions from models of two-choice decisions. Journal of Neurophysiology. 2003;90(3):1392–1407. doi: 10.1152/jn.01049.2002. [DOI] [PubMed] [Google Scholar]
- Ratcliff R, Hasegawa YT, Hasegawa RP, Smith PL, Segraves MA. Dual diffusion model for single-cell recording data from the superior colliculus in a brightness-discrimination task. Journal of Neurophysiology. 2007;97(2):1756–1774. doi: 10.1152/jn.00393.2006. [DOI] [PMC free article] [PubMed] [Google Scholar]
- Ratcliff R, McKoon G. The diffusion decision model: theory and data for two-choice decision tasks. Neural Comput. 2008;20(4):873–922. doi: 10.1162/neco.2008.12-06-420. [DOI] [PMC free article] [PubMed] [Google Scholar]
- Roitman JD, Shadlen MN. Response of neurons in the lateral intraparietal area during a combined visual discrimination reaction time task. Journal of Neuroscience. 2002;22(21):9475–9489. doi: 10.1523/JNEUROSCI.22-21-09475.2002. [DOI] [PMC free article] [PubMed] [Google Scholar]
- Romo R, Salinas E. Flutter discrimination: neural codes, perception, memory and decision making. Nature Reviews Neuroscience. 2003;4(3):203–218. doi: 10.1038/nrn1058. [DOI] [PubMed] [Google Scholar]
- Shadlen MN, Newsome WT. Neural basis of a perceptual decision in the parietal cortex (area LIP) of the rhesus monkey. Journal of Neurophysiology. 2001;86(4):1916–1936. doi: 10.1152/jn.2001.86.4.1916. [DOI] [PubMed] [Google Scholar]
- Shulman GL, Ollinger JM, Akbudak E, Conturo TE, Snyder AZ, Petersen SE, et al. Areas involved in encoding and applying directional expectations to moving objects. Journal of Neuroscience. 1999;19:9480–9496. doi: 10.1523/JNEUROSCI.19-21-09480.1999. [DOI] [PMC free article] [PubMed] [Google Scholar]
- Snyder AZ. Difference image versus ratio image error function forms in PET-PET realignment. In: Bailey D, Jones T, editors. Quantification of brain function using PET. San Diego: Academic Press; 1996. [Google Scholar]
- Stevens AA, Skudlarski P, Gatenby JC, Gore JC. Event-related fMRI of auditory and visual oddball tasks. Magn Reson Imaging. 2000;18(5):495–502. doi: 10.1016/s0730-725x(00)00128-4. [DOI] [PubMed] [Google Scholar]
- Strick PL. The influence of motor preparation on the response of cerebellar neurons to limb displacements. J Neurosci. 1983;3(10):2007–2020. doi: 10.1523/JNEUROSCI.03-10-02007.1983. [DOI] [PMC free article] [PubMed] [Google Scholar]
- Talairach J, Tournoux P. In: Co-Planar Stereotaxic Atlas of the Human Brain. Rayport M, translator. New York: Thieme Medical Publishers, Inc; 1988. [Google Scholar]
- Tosoni A, Galati G, Romani GL, Corbetta M. Sensory-motor mechanisms in human parietal cortex underlie arbitrary visual decisions. Nat Neurosci. 2008;11(12):1446–1453. doi: 10.1038/nn.2221. [DOI] [PMC free article] [PubMed] [Google Scholar]
- Usher M, McClelland JL. The time course of perceptual choice: The leaky, competing accumulator model. Psychological Review. 2001;108(3):550–592. doi: 10.1037/0033-295x.108.3.550. [DOI] [PubMed] [Google Scholar]
- Van Essen DC. A Population-Average, Landmark- and Surface-based (PALS) atlas of human cerebral cortex. Neuroimage. 2005;28(3):635–662. doi: 10.1016/j.neuroimage.2005.06.058. [DOI] [PubMed] [Google Scholar]
- Van Essen DC, Dickson J, Harwell J, Hanlon D, Anderson CH, Drury HA. An integrated software suite for surface-based analyses of cerebral cortex. J Am Med Inform Assoc. 2001;41:1359–1378. doi: 10.1136/jamia.2001.0080443. [DOI] [PMC free article] [PubMed] [Google Scholar]
- Wheeler ME, Petersen SE, Nelson SM, Ploran EJ, Velanova K. Dissociating early and late error signals in perceptual recognition. Journal of Cognitive Neuroscience. 2008;12:2211–2225. doi: 10.1162/jocn.2008.20155. [DOI] [PubMed] [Google Scholar]
- Wiecki TV, Sofer I, Frank MJ. HDDM: Hierarchical Bayesian estimation of the Drift-Diffusion Model in Python. Frontiers in neuroinformatics. 2013;7:14. doi: 10.3389/fninf.2013.00014. [DOI] [PMC free article] [PubMed] [Google Scholar]
- Yang T, Shadlen MN. Probabilistic reasoning by neurons. Nature. 2007;447(7148):1075–1080. doi: 10.1038/nature05852. [DOI] [PubMed] [Google Scholar]
Associated Data
This section collects any data citations, data availability statements, or supplementary materials included in this article.