

Abstract
Objectives
To examine independent associations between sleep-disordered breathing (SDB), sleep duration from birth through 6.75 years, and body mass index (BMI) through 15 years of age in a population-based cohort.
Study design
The Avon Longitudinal Study of Parents and Children (ALSPAC) collected parent questionnaire data on child sleep duration and sleep disordered breathing (SDB) symptoms from birth through 6.75 years and child BMI from ALSPAC research clinics (n=1,899). For SDB, logistic regression models-- minimal, confounder, and confounder + sleep duration adjusted-- examined associations with BMI at 7, 10, and 15 years. For short sleep duration (≤ 10th centile), comparable SDB-adjusted models examined associations with BMI at 15 years.
Results
Children with the worst SDB symptoms vs. asymptomatic children, had increased odds of overweight at 7 (OR=2.08, 95% CI= 1.04-4.17), 10 (OR= 1.79, 95% CI= 1.02-3.16), and 15 years (OR= 2.25, 95% CI= 1.27-3.97) in models adjusted for sleep duration. Similarly, short sleep duration at ≈5-6 years was associated with overweight at 15 years, independent of SDB. Children with short sleep duration at 4.75 years were more likely to be overweight at 15 years in minimally (OR= 2.21, 95% CI= 1.52-3.20), confounder (OR= 1.99, 95% CI= 1.34-2.96), and SDB-adjusted (OR= 2.04, 95% CI= 1.36=3.04) models.
Conclusion
Both SDB and short sleep duration significantly and independently increase children’s odds of becoming overweight. Findings underscore the potential importance of early identification and remediation of SDB, along with insufficient sleep, as strategies for reducing childhood obesity.
Keywords: children, sleep, obesity, ALSPAC
Both sleep disordered breathing (SDB) and short sleep duration are associated with childhood obesity.(1-4) SDB ranges from snoring to obstructive sleep apnea (OSA) and peaks at 2-8 years of age.(5, 6) Mechanisms linking SDB to obesity are multi-factorial and complex. They are held to involve inflammation and insulin resistance,(1, 4, 7) appetite-regulating hormones,(8, 9) and sleep disruption(1, 3) often with reciprocal effects.(2, 3, 7) Adenotonsillar hypertrophy is the main remediable cause of SDB in young children.(10, 11) In the context of a childhood obesity epidemic, a second “obesity phenotype” of SDB, more similar to that seen in adults, has been proposed.(12) Short sleep duration also increases obesity risk(13, 14) in longitudinal data from early (15-17) and middle childhood,(18) through adolescence.(19)In fact, increasing young children’s sleep is considered amongst the most promising strategies for reducing childhood obesity. (20-22) Mechanisms are similar to those for SDB, (1-4) but also include effects upon biological (circadian) and social (household) rhythms.(2, 3) In recent years, short sleep duration has eclipsed SDB as a putative risk factor in the literature on childhood obesity.
Though SDB and short sleep duration are increasingly recognized as sharing potential pathways to obesity, their independent associations with obesity throughout childhood remain unexplored. Of the near dozen longitudinal studies of SDB in children (23-31) just two assessed BMI outcomes.(28, 29) Both showed an association with higher BMI. However, neither tracked SDB from early childhood, assessed BMI beyond a single follow-up, or adjusted for multiple confounding factors, particularly sleep duration. This latter gap is significant, because persistent short sleep from 2--6 years can elevate obesity risk by 4-fold(15) and because a sizable component of childhood obesity is set by 5-7 years of age.(32-34)Thus, failing to account for sleep duration in early childhood may lead to confounding of the association between SDB and subsequent obesity. Similarly, failure to account for SDB may lead to confounding of the association between sleep duration and obesity. Although two recent studies report that sleep timing(35) and duration(35, 36) elevate obesity risk in children, independent of SDB, neither was longitudinal.
This study addresses the above gaps in knowledge, using data from a longitudinal cohort study. We examined the independent association between both SDB and sleep duration in early childhood on BMI later in childhood and adolescence (7, 10 and 15 years). We focused upon early childhood as the exposure period because sleep patterns in those years, as compared with subsequent years, are more predictive of overweight in late childhood and adolescence,(37) and because early childhood is a key period for excess weight gain. (38) SDB risk, in the absence of objective obstructive sleep apnea measures within this large cohort, was assessed as in our previous work through composite trajectories of its hallmark symptoms (i.e., clusters) of snoring, mouth-breathing, and witnessed apnea, prior to 7 years of age. (5) Our primary research hypotheses were: (1) SDB symptom clusters are associated with obesity at 7, 10, and 15 years of age, independent of sleep duration, and (2) Shorter sleep duration in early life is associated with obesity at 15 years of age, independent of SDB. Secondarily, we examined associations with underweight and short stature which can occur with severe, untreated SDB in early life.(39) This study builds upon prior analyses from the Avon Longitudinal Study of Parents and Children (ALSPAC) that describe the natural history of SDB, (24) the SDB symptom clusters,(40) sleep duration,(41) and growth.(16, 42, 43) We undertook this analysis in ALSPAC because its longitudinal data offer a unique opportunity for exploring the above timely hypotheses.
Methods
The ALSPAC cohort study of child health and development enrolled pregnant women from southwest England with expected delivery dates between April 1991 and December 1992. A total of 14,541 pregnant women were enrolled. Described in detail elsewhere (http://www.bristol.ac.uk/alspac/), the cohort is broadly representative of the UK population in terms of socioeconomic status (SES), with slight under-representation of ethnic minorities, and over-representation of wealthier families.(44)
We incorporated potential confounders based upon prior work. Maternal demographic variables included: education (4 levels, “degree”= highest), age at delivery, pre-pregnancy BMI, and parity; all were reported by the mother in questionnaires during pregnancy. Child demographics included sex, birth weight (extracted from medical records), and weight and height at six months (as described in a previous publication).(45, 46) Sleep duration was calculated from maternal report of typical weekday bed- and wake-times at 18 months, 2.5 years, 4.75 years and 5.75 years.(41) These time points were chosen to represent different stages of childhood during the period in which our exposure (SDB) is assessed. At each age, we divided sleep duration into three categories: ≤10th centile (≤10, ≤10, ≤10.5, ≤10.5 and ≤9.5 hours respectively), >10th and <90th percentile, and ≥90th perentile (≥12.5, ≥12.5, ≥12.1, ≥12 and ≥11.75 hours respectively), and treated the measures as categorical variables due to possible non-linear associations with other variables. Tonsillectomy and/or adenoidectomy (T&A) is the first line treatment for SDB. (47, 48) Responses were grouped to indicate any or no T&A.
Height and weight at 7, 10 and 15 years were measured at ALSPAC research clinics, with the child in light clothing and no shoes. We calculated BMI as weight/height2 (kg/m2). We used International Obesity Task Force definitions of obesity as a BMI > 95th percentile for age and sex, and underweight as a BMI < 5th percentile for age and sex.(49) Short stature was defined as <5th percentile for age and sex using internally derived centiles. We selected measures of BMI and height at ages 7, 10 and 15 years because they occur after our assessments of SDB, and, for most children, these ages represent the period immediately following adiposity rebound (7 years), just prior to puberty (10 years), and during puberty (15 years).
_ALSPAC questionnaires, mailed when children were 6, 18, 30, 42, 57, 69, and 81 months old, asked parents about their child’s snoring, observed apnea, and mouth-breathing. These measures, consistent with guidelines for clinical diagnosis of SDB,(50) were: 1) Snoring: “Does she snore for more than a few minutes at a time?”; 2) Apnea: “When asleep, does she seem to stop breathing or hold breath for several seconds at a time?”; and 3) Mouth-breathing: “Does she breathe through her mouth rather than her nose?”. Responses were categorized along ordinal 3, 4, or 5 level scales. Given this variation in response categories, we extrapolated values to a common scale (0-100), anchored by the extreme “always” and “never” or “rarely/never” categories, with proportionate spacing in-between (ie, a 4 category scale was recoded as 0, 33, 66, 100). Variables were transformed to z-scores. Higher scores indicate more symptoms.
To capture SDB’s multi-symptom, changing nature, we classified snoring, witnessed apnea, and mouth-breathing into trajectories or “clusters”. SDB z-scores were partitioned into clusters using the k-means model procedures of SAS FASTCLUS version 9.2 (Cary, NC). We examined the uniqueness of clusters with analysis of variance (ANOVA) tests; linear discriminant functional analysis (LDFA) was used to test for the significance of differences between them. Independent clinicians examined cluster plots for clinical relevance. To assess clinical validity, plots were analyzed in relation to two ‘criterion’ variables associated with SDB: wheezing and tonsil and/or adenoid removal. Through this cluster analysis, described in more detail elsewhere,(40) we produced 5 conceptually and statistically distinct clusters for children with SDB data for >3 of 7 possible timepoints. They included one asymptomatic (“Normals,” 45% of sample) and four symptomatic (55% of sample) trajectories with distinct temporal distributions of symptoms.
Statistical Analyses
Analyses are based upon children with complete data for exposure variables (SDB and sleep duration) as well as for BMI and all potential confounders, at 7, 10, and 15 years. Sample characteristics are presented by SDB cluster, as numbers (percentages) and means (standard deviations). Associations between SDB cluster and sleep duration (unadjusted) are shown as numbers (percentages). Our a priori intention was to consider underweight, overweight, and short stature as outcomes in our analyses. However, given the low prevalence of short stature and underweight in our population, we only present descriptive statistics for these outcomes and do not carry out regression analyses. We used logistic regression to estimate the associations of SDB cluster (with “no symptoms” as the reference category) with obesity at 7, 10, and 15 years. We excluded participants with underweight BMI because we hypothesized that SDB might also be associated with weight status and we therefore did not want to bias our results by mixing normal weight and underweight people). Results are presented as ORs and 95% confidence intervals (OR, 95% CI). Three models are presented: (a) minimally adjusted, (b) confounder adjusted, and (c) confounder adjusted with additional adjustment for sleep duration. Minimally adjusted models incorporate child sex and exact age at BMI assessment; this model was a priori determined given known differences in obesity prevalence between males and females and variation in exact age at the 7, 10, and 15 year follow-ups. Confounder adjusted models included these variables, as well as maternal and child confounders as detailed above. The included confounders were determined a priori using subject knowledge about determinants of both SDB and obesity. Tests for statistical interactions were conducted to determine whether T & A history or sleep duration modified the association between SDB cluster and obese BMI; we a priori determined that these variables were potential effect modifiers. Logistic regression was used to assess the associations of sleep duration with BMI status at 15 years with and without adjustment for confounders and SDB.
Results
The participants with complete data on all variables are described by SDB Clusters (n=1899) (Table I). The five clusters (shown on-line) are: (a) no symptoms- asymptomatic throughout (45%); (b) peak @ 6 months- symptoms peak at 6 months, then abate (18.5%); (c) peak @ 18 months– symptoms peak at 18 months, then abate (10.5%); (d) worst case- symptoms rise at 18 months, peak at 30-40 months, then remain high (7%), and; (e) late symptom- modest symptoms appear at 42 months, and remain high (19%). Maternal education, age, and pre-pregnancy BMI differed by cluster, as did child history of T & A and BMI at 7 and 15 years. Neither underweight, nor short stature appeared to differ by cluster. Given insufficient cell sizes for these outcomes, we did not pursue further analyses of them. Participants from the larger ALSPAC cohort excluded from our analysis because of incomplete data tended to be of lower maternal education, younger maternal age, and higher maternal BMI and were less likely to be in the “no symptoms” cluster.
Table 1. Characteristics of Participants. N=1,899.
| SDB clusters | P valuef | |||||
|---|---|---|---|---|---|---|
| N= 1,899a | No symptoms | Peak at 6 months |
Peak at 18 months |
Worst case | Late symptoms |
|
| Characteristics b | N=858 | N=353 | N=200 | N=126 | N=362 | |
| Female sex | 430 (46.0%) | 166 (47.0%) | 101 (50.5%) | 50 (39.7%) | 187 (51.7%) | 0.16 |
| Birth weight (kg) | 3.4 (0.5) | 3.5 (0.5) | 3.5 (0.5) | 3.5 (0.6) | 3.4 (0.5) | 0.87 |
| Maternal education | ||||||
| Less than O-level | 102 (11.9%) | 57 (16.2%) | 37 (18.5%) | 24 (19.1%) | 68 (18.8%) | |
| O-level | 289 (33.7%) | 119 (33.7%) | 61 (30.5%) | 43 (34.1%) | 128 (35.4%) | |
| A-level | 261 (30.4%) | 101 (28.6%) | 66 (33.0%) | 36 (28.6%) | 103 (28.5%) | |
| Degree or above | 206 (24.0%) | 76 (21.5%) | 36 (18.0%) | 23 (18.3%) | 63 (17.4%) | 0.04 |
| Maternal age (years) | 30.1 (4.3) | 29.7 (4.1) | 29.9 (4.8) | 29.0 (4.4) | 29.2 (4.2) | 0.01 |
| Maternal parity | ||||||
| 0 | 406 (47.3%) | 155 (43.9%) | 107 (53.5%) | 62 (49.2%) | 171 (47.2%) | |
| 1 | 285 (33.2%) | 136 (38.5%) | 60 (30.0%) | 38 (30.2%) | 126 (34.8%) | |
| 2 | 117 (13.6%) | 37 (10.5%) | 26 (13.0%) | 18 (14.3%) | 47 (13.0%) | |
| 3 or more | 50 (5.8%) | 25 (7.1%) | 7 (3.5%) | 8 (6.4%) | 18 (5.0%) | 0.45 |
| Maternal pre- pregnancy BMI (kg/m ) |
22.7 (3.4) | 22.5 (3.6) | 22.9 (3.8) | 23.4 (4.0) | 23.2 (3.9) | 0.05 |
| Tonsillectomy or adenoidectomy |
17 (2.0%) | 18 (5.1%) | 9 (4.5%) | 30 (23.8%) | 29 (8.0%) | <0.001 |
| Weight at 6 months (kg) |
4.5 (0.5) | 4.6 (0.5) | 4.5 (0.6) | 4.5 (0.6) | 4.5 (0.5) | 0.64 |
| Height at 6 months (cm) |
55.2 (1.7) | 55.1 (1.8) | 55.2 (1.8) | 55.0 (2.0) | 55.0 (1.7) | 0.65 |
| BMI at age 7 | ||||||
| Underweight c | 30 (3.5%) | 11 (3.1%) | 8 (4.0%) | 8 (6.4%) | 8 (2.2%) | |
| Normal BMI | 776 (90.4%) | 323 (91.5%) | 181 (90.5%) | 103 (81.8%) | 317 (87.6%) | |
| Obese d | 52 (6.1%) | 19 (5.4%) | 11 (5.5%) | 15 (11.9%) | 37 (10.2%) | 0.02 |
| BMI at age 10 | ||||||
| Underweight | 22 (2.6%) | 9 (2.6%) | 9 (4.5%) | 5 (4.0%) | 10 (2.8%) | |
| Normal BMI | 748 (87.2%) | 306 (86.7%) | 170 (85.0%) | 98 (77.8%) | 300 (82.9%) | |
| Obese | 88 (10.3%) | 38 (10.8%) | 21 (10.5%) | 23 (18.3%) | 52 (14.4%) | 0.11 |
| BMI at age 15 | ||||||
| Underweight | 22 (2.6%) | 11 (3.1%) | 7 (3.5%) | 8 (6.4%) | 7 (1.9%) | |
| Normal BMI | 753 (87.8%) | 312 (88.4%) | 171 (85.5%) | 95 (75.4%) | 302 (83.4%) | |
| Obese | 83 (9.7%) | 30 (8.5%) | 22 (11.0%) | 23 (18.3%) | 53 (14.6%) | 0.003 |
| Short stature at 7e | 21 (2.5%) | 8 (2.3%) | 7 (3.5%) | 5 (4.0%) | 11 (3.0%) | 0.77 |
| Short stature at 10 | 13 (1.5%) | 5 (2.5%) | 5 (2.5%) | 4 (3.2%) | 10 (2.8%) | 0.42 |
| Short stature at 15 | 13 (1.5%) | 2 (0.6%) | 5 (2.5%) | 3 (2.4%) | 6 (1.7%) | 0.40 |
Based upon the 1,899 participants with complete data on all variables
Values- are numbers (percentages) or means (standard deviations)
Underweight- defined as BMI less than the 5th percentile for age and sex, according to the International Obesity Task Force
Obese- defined as BMI greater than the 95% percentile for age and sex, according to the International Obesity Task Force
Short stature- is defined as height less than the 5th percentile for age and sex
from Chi-squared tests or linear regressions
Sleep Duration and SDB Cluster Associations Across Childhood
We examined associations between each SDB cluster, and sleep duration at 18 months, 2.5 years, 5.75 years, and 6.75 years of age (Table II). None were significant; comparable proportions within each cluster were short, average, and long sleepers.
Table 2. Associations between sleep duration across childhood and sleep disordered breathing clusters. N=1,899.
| SDB clusters | P value | |||||
|---|---|---|---|---|---|---|
| No symptoms | Peak at 6 months | Peak at 18 months | Worst case | Late symptoms | ||
| N (%)a | N (%)a | N (%)a | N (%)a | N (%)a | ||
| Sleep duration at 18 months b | ||||||
| Short | 118 (13.8%) | 48 (13.6%) | 32 (16.0%) | 18 (14.3%) | 46 (12.7%) | |
| Average | 622 (72.5%) | 266 (75.4%) | 156 (78.0%) | 94 (74.6%) | 267 (73.8%) | |
| Long | 118 (13.8%) | 39 (11.1%) | 12 (6.0%) | 14 (11.1%) | 49 (13.5%) | 0.21 |
| Sleep duration at 2.5 years b | ||||||
| Short | 95 (11.1%) | 48 (13.6%) | 32 (16.0%) | 18 (14.3%) | 61 (16.9%) | |
| Average | 679 (79.1%) | 275 (77.9%) | 153 (76.5%) | 97 (77.0%) | 271 (74.9%) | |
| Long | 84 (9.8%) | 30 (8.5%) | 15 (7.5%) | 11 (8.7%) | 30 (8.3%) | 0.28 |
| Sleep duration at 4.75 years b | ||||||
| Short | 100 (11.7%) | 44 (12.5%) | 27 (13.5%) | 9 (7.1%) | 46 (12.7%) | |
| Average | 676 (78.8%) | 283 (80.2%) | 160 (80.0%) | 106 (84.1%) | 287 (79.3%) | |
| Long | 82 (9.6%) | 26 (7.4%) | 13 (6.5%) | 11 (8.7%) | 29 (8.0%) | 0.61 |
| Sleep duration at 5.75 years b | ||||||
| Short | 143 (16.7%) | 57 (16.2%) | 38 (19.0%) | 15 (11.9%) | 60 (16.6%) | |
| Average | 548 (63.9%) | 233 (66.0%) | 134 (67.0%) | 88 (69.8%) | 226 (62.4%) | |
| Long | 167 (19.5%) | 63 (17.9%) | 28 (14.0%) | 23 (18.3%) | 76 (21.0%) | 0.50 |
| Sleep duration at 6.75 years b | ||||||
| Short | 95 (11.1%) | 39 (11.1%) | 31 (15.5%) | 11 (8.7%) | 43 (11.1%) | |
| Average | 669 (78.0%) | 282 (79.9%) | 148 (74.0%) | 104 (82.5%) | 279 (77.1%) | |
| Long | 94 (11.0%) | 32 (9.1%) | 21 (10.5%) | 11 (8.7%) | 43 (11.9%) | 0.63 |
Numbers and % of people within each cluster who have short, average and long sleep duration; p values from chi-squared tests.
At 18 months and 2.5 years, short sleep duration is ≤10 hours; average sleep duration is >10 and <12.5 hours, long sleep duration is ≥12.5 hours. At 4.75 years, short sleep duration is ≤10.5 hours; average sleep duration is >10.5 and <12.08 hours, long sleep duration is ≥12.08 hours. At 5.75 years, short sleep duration is >10.5 hours; average sleep duration is >10.5 and <12.0 hours, long sleep duration is ≥12.0 hours. At 6.75 years, short sleep duration is ≤9.5 hours; average sleep duration is >9.5 and <11.75 hours, long sleep duration is ≥11.75 hours.
BMI Outcomes at 7, 10, and 15 Years (N=1,844)
Regardless of adjustment for any confounders or sleep duration, the “Worst Case” cluster had twice as high odds of becoming obese by 7, 10, and 15 years, compared with the asymptomatic group (Table III). Minimally adjusted results at 7 (OR= 2.15, 95% CI= 1.17-3.96), 10 (OR= 1.90, 95% CI= 1.14-3.16), and 15 years (OR= 2.18 95% CI= 1.31-3.64) mirrored confounder and sleep duration adjusted results at 7 (OR=2.08, 95% CI= 1.04-4.17), 10 (OR= 1.79, 95% CI= 1.02-3.16), and 15 years (OR= 2.25, 95% CI= 1.27-3.97). Likewise, in the “late symptom” cluster, increased odds of overweight at 7 and 15 years (≈80% and ≈60%, respectively) did not vary across models. Children with ‘Late Symptoms’ had a borderline significant increased odds of obesity at 10 years (OR= 1.45, 95% CI= 1.00-2.10) in minimally adjusted analyses, which became nonsignificant after adjustment. No other cluster-time associations were significant.
Table 3. The association of SDB clusters with overweight across childhood and adolescence. N=1,844.
| SDB clusters | |||||
|---|---|---|---|---|---|
| No symptoms | Peak at 6 months | Peak at 18 months | Worst case | Late symptoms | |
| OR (95% CI)b | OR (95% CI) | OR (95% CI) | OR (95% CI) | ||
| Minimally adjusted results a | |||||
| Obesity at age 7c |
1 (ref) | 0.88 (0.51 to 1.51) P=0.63 |
0.91 (0.47 to 1.78) P=0.79 |
2.15 (1.17 to 3.96) P=0.01 |
1.75 (1.12 to 2.72) P=0.01 |
| Obesity at age 10 |
1 (ref) | 1.05 (0.70 to 1.57) P=0.82 |
1.04 (0.63 to 1.72) P=0.89 |
1.90 (1.14 to 3.16) P=0.01 |
1.45 (1.00 to 2.10) P=0.05 |
| Obesity at age 15 |
1 (ref) | 0.87 (0.56 to 1.35) P=0.54 |
1.17 (0.71 to 1.92) P=0.54 |
2.18 (1.31 to 3.64) P=0.003 |
1.60 (1.10 to 2.31) P=0.01 |
| Confounder adjusted results d | |||||
| Obesity at age 7c |
1 (ref) | 0.83 (0.47 to 1.47) P=0.53 |
0.91 (0.46 to 1.83) P=0.79 |
2.08 (1.05 to 4.11) P=0.04 |
1.78 (1.11 to 2.85) P=0.02 |
| Obesity at age 10 |
1 (ref) | 1.02 (0.67 to 1.56) P=0.92 |
1.00 (0.59 to 1.69) P=1.00 |
1.76 (1.01 to 3.08) P=0.05 |
1.40 (0.95 to 2.07) P=0.09 |
| Obesity at age 15 |
1 (ref) | 0.86 (0.54 to 1.36) P=0.52 |
1.14 (0.68 to 1.92) P=0.62 |
2.17 (1.24 to 3.81) P=0.01 |
1.58 (1.07 to 2.35) P=0.02 |
| Confounder adjusted results with additional adjustment for sleep duration e | |||||
| Obesity at age 7c |
1 (ref) | 0.82 (0.46 to 1.46) P=0.51 |
0.91 (0.45 to 1.84) P=0.79 |
2.08 (1.04 to 4.17) P=0.04 |
1.78 (1.11 to 2.87) P=0.02 |
| Obesity at age 10 |
1 (ref) | 1.03 (0.67 to 1.57) P=0.91 |
0.97 (0.57 to 1.66) P=0.93 |
1.79 (1.02 to 3.16) P=0.04 |
1.38 (0.93 to 2.05) P=0.11 |
| Obesity at age 15 |
1 (ref) | 0.87 (0.55 to 1.38) P=0.55 |
1.12 (0.66 to 1.90) P=0.66 |
2.25 (1.27 to 3.97) P=0.01 |
1.56 (1.05 to 2.33) P=0.03 |
Analyses are adjusted only for child’s sex and age at BMI assessment
Odds ratios (95% confidence intervals) - compare the odds of Obesity v.normal BMI, with each SDB cluster compared with the ‘no symptoms’ cluster
Obesity - defined as BMI greater than the 95% percentile for age and sex, according to the International Obesity Task Force. Underweight children are excluded from these analyses
Analyses are adjusted for child’s sex, age at BMI/height assessment and birth weight, child’s estimated weight and height at 6 months, maternal education, age, parity and pre-pregnancy BMI, and tonsil/adenoidectomy.
Analyses are adjusted for the same as above, with the addition of sleep duration (at 18 months, 2.5, 4.75, 5.75 and 6.75 years). Each measure of sleep duration is treated as a categorical variable; ≤10th centile, >10th and <90th centile, and ≥90th centile.
We sought to determine whether sleep duration modified the statistical effects of SDB upon BMI. Though we have insufficient power to examine this question definitively, the data do not suggest significant interactions for sleep duration at 18 months (p=0.81), 2.5 years (p=0.26), 4.75 years (p=0.33), or at 5.75 years (p=0.77). Interactions between T & A and clusters were not significant at 7 (p=0.97), 10 (p=0.32) or 15 years (p=0.16); thus having a T & A did not modify these outcomes (not shown).
Associations Between Sleep Duration Across Childhood and Obesity at Age 15 (N= 1,844)
Regardless of adjustment for confounders or SDB clusters, short sleep duration at 4.75 and 5.75 years was significantly associated with increased odds of obesity at 15 years (Table IV). At 4.75 years, the minimally (OR= 2.21, 95% CI= 1.52-3.20), confounder (OR= 1.99, 95% CI= 1.34-2.96), and SDB cluster (OR= 2.04, 95% CI= 1.36=3.04) adjusted increased odds of subsequent obesity were nearly identical. Likewise, short sleep duration at 5.75 years was consistently associated with 55%-65% increased odds of obesity at 15 years. Short sleep duration at other time periods was borderline significant. Children with the longest sleep duration at 2.5 years were less likely to be obese at 15 years (OR= 0.50, 95% CI= 0.26-0.97) in minimally adjusted analyses only.
Table 4. Associations between sleep duration across childhood and Obesity at age 15. N=1,899.
| Minimally adjusted a | Confounder adjusted b | Confounder adjusted with additional adjustment for SDB cluster c |
|
|---|---|---|---|
| OR (95% CI)d | OR (95% CI)d | OR (95% CI)d | |
| Sleep duration at 18 months d,e | |||
| Short | 1.48 (1.00 to 2.17) P=0.05 |
1.22 (0.80 to 1.84) P=0.35 |
1.23 (0.81 to 1.86) P=0.34 |
| Average | 1 (ref) | 1 (ref) | 1 (ref) |
| Long | 1.16 (0.75 to 1.80) P=0.50 |
1.05 (0.65 to 1.68) P=0.85 |
1.05 (0.65 to 1.69) P=0.85 |
| Sleep duration at 2.5 years d,e | |||
| Short | 1.44 (0.98 to 2.10) P=0.06 |
1.38 (0.92 to 2.08) P=0.12 |
1.33 (0.89 to 2.01) P=0.17 |
| Average | 1 (ref) | 1 (ref) | 1 (ref) |
| Long | 0.50 (0.26 to 0.97) P=0.04 |
0.53 (0.26 to 1.05) P=0.07 |
0.53 (0.27 to 1.06) P=0.07 |
| Sleep duration at 4.75 years d,e | |||
| Short | 2.21 (1.52 to 3.20) P<0.001 |
1.99 (1.34 to 2.96) P=0.001 |
2.04 (1.36 to 3.04) P=0.001 |
| Average | 1 (ref) | 1 (ref) | 1 (ref) |
| Long | 1.08 (0.64 to 1.84) P=0.77 |
0.82 (0.46 to 1.47) P=0.51 |
0.86 (0.48 to 1.55) P=0.62 |
| Sleep duration at 5.75 years d,e | |||
| Short | 1.54 (1.08 to 2.20) P=0.02 |
1.62 (1.10 to 2.37) P=0.01 |
1.64 (1.11 to 2.41) P=0.01 |
| Average | 1 (ref) | 1 (ref) | 1 (ref) |
| Long | 0.83 (0.55 to 1.25) P=0.38 |
0.72 (0.46 to 1.12) P=0.14 |
0.73 (0.47 to 1.13) P=0.16 |
| Sleep duration at 6.75 years d,e | |||
| Short | 1.50 (1.00 to 2.25) P=0.05 |
1.34 (0.87 to 2.06) P=0.19 |
1.33 (0.86 to 2.06) P=0.20 |
| Average | 1 (ref) | 1 (ref) | 1 (ref) |
| Long | 0.94 (0.58 to 1.54) P=0.81 |
0.81 (0.48 to 1.37) P=0.43 |
0.82 (0.48 to 1.39) P=0.46 |
Analyses are adjusted only for child’s sex and age at BMI assessment
Analyses are adjusted for child’s sex, age at BMI/height assessment and birth weight, child’s estimated weight and height at 6 months, maternal education, age, parity and pre-pregnancy BMI, and tonsil/adenoidectomy.
Analyses are adjusted for the same variables as above, with the addition of SDB clusters
Odds ratios (95% confidence intervals) for Obesity compared with normal weight at age 15 years - compare short and long sleep duration with average sleep duration. Obesity is defined as BMI greater than the 95% percentile for age and sex, according to the International Obesity Task Force
At 18 months and 2.5 years, short sleep duration is ≤10 hours; average sleep duration is >10 and <12.5 hours, long sleep duration is ≥12.5 hours. At 4.75 years, short sleep duration is ≤10.5 hours; average sleep duration is >10.5 and <12.08 hours, long sleep duration is ≥12.08 hours. At 5.75 years, short sleep duration is ≤10.5 hours; average sleep duration is >10.5 and <12.0 hours, long sleep duration is ≥12.0 hours. At 6.75 years, short sleep duration is ≤9.5 hours; average sleep duration is >9.5 and <11.75 hours, long sleep duration is >≥11.75 hours.
Discussion
Roots of obesity in late childhood, through to adulthood, most likely extend back to early childhood. (32, 51-53)They include SDB and short sleep duration, which we assessed from birth to nearly 7 years, to determine associations with subsequent obesity. Compared with children without SDB symptoms, those with the worst symptoms (peak age ≈ 2.5-3 years) had double the odds of obesity at 7, 10, and 15 years-- independent of sleep duration. Children whose SDB peaked later (≈5-6 years) had a 60%-80% increased odds, again, regardless of sleep duration. Overall, 25% of children in this population-based cohort had an increased odds of obesity in association with early SDB symptoms. Conversely, short sleep duration at ≈5-6 years was associated with almost identical increased odds of obesity at 15 years-- 60%-100%-- independent of SDB. Thus, even though SDB and sleep duration share multiple common pathways to obesity in children, our findings suggest that their effects are of comparable magnitude and independent of one another.
This study’s strengths include a large longitudinal cohort with sleep exposures and BMI assessed at multiple timepoints, control for multiple confounders, and a previously established(40) SDB assessment for which each of 3 symptom constructs has been validated against polysomnography.(54) The study has limitations. SDB trajectories extended just through 6.75 years. Other work finds a 10% incidence of SDB between 8 and 13 years of age,(28) stable snoring prevalence from 4 through 12 years,(17) and adenotonsillar enlargement beyond 7-8 years in children who snore.(55) Thus, SDB beyond 6.75 years might have affected BMI at 10 and 15 years. Likewise, sleep duration at later periods may affect subsequent BMI. We censored our duration measure at 6.75 years to permit analysis of its contemporaneous confounding effects with SDB. More broadly, our focus upon earlier childhood sleep exposures reflects evidence that sleep patterns early in childhood as compared with late childhood are more strongly associated with subsequent obesity, and that excess weight gain in early childhood tracks to later years.(32-34, 38, 51) Reverse causality is possible (ie, overweight may cause SDB). To address this, we adjusted for maternal pre-pregnancy BMI and child’s weight and length at 6 months, both of which are strong determinants of a child’s later BMI. We did not adjust for later BMI measures as this would impose over-adjustment and likely preclude valid assessment of our hypothesis. As in any longitudinal study loss to follow-up has been socially patterned and therefore our participants tended to be of higher socioeconomic position compared with those excluded due to missing data and were less likely to have SDB symptoms. Although this means that our population is not representative of the whole cohort, this is unlikely to have biased our results; in order to cause bias the association between SDB and overweight/obesity would need to differ between those included and excluded from our analysis; we do not think this is likely.
Another limitation was the use of three symptom-items, rather than gold-standard polysomnography, in the nearly 2,000 subjects. These symptoms no-doubt misclassified some subjects as having SDB, or not, as would be defined by objective testing.(56) However, these symptoms are highly likely to serve the intended research purpose: to identify effectively in aggregate a group of children at increased risk for SDB. These three symptoms -- snoring, observed apnea, and mouth-breathing -- correspond to three key, simply worded items from the Pediatric Sleep Questionnaire – Sleep-Related Breathing Disorders Scale, each of which was individually validated as predictive of polysomnographic results.(54) The Scale itself has been highlighted by several reviews as one of the most appropriate instruments developed for this purpose.(57, 58)
Regarding SDB, our findings are consistent with the two prior longitudinal studies of BMI outcomes in children. One study showed that SDB at baseline (mean age= 8.5 years) was associated with a 3-fold increased odds of obesity at 5 year follow-up.(28) In the other study, only children who were both overweight at baseline (mean age= 10.2 years), and had severe SDB, remained overweight at 4-year follow-up.(29) Notably, they employed polysomnography (the gold standard for assessing SDB), though neither was population-based or incorporated multiple potential confounders (including sleep duration). Still, even though these reports and the present study provide longitudinal rather than randomized controlled data that could prove cause-and-effect, they combine to suggest that SDB in early life could promote overweight in later life particularly among those children who have an initial proclivity of predisposition to overweight.
Regarding sleep duration, our findings are consistent with effect sizes in prior longitudinal studies of children, which range from 40%-100% increased risk of subsequent obesity,(14, 59) despite variable definitions of short sleep duration. Several studies point to sleep duration at 3-7 years, as a critical risk period for obesity in children. Likewise, we found that short sleep duration (≤ 10.5 hours) at 4.75 and 5.75 years was associated with the likelihood of being obese at 15 years.
Our findings affirm the concept of healthy sleep, broadly conceived, as a foundation for healthy weight throughout childhood and into adulthood. Clinically, this broad approach should encompass, as suggested by our new data, attention to symptoms of SDB, in addition to insufficient sleep. Despite the bright spotlight in recent years on the potential influence of insufficient sleep on obesity risk, the potential contribution of untreated childhood SDB has received scant attention. Previous research also suggests that early childhood SDB may increase risks for adverse neurobehavioral outcomes that become apparent only years later.(60, 61) If morbidity such as obesity and attention deficit/hyperactivity disorder is in fact promoted by exposures to inadequate sleep early in life, new more sensitive and effective approaches for identification of those consequential yet remediable exposures will be required. These considerations highlight the challenges inherent with young patients, on rapid developmental trajectories in which outcomes can remain occult until later ages, yet have potential for lifelong effects on human health.
Figure 1A.
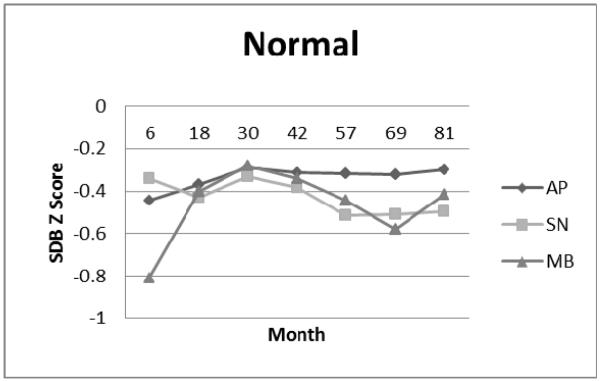
Normal Cluster: Apnea (AP), Snoring (SN), and Mouth-Breathing (MB) Symptom Standard Deviation (Z) Scores.
Figure 1B.

Peak at 6 Month Cluster: Apnea (AP), Snoring (SN), and Mouth-Breathing (MB) Symptom Standard Deviation (Z) Scores.
Figure 1C.

Peak at 18 Month Cluster: Apnea (AP), Snoring (SN), and Mouth-Breathing (MB) Symptom Standard Deviation (Z) Scores.
Figure 1D.
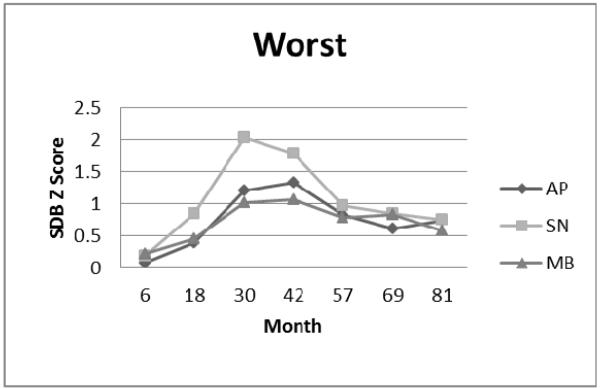
Worst Symptom Cluster: Apnea (AP), Snoring (SN), and Mouth-Breathing (MB) Symptom Standard Deviation (Z) Scores.
Figure 1E.
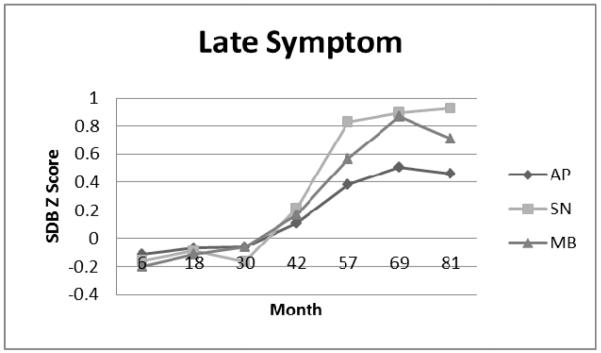
Late Symptom Cluster: Apnea (AP), Snoring (SN), and Mouth-Breathing (MB) Symptom Standard Deviation (Z) Scores.
Acknowledgments
Supported by the National Heart Lung & Blood Institute (R21HL091241). L.H. is funded by a UK Medical Research Council fellowship (G1002375), and works in a unit that receives core funding from the UK Medical Research Council and the University of Bristol (MC_UU_12013/9).
Abbreviations
- ALSPAC
Avon Longitudinal Study of Parents and Children
- BMI
body mass index
- SDB
sleep disordered breathing
- T & A
tonsillectomy and/or adenoidectomy
Footnotes
Publisher's Disclaimer: This is a PDF file of an unedited manuscript that has been accepted for publication. As a service to our customers we are providing this early version of the manuscript. The manuscript will undergo copyediting, typesetting, and review of the resulting proof before it is published in its final citable form. Please note that during the production process errors may be discovered which could affect the content, and all legal disclaimers that apply to the journal pertain.
The authors declare no conflicts of interest.
References
- 1.Bhattacharjee R, Hakim F, Gozal D. Sleep, sleep-disordered breathing and lipid homeostasis: translational evidence from murine models and children. Clinical lipidology. 2012 Apr;7(2):203–14. doi: 10.2217/clp.12.11. PubMed PMID: 22942904. Pubmed Central PMCID: PMC3430872. Epub 2012/09/04. Eng. [DOI] [PMC free article] [PubMed] [Google Scholar]
- 2.Gozal D, Kheirandish-Gozal L. Childhood obesity and sleep: relatives, partners, or both?--a critical perspective on the evidence. Annals of the New York Academy of Sciences. 2012 Aug;1264:135–41. doi: 10.1111/j.1749-6632.2012.06723.x. PubMed PMID: 22882312. Pubmed Central PMCID: PMC3464366. Epub 2012/08/14. eng. [DOI] [PMC free article] [PubMed] [Google Scholar]
- 3.Spruyt K, Gozal D. The underlying interactome of childhood obesity: the potential role of sleep. Childhood obesity (Print) 2012 Feb;8(1):38–42. doi: 10.1089/chi.2011.0105. PubMed PMID: 22799478. Pubmed Central PMCID: PMC3647589. Epub 2012/07/18. eng. [DOI] [PMC free article] [PubMed] [Google Scholar]
- 4.Kim J, Hakim F, Kheirandish-Gozal L, Gozal D. Inflammatory pathways in children with insufficient or disordered sleep. Respiratory physiology & neurobiology. 2011 Sep 30;178(3):465–74. doi: 10.1016/j.resp.2011.04.024. PubMed PMID: 21569868. Pubmed Central PMCID: PMC3168951. Epub 2011/05/17. eng. [DOI] [PMC free article] [PubMed] [Google Scholar]
- 5.Bonuck KA, Chervin RD, Cole T, Emond A, Henderson J, Xu L, et al. Prevalence and persistence of sleep disordered breathing symptoms in young children: A 6 year population-based cohort study. Sleep. 2011 Jul;34(7):875–84. doi: 10.5665/SLEEP.1118. PubMed PMID: 21731137. Pubmed Central PMCID: 3119829. Epub http://www.journalsleep.org/Accepted.aspx. [DOI] [PMC free article] [PubMed] [Google Scholar]
- 6.Lumeng JC, Chervin RD. Epidemiology of pediatric obstructive sleep apnea. Proc Am Thorac Soc. 2008 Feb 15;5(2):242–52. doi: 10.1513/pats.200708-135MG. PubMed PMID: 18250218. Pubmed Central PMCID: 2645255. Epub 2008/02/06. eng. [DOI] [PMC free article] [PubMed] [Google Scholar]
- 7.Arens R, Muzumdar H. Childhood obesity and obstructive sleep apnea syndrome. Journal of applied physiology. 2010 Feb;108(2):436–44. doi: 10.1152/japplphysiol.00689.2009. PubMed PMID: ISI:000274158300027. Pubmed Central PMCID: 2994651. [DOI] [PMC free article] [PubMed] [Google Scholar]
- 8.Spruyt K, Sans Capdevila O, Serpero LD, Kheirandish-Gozal L, Gozal D. Dietary and physical activity patterns in children with obstructive sleep apnea. The Journal of pediatrics. 2010 May;156(5):724–30. 30 e1–30 e3. doi: 10.1016/j.jpeds.2009.11.010. PubMed PMID: 20138306. Epub 2010/02/09. eng. [DOI] [PubMed] [Google Scholar]
- 9.Tauman R, Serpero LD, Capdevila OS, O’Brien LM, Goldbart AD, Kheirandish-Gozal L, et al. Adipokines in children with sleep disordered breathing. Sleep. 2007 Apr;30(4):443–9. doi: 10.1093/sleep/30.4.443. PubMed PMID: 17520788. Epub 2007/05/25. eng. [DOI] [PubMed] [Google Scholar]
- 10.Fitzgerald NM, Fitzgerald DA. Managing snoring and obstructive sleep apnoea in childhood. Journal of paediatrics and child health. 2013 Oct;49(10):800–6. doi: 10.1111/jpc.12421. PubMed PMID: 24131112. Epub 2013/10/18. eng. [DOI] [PubMed] [Google Scholar]
- 11.Bhattacharjee R, Kheirandish-Gozal L, Spruyt K, Mitchell RB, Promchiarak J, Simakajornboon N, et al. Adenotonsillectomy outcomes in treatment of obstructive sleep apnea in children: a multicenter retrospective study. Am J Respir Crit Care Med. 2010 Sep 1;182(5):676–83. doi: 10.1164/rccm.200912-1930OC. PubMed PMID: 20448096. Epub 2010/05/08. eng. [DOI] [PubMed] [Google Scholar]
- 12.Dayyat E, Kheirandish-Gozal L, Gozal D. Childhood Obstructive Sleep Apnea: One or Two Distinct Disease Entities? Sleep medicine clinics. 2007 Sep;2(3):433–44. doi: 10.1016/j.jsmc.2007.05.004. PubMed PMID: 18769509. Pubmed Central PMCID: PMC2084206. Epub 2008/09/05. Eng. [DOI] [PMC free article] [PubMed] [Google Scholar]
- 13.Cappuccio FP, Taggart FM, Kandala NB, Currie A, Peile E, Stranges S, et al. Meta-analysis of short sleep duration and obesity in children and adults. Sleep. 2008 May;31(5):619–26. doi: 10.1093/sleep/31.5.619. PubMed PMID: 18517032. Pubmed Central PMCID: PMC2398753. Epub 2008/06/04. eng. [DOI] [PMC free article] [PubMed] [Google Scholar]
- 14.Magee L, Hale L. Longitudinal associations between sleep duration and subsequent weight gain: A systematic review. Sleep medicine reviews. 2012;16(3):231–41. doi: 10.1016/j.smrv.2011.05.005. 6// [DOI] [PMC free article] [PubMed] [Google Scholar]
- 15.Touchette E, Petit D, Tremblay RE, Boivin M, Falissard B, Genolini C, et al. Associations between sleep duration patterns and overweight/obesity at age 6. Sleep. 2008 Nov;31(11):1507–14. doi: 10.1093/sleep/31.11.1507. PubMed PMID: 19014070. Pubmed Central PMCID: PMC2579979. Epub 2008/11/19. eng. [DOI] [PMC free article] [PubMed] [Google Scholar]
- 16.Reilly JJ, Armstrong J, Dorosty AR, Emmett PM, Ness A, Rogers I, et al. Early life risk factors for obesity in childhood: cohort study. BMJ (Clinical research ed) 2005 Jun 11;330(7504):1357. doi: 10.1136/bmj.38470.670903.E0. PubMed PMID: 15908441. Pubmed Central PMCID: Pmc558282. Epub 2005/05/24. eng. [DOI] [PMC free article] [PubMed] [Google Scholar]
- 17.Hultcrantz E, Lofstrand Tidestrom B. The development of sleep disordered breathing from 4 to 12 years and dental arch morphology. Int J Pediatr Otorhinolaryngol. 2009 Sep;73(9):1234–41. doi: 10.1016/j.ijporl.2009.05.012. PubMed PMID: 19523692. Epub 2009/06/16. eng. [DOI] [PubMed] [Google Scholar]
- 18.Lavis JN, Robertson D, Woodside JM, McLeod CB, Abelson J. How can research organizations more effectively transfer research knowledge to decision makers? The Milbank quarterly. 2003;81(2):221–48. 171–2. doi: 10.1111/1468-0009.t01-1-00052. PubMed PMID: 12841049. Pubmed Central PMCID: Pmc2690219. Epub 2003/07/05. eng. [DOI] [PMC free article] [PubMed] [Google Scholar]
- 19.Mitchell JA, Rodriguez D, Schmitz KH, Audrain-McGovern J. Sleep duration and adolescent obesity. Pediatrics. 2013 May;131(5):e1428–34. doi: 10.1542/peds.2012-2368. PubMed PMID: 23569090. Pubmed Central PMCID: PMC3639456. Epub 2013/04/10. eng. [DOI] [PMC free article] [PubMed] [Google Scholar]
- 20.Haines J, McDonald J, O’Brien A, Sherry B, Bottino CJ, Schmidt ME, et al. Healthy Habits, Happy Homes: Randomized Trial to Improve Household Routines for Obesity Prevention Among Preschool-Aged Children. JAMA pediatrics. 2013 Sep 9; doi: 10.1001/jamapediatrics.2013.2356. PubMed PMID: 24019074. Epub 2013/09/11. Eng. [DOI] [PubMed] [Google Scholar]
- 21.Dev DA, McBride BA, Fiese BH, Jones BL, Cho H. Risk factors for overweight/obesity in preschool children: an ecological approach. Childhood obesity (Print) 2013 Oct;9(5):399–408. doi: 10.1089/chi.2012.0150. PubMed PMID: 24020790. Pubmed Central PMCID: Pmc3791057. Epub 2013/09/12. eng. [DOI] [PMC free article] [PubMed] [Google Scholar]
- 22.Raat H, Struijk MK, Remmers T, Vlasblom E, van Grieken A, Broeren SM, et al. Primary prevention of overweight in preschool children, the BeeBOFT study (Breastfeeding, Breakfast daily, Outside playing, Few sweet drinks, less TV viewing): design of a cluster randomized controlled trial. BMC Public Health. 2013 Oct 19;13(1):974. doi: 10.1186/1471-2458-13-974. PubMed PMID: 24138805. Pubmed Central PMCID: Pmc3840600. Epub 2013/10/22. Eng. [DOI] [PMC free article] [PubMed] [Google Scholar]
- 23.Ali NJ, Pitston D, Stradling JR. Natural history of snoring and related behaviour problems between the ages of 4 and 7 years. Archives of disease in childhood. 1994;71(1):74–6. doi: 10.1136/adc.71.1.74. [DOI] [PMC free article] [PubMed] [Google Scholar]
- 24.Bonuck K, Chervin R, Cole T, Emond A, Henderson J, Xu L, et al. Prevalence and persistence of sleep disordered breathing symptoms in young children: A 6 year population-based cohort study. Sleep. 2011;34(7):875–84. doi: 10.5665/SLEEP.1118. Epub http://www.journalsleep.org/Accepted.aspx. [DOI] [PMC free article] [PubMed] [Google Scholar]
- 25.Chervin RD, Ruzicka DL, Archbold KH, Dillon JE. Snoring predicts hyperactivity four years later. Sleep. 2005 Jul 1;28(7):885–90. doi: 10.1093/sleep/28.7.885. PubMed PMID: 16124670. Epub 2005/08/30. eng. [DOI] [PubMed] [Google Scholar]
- 26.Anuntaseree W, Kuasirikul S, Suntornlohanakul S. Natural history of snoring and obstructive sleep apnea in Thai school-age children. Pediatric Pulmonology. 2005 May;39(5):415–20. doi: 10.1002/ppul.20207. PubMed PMID: ISI:000228472800005. [DOI] [PubMed] [Google Scholar]
- 27.Eitner S, Urschitz MS, Guenther A, Urschitz-Duprat PM, Bohnhorst B, Schlaud M, et al. Sleep problems and daytime somnolence in a German population-based sample of snoring school-aged children. Journal of Sleep Research. 2007 Mar;16(1):96–101. doi: 10.1111/j.1365-2869.2007.00560.x. PubMed PMID: 17309768. [DOI] [PubMed] [Google Scholar]
- 28.Goodwin JL, Vasquez MM, Silva GE, Quan SF. Incidence and Remission of Sleep-Disordered Breathing and Related Symptoms in 6-to 17-Year Old Children-The Tucson Children’s Assessment of Sleep Apnea Study. Journal of Pediatrics. 2010 Jul;157(1):57–61. doi: 10.1016/j.jpeds.2010.01.033. PubMed PMID: ISI:000278649200016. Pubmed Central PMCID: 2886190. English. [DOI] [PMC free article] [PubMed] [Google Scholar]
- 29.Li AM, Au CT, Ng C, Lam HS, Ho CK, Wing YK. A four-year prospective follow-up study of childhood obstructive sleep apnea and its association with blood pressure. Chest. 2014 Jan 2; doi: 10.1378/chest.13-1333. PubMed PMID: 24384690. Epub 2014/01/05. Eng. [DOI] [PubMed] [Google Scholar]
- 30.Beebe DW, Rausch J, Byars KC, Lanphear B, Yolton K. Persistent Snoring in Preschool Children: Predictors and Behavioral and Developmental Correlates. Pediatrics. 2012 Sep;130(3):382–9. doi: 10.1542/peds.2012-0045. PubMed PMID: WOS:000309409300038. Pubmed Central PMCID: 3428758. [DOI] [PMC free article] [PubMed] [Google Scholar]
- 31.Biggs SN, Vlahandonis A, Anderson V, Bourke R, Nixon GM, Davey MJ, et al. Long-term changes in neurocognition and behavior following treatment of sleep disordered breathing in school-aged children. Sleep. 2014 Jan;37(1):77–84. doi: 10.5665/sleep.3312. PubMed PMID: 24470698. Pubmed Central PMCID: PMC3902882. Epub 2014/01/29. eng. [DOI] [PMC free article] [PubMed] [Google Scholar]
- 32.Cunningham SA, Kramer MR, Narayan KMV. Incidence of Childhood Obesity in the United States. New England Journal of Medicine. 2014;370(5):403–11. doi: 10.1056/NEJMoa1309753. PubMed PMID: 24476431. [DOI] [PMC free article] [PubMed] [Google Scholar]
- 33.Baidal JA, Taveras EM. Childhood obesity: shifting the focus to early prevention. Arch Pediatr Adolesc Med. 2012 Dec;166(12):1179–81. doi: 10.1001/2013.jamapediatrics.358. PubMed PMID: 23108905. Epub 2012/10/31. eng. [DOI] [PubMed] [Google Scholar]
- 34.Svensson V, Jacobsson JA, Fredriksson R, Danielsson P, Sobko T, Schioth HB, et al. Associations between severity of obesity in childhood and adolescence, obesity onset and parental BMI: a longitudinal cohort study. International journal of obesity (2005) 2011 Jan;35(1):46–52. doi: 10.1038/ijo.2010.189. PubMed PMID: 20856258. Pubmed Central PMCID: PMC3035977. Epub 2010/09/22. eng. [DOI] [PMC free article] [PubMed] [Google Scholar]
- 35.Miller AL, Kaciroti N, Lebourgeois MK, Chen YP, Sturza J, Lumeng JC. Sleep timing moderates the concurrent sleep duration-body mass index association in low-income preschool-age children. Academic pediatrics. 2014 Mar-Apr;14(2):207–13. doi: 10.1016/j.acap.2013.12.003. PubMed PMID: 24602585. Pubmed Central PMCID: PMC4004335. Epub 2014/03/08. eng. [DOI] [PMC free article] [PubMed] [Google Scholar]
- 36.Moraleda-Cibrian M, O’Brien LM. Sleep duration and body mass index in children and adolescents with and without obstructive sleep apnea. Sleep & breathing = Schlaf & Atmung. 2014 Sep;18(3):555–61. doi: 10.1007/s11325-013-0918-0. PubMed PMID: 24288006. Epub 2013/11/30. eng. [DOI] [PubMed] [Google Scholar]
- 37.Snell EK, Adam EK, Duncan GJ. Sleep and the body mass index and overweight status of children and adolescents. Child development. 2007 Jan-Feb;78(1):309–23. doi: 10.1111/j.1467-8624.2007.00999.x. PubMed PMID: 17328707. Epub 2007/03/03. eng. [DOI] [PubMed] [Google Scholar]
- 38.Hughes AR, Sherriff A, Lawlor DA, Ness AR, JJ R. Timing of Excess Weight Gain in the Avon Longitudinal Study of Parents and Children (ALSPAC) Pediatrics. 2011 Mar;127(3):e730–6. doi: 10.1542/peds.2010-0959. PubMed PMID: 21339267. Epub 21 February 2011. [DOI] [PubMed] [Google Scholar]
- 39.Bonuck K, Parikh S, Bassila M. Growth failure and sleep disordered breathing: a review of the literature. Int J Pediatr Otorhinolaryngol. 2006 May;70(5):769–78. doi: 10.1016/j.ijporl.2005.11.012. PubMed PMID: 16460816. Epub 2006/02/08. eng. [DOI] [PubMed] [Google Scholar]
- 40.Freeman K, Bonuck KA. Snoring, Mouth-breathing, and Apnea Trajectories in a Population-Based Cohort Followed from Infancy to 81 Months: A Cluster Analysis. Int J Pediatr Otorhinolaryngol [Internet] 2011 doi: 10.1016/j.ijporl.2011.10.019. [DOI] [PubMed] [Google Scholar]
- 41.Blair PS, Humphreys JS, Gringras P, Taheri S, Scott N, Emond A, et al. Childhood sleep duration and associated demographic characteristics in an English cohort. Sleep. 2012 Mar;35(3):353–60. doi: 10.5665/sleep.1694. PubMed PMID: 22379241. Pubmed Central PMCID: PMC3274336. Epub 2012/03/02. eng. [DOI] [PMC free article] [PubMed] [Google Scholar]
- 42.Howe LD, Tilling K, Galobardes B, Smith GD, Gunnell D, Lawlor DA. Socioeconomic differences in childhood growth trajectories: at what age do height inequalities emerge? J Epidemiol Community Health. 2012 Feb;66(2):143–8. doi: 10.1136/jech.2010.113068. PubMed PMID: 20724285. Pubmed Central PMCID: Pmc3245896. Epub 2010/08/21. eng. [DOI] [PMC free article] [PubMed] [Google Scholar]
- 43.Howe LD, Tilling K, Matijasevich A, Petherick ES, Santos AC, Fairley L, et al. Linear spline multilevel models for summarising childhood growth trajectories: A guide to their application using examples from five birth cohorts. Statistical methods in medical research. 2013 Oct 9; doi: 10.1177/0962280213503925. PubMed PMID: 24108269. Pubmed Central PMCID: Pmc4074455. Epub 2013/10/11. Eng. [DOI] [PMC free article] [PubMed] [Google Scholar]
- 44.Boyd A, Golding J, Macleod J, Lawlor DA, Fraser A, Henderson J, et al. Cohort Profile: the ‘children of the 90s’-- the index offspring of the Avon Longitudinal Study of Parents and Children. International journal of epidemiology. 2013 Feb;42(1):111–27. doi: 10.1093/ije/dys064. PubMed PMID: 22507743. Pubmed Central PMCID: PMC3600618. Epub 2012/04/18. eng. [DOI] [PMC free article] [PubMed] [Google Scholar]
- 45.Bryant M, Santorelli G, Fairley L, Petherick ES, Bhopal R, Lawlor DA, et al. Agreement between routine and research measurement of infant height and weight. Archives of disease in childhood. 2014 Sep 29; doi: 10.1136/archdischild-2014-305970. PubMed PMID: 25266076. Epub 2014/10/01. Eng. [DOI] [PMC free article] [PubMed] [Google Scholar]
- 46.Howe LD, Tilling K, Lawlor DA. Accuracy of height and weight data from child health records. Archives of disease in childhood. 2009 Dec;94(12):950–4. doi: 10.1136/adc.2009.162552. PubMed PMID: 19689966. Epub 2009/08/20. eng. [DOI] [PubMed] [Google Scholar]
- 47.Baugh RF, Archer SM, Mitchell RB, Rosenfeld RM, Amin R, Burns JJ, et al. Clinical Practice Guideline: Tonsillectomy in Children. Otolaryngology-Head and Neck Surgery. 2011 Jan;144(1):S1–S30. doi: 10.1177/0194599810389949. PubMed PMID: WOS:000293997100001. [DOI] [PubMed] [Google Scholar]
- 48.Marcus CL, Brooks LJ, Draper KA, Gozal D, Halbower AC, Jones J, et al. Diagnosis and management of childhood obstructive sleep apnea syndrome. Pediatrics. 2012 Sep;130(3):576–84. doi: 10.1542/peds.2012-1671. PubMed PMID: 22926173. Epub 2012/08/29. eng. [DOI] [PubMed] [Google Scholar]
- 49.Cole TJ, Lobstein T. Extended international (IOTF) body mass index cut-offs for thinness, overweight and obesity. Pediatric obesity. 2012 Aug;7(4):284–94. doi: 10.1111/j.2047-6310.2012.00064.x. PubMed PMID: 22715120. Epub 2012/06/21. eng. [DOI] [PubMed] [Google Scholar]
- 50.Roland P, Rosenfeld R, Brooks R, Friedman N, Jones J, et al. Clinical practice guideline: polysomnography for sleep-disordered breathing prior to tonsillectomy in children. Otolaryngology-Head and Neck Surgery. 2011;145(1 Suppl):S1–S15. doi: 10.1177/0194599811409837. Epub Epub 2011 Jun 15. [DOI] [PubMed] [Google Scholar]
- 51.Graversen L, Sorensen TI, Petersen L, Sovio U, Kaakinen M, Sandbaek A, et al. Preschool weight and body mass index in relation to central obesity and metabolic syndrome in adulthood. PloS one. 2014;9(3):e89986. doi: 10.1371/journal.pone.0089986. PubMed PMID: 24595022. Pubmed Central PMCID: PMC3940896. Epub 2014/03/07. eng. [DOI] [PMC free article] [PubMed] [Google Scholar]
- 52.Moss BG, Yeaton WH. U.S. children’s preschool weight status trajectories: patterns from 9-month, 2-year, and 4-year Early Childhood Longitudinal Study-Birth cohort data. American journal of health promotion: AJHP. 2012 Jan-Feb;26(3):172–5. doi: 10.4278/ajhp.100304-ARB-73. PubMed PMID: 22208415. Epub 2012/01/03. eng. [DOI] [PubMed] [Google Scholar]
- 53.Singh AS, Mulder C, Twisk JW, van Mechelen W, Chinapaw MJ. Tracking of childhood overweight into adulthood: a systematic review of the literature. Obesity reviews: an official journal of the International Association for the Study of Obesity. 2008 Sep;9(5):474–88. doi: 10.1111/j.1467-789X.2008.00475.x. PubMed PMID: 18331423. Epub 2008/03/12. eng. [DOI] [PubMed] [Google Scholar]
- 54.Chervin R, Hedger K, Dillon J, Pituch K. Pediatric Sleep Questionnaire: validity and reliability of scales for sleep-disordered breathing, snoring, sleepiness, and behavioral problems. Sleep Med. 2000 Feb 1;1(1):21–32. doi: 10.1016/s1389-9457(99)00009-x. PubMed PMID: 10733617. [DOI] [PubMed] [Google Scholar]
- 55.Papaioannou G, Kambas I, Tsaoussoglou M, Panaghiotopoulou-Gartagani P, Chrousos G, Kaditis AG. Age-dependent changes in the size of adenotonsillar tissue in childhood: implications for sleep-disordered breathing. The Journal of pediatrics. 2013 Feb;162(2):269–74. e4. doi: 10.1016/j.jpeds.2012.07.041. PubMed PMID: 22939928. Epub 2012/09/04. eng. [DOI] [PubMed] [Google Scholar]
- 56.Carroll JL, McColley SA, Marcus CL, Curtis S, Loughlin GM. Inability of clinical history to distinguish primary snoring from obstructive sleep apnea syndrome in children. Chest. 1995 Sep;108(3):610–8. doi: 10.1378/chest.108.3.610. PubMed PMID: 7656605. Epub 1995/09/01. eng. [DOI] [PubMed] [Google Scholar]
- 57.Spruyt K, Gozal D. Pediatric sleep questionnaires as diagnostic or epidemiological tools: A review of currently available instruments. Sleep medicine reviews. 2011 Feb;15(1):19–32. doi: 10.1016/j.smrv.2010.07.005. PubMed PMID: ISI:000287271600004. [DOI] [PMC free article] [PubMed] [Google Scholar]
- 58.De Luca Canto G, Singh V, Major MP, Witmans M, El-Hakim H, Major PW, et al. Diagnostic capability of questionnaires and clinical examinations to assess sleep-disordered breathing in children: a systematic review and meta-analysis. Journal of the American Dental Association (1939) 2014 Feb;145(2):165–78. doi: 10.14219/jada.2013.26. PubMed PMID: 24487608. Epub 2014/02/04. eng. [DOI] [PubMed] [Google Scholar]
- 59.Patel SR, Hu FB. Short sleep duration and weight gain: a systematic review. Obesity (Silver Spring, Md) 2008 Mar;16(3):643–53. doi: 10.1038/oby.2007.118. PubMed PMID: 18239586. Pubmed Central PMCID: PMC2723045. Epub 2008/02/02. eng. [DOI] [PMC free article] [PubMed] [Google Scholar]
- 60.Bonuck K, Freeman K, Chervin R, Xu L. Sleep Disordered Breathing in a Population-Based Cohort: Behavioral Effects at 4 and 7 Years. Pediatrics. 2012;129(4):e857–65. doi: 10.1542/peds.2011-1402. Epub 2012 Mar 5. [DOI] [PMC free article] [PubMed] [Google Scholar]
- 61.Bonuck K, Rao T, Xu L. Pediatric Sleep Disorders and Special Educational Need at 8 Years: A Population-Based Cohort Study. Pediatrics. 2012 Jun;130(4):1439–45. doi: 10.1542/peds.2012-0392. PubMed PMID: 19482752. Epub 3 September 2012. [DOI] [PMC free article] [PubMed] [Google Scholar]