Abstract
Altered serum proline levels are related to cancer metabolism. This study developed and validated a LC-MS/MS method to analyze proline in human serum. Surrogate blank serum, coupled with stable isotope L-proline-13C5,15N as internal standard, were used for generating standard curves ranging from 2.5 – 100 μg/mL. Proline was extracted from serum samples using methanol. A Phenomenex Lux 5u Cellulose-1 column (250 × 4.6 mm) was used for chromatographic separation with 40% methanol in 0.05% formic acid aqueous solution as a mobile phase. Mass detection was performed under positive ionization electrospray. Intra- and inter-day accuracy and precision were less than 10%. The extraction recovery and matrix factor were 99.17% and 1.47%, respectively. Our study showed that the chiral column had high specificity and selectivity for separating proline from serum components. The assay was successfully applied for the quantification of human serum proline levels from 30 esophageal cancer patients and 30 healthy volunteers. Statistical analyses showed significantly lower levels of serum proline in the patients as compared to the healthy volunteers (P value = 0.011). We report here, a simple, specific, and reproducible LC-MS/MS method for the quantification of proline in human serum was as a potential screening biomarker for esophageal cancer.
Keywords: proline, LC-MS/MS, serum, biomarker, esophageal cancer
Introduction
Proline, which is actually an imino acid, is usually recognized as one of the 20 amino acid commonly appears in animal proteins. In mammalian proteins, only the L form (L-proline) can be found. Since it can be synthesized in the human body, it is not an essential amino acid. This amino acid is one of the most abundant amino acids in the cellular microenvironment, together with hydroxiproline, it constitutes around 25% of residues in collagen, the main protein in extracellular matrix (Liu et al., 2012).
The role of amino acids has been recently highlighted by multiple metabolomics studies showing the alteration of amino acid serum concentrations in different diseases including cancer (Scioscia et al., 1998). Moreover, latest studies have suggested the importance of proline metabolism and its relationship with cancer (Phang and Liu, 2012, Phang et al., 2012), and altered patterns of proline levels have been found in patients with renal cell cancer (Catchpole et al., 2011, Mustafa et al., 2011), oral cancer (Tiziani et al., 2009), colorectal cancer (Qiu et al., 2009), and high risk individuals of esophageal cancer (EAC) (Zhang et al., 2012). Therefore, a deeper study of the exact role of this metabolite in cancer patients and the development of suitable assays for its quantification in a non-invasive manner using serum samples is needed.
Through literature search, we found several previously reported chromatographic methods that can determine proline in biologic fluids. The traditional methods, using ion-exchange chromatographic (IEC) separation and ninhydrin detection (Le Boucher et al., 1997, Moore et al., 1958), were time consuming (the retention time of proline was reported to be 87.82 min (Le Boucher et al., 1997). Other methods were developed by using either high performance liquid chromatography (HPLC) with fluorescence detection (Inoue et al., 1995, Schwarz et al., 2005, Wu, 1993) or gas chromatography–mass spectrometry (GC-MS) (Husek 1991, Namera et al., 2002). All of those methods required pre-column derivatization, which was time consuming and labor intensive in sample preparation. Armstrong et al. (2007) developed a liquid chromatography–mass spectrometry (LC-MS) method that can determine proline in human plasma without derivatization, and can analyze 25 common amino acids simultaneously; however, their calibration standards were prepared in solution instead of biological fluids, which did not comply with FDA’s requirement for bioanalytical method. In summary, all of those currently available methods were not suitable for clinical studies with a large sample size.
Therefore this work was designed to develop a rapid, simple, specific, and reliable LC-MS/MS method to quantify proline concentration in human serum; and apply this method to conduct an exploratory analysis in a subset of EAC serum samples and healthy controls, and evaluate its potential role as biomarker for screening and diagnosis of this type of cancer.
Materials and methods
Chemicals and reagents
L-proline (≥ 99.5% pure), L-proline-13C5,15N (98 atom % 13C, 98 atom % 15N, 95% pure, internal standard, IS), bovine serum albumin (BSA), phosphate buffered saline (PBS), formic acid, and HPLC grade methanol and water were purchased from Sigma-Aldrich (St. Louis, MO).
Standards and quality controls
Stock solutions of proline (10 mg/mL) and IS (2 mg/mL) were prepared individually by dissolving each substance in water, and stored at 4°C until used. A series of standard samples of proline were prepared by diluting the stock solution with water and then spiking in surrogate blank serum (4% BSA in PBS) to obtain the following concentrations: 2.5, 5, 10, 25, 50, 75, and 100 μg/mL. The low, medium, and high concentration levels of quality control (QC) samples were prepared by the same method as the standards at 4, 40, and 80 μg/mL, respectively.
Sample extraction
An aliquot (50 μL) of standard, QC, or human serum sample was first mixed with 50 μL of working IS solution (25 μg/mL in water). The mixture was then mixed, extracted, and deproteinized with 500 μL of methanol by vortexing for 30 sec. Followed by centrifugation for 15 min at 13,000 rpm at room temperature, an aliquot of the supernatant was taken for LC-MS/MS analysis.
Chromatographic conditions
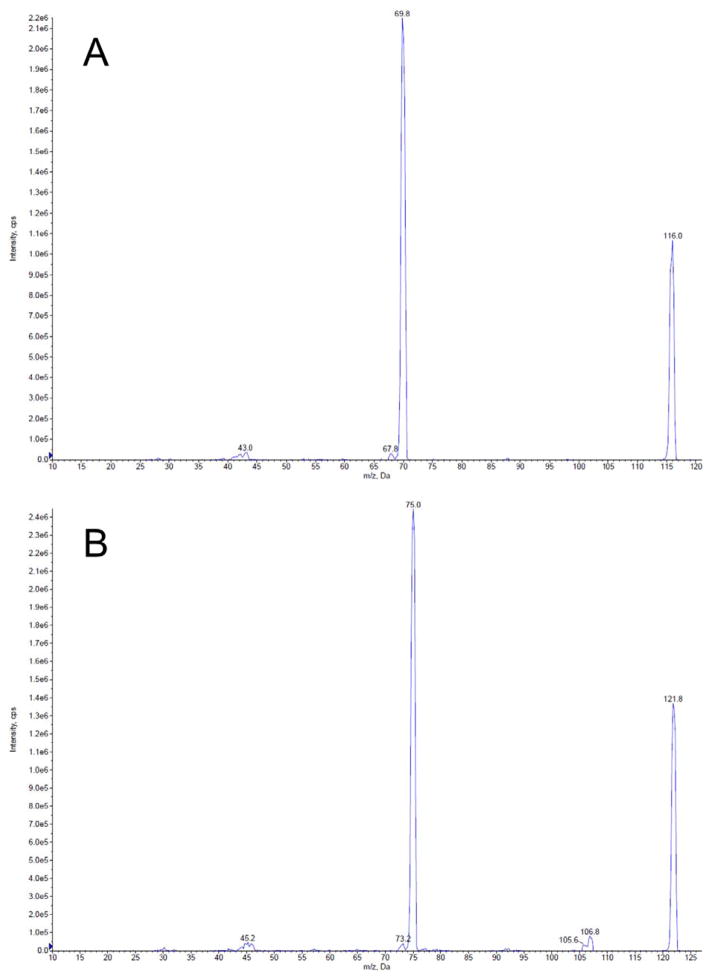
The chromatographic separation was achieved by an Agilent 1200 series HPLC (Forster City, CA) equipped with a Phenomenex Lux 5u Cellulose-1 column (250 × 4.6 mm, Torrance, CA) with 40% methanol in 0.05% formic acid aqueous solution as a mobile phase at flow rate of 0.8 mL/min at ambient temperature. Each sample injection volume was 5 μL. The chromatographic analysis was performed by an API 3200 QTRAP triple quadrupole mass spectrometer with a Turbo Ion Spray ion source (Applied Biosystem/MDS SCIEX, Foster City, CA). The quantification was performed by multiple reaction monitoring (MRM) at positive mode to detect the specific precursor to product ion transitions m/z 116 → m/z 70 for proline, and m/z 122 → m/z 75 for IS. The compound dependent parameters for proline and IS were listed in Table 1. The source parameters were set as follows: ionspray voltage, 4500 V; ion source temperature, 650 °C; nebulizer gas, 60 psi; heater gas, 55 psi; curtain gas, 10 psi; and the collision gas, medium. The LC-MS/MS system was controlled and data was acquired by Analyst software version 1.5. Figure 1 shows the product ion scan spectra of proline and IS.
Table 1.
Compound dependent parameters for Proline and IS in MRM mode for LC-MS/MS analysis.
| Parameters | Proline | IS |
|---|---|---|
| Q1 Mass (U) | 116.0 | 122.0 |
| Q3 Mass (U) | 70.1 | 75.0 |
| Dwell Time (ms) | 200 | 200 |
| DP* (V) | 41 | 31 |
| EP* (V) | 7.5 | 12 |
| CEP* (V) | 12 | 10 |
| CE* (V) | 21 | 19 |
| CXP* (V) | 4 | 4 |
DP = declustering potential; EP = entrance potential; CEP = collision cell entrance potential; CE = collision cell; CXP = collision cell exit potential.
Figure 1.
The product ion scan spectra for (A) L-Proline and (B) L-Proline-13C5,15N (IS).
Equivalency between surrogate and real human serum
To test the equivalency between surrogate matrix and real human serum, a set of three QC samples at high concentration level were prepared in human serum. The equivalency was calculated according to Eq. 1:
| (1) |
where Responseserum spike is the peak area count for proline spiked high QC sample in human serum, Responseserum is the peak area count for proline in “blank” human serum, and Responsesurrogate spike is the peak area count for proline spiked high QC sample in surrogate serum.
Validation
The assay validation conducted in this work was based on FDA’s requirement described in its “Guidance for Industry: Bioanalytical Method Validation”.
Calibration curve, lower limit of quantification (LLOQ), and upper limit of quantitation (ULOQ)
Calibration curves in surrogate serum were created by plotting the peak area ratio of proline to IS against the known concentrations of the proline. The least-squares linear regression method with 1/x2 weighting was applied to generate the slope, intercept, and correlation coefficient of each linear regression equation. Since proline is an endogenous compound, both of the LLOQ and ULOQ were determined based on the normal endogenous proline level in human serum.
Extraction recovery and matrix effect
To examine the extraction recovery and matrix effect, the QC samples at three concentration levels were evaluated. The extraction recovery was calculated according to Eq. 2:
| (2) |
where Responsepre-extraction spike is the mean peak area count for proline samples been through the extraction process, and Responsepost-extraction spike is for proline spiked into extracted matrix after the extraction procedure. The matrix factor was calculated according to Eq. 3:
| (3) |
where Responsepost-extraction spike is the mean peak area count for the proline spiked into extracted matrix after the extraction procedure, and Responsematrix-free spike is for the same concentration of proline in water. Experiments were conducted in triplicate.
Accuracy and precision
The intra- or inter-day accuracy and precision of the LC-MS/MS method were evaluated by analyzing the QC samples via calibration curves created on the same day or three different days. In order to analyze sample with an even higher concentration, samples with proline concentration of 400 or 800 μg/mL were diluted 5 or 10 times before analysis, and evaluated for accuracy and precision. Experiments were conducted in sextuplicate.
Stability
Stock solution stability
The stock solution stability was determined by compare two sets of samples: one set was obtained from a freshly prepared stock solution; another set was obtained from a stock solution which was prepared 2 month ago and stored at 4 °C. Experiments were conducted in triplicate.
Short-term (bench-top) stability
Three sets of proline QC samples in pooled human serum were freshly prepared and left on the bench-top at room temperature for 4, 8, or 24 h, respectively. And all the samples were compared with freshly prepared samples at the same concentrations. Experiments were conducted in triplicate.
Freeze-thaw stability
Proline QC samples prepared in pooled human serum which were exposed for three cycles of freeze (at −80 °C) and thaw (room temperature) were compared with freshly prepared samples at the same concentrations. Experiments were conducted in triplicate.
Processed sample stability
The stability of processed sample was determined by compare freshly obtained serum extracts to ones remained in the auto sampler for 24 h at room temperature. Experiments were conducted in triplicate.
Long-term storage stability
A set of proline QC samples in pooled human serum were freshly prepared and stored at −80 °C for 14 days. And all the samples were compared with freshly prepared samples at the same concentrations. Experiments were conducted in triplicate.
Assay application in quantification of clinical human serum samples
This validated LC-MS/MS method was applied to quantify the proline concentrations in a set of 60 serum samples comprising EAC patients (n = 30) and healthy controls (n = 30) matched by age and gender. These clinical samples were received from MD Anderson Cancer Center. All cases were newly diagnosed, histologically confirmed patients with esophageal adenocarcinoma who had not received chemotherapy or radiotherapy before recruitment. Individuals for the control group who had no prior history of cancer were identified from Kelsey-Seybold Clinic, The protocol was approved by the institutional review board (IRB) at Texas Southern University. Differences in the host characteristics between cases and controls were evaluated by Pearson χ2 test. After quantification and quality control analyses, Wilcoxon rank-sum test was used to compare the proline concentration levels between the EAC cases and healthy controls. All analyses were done using STATA (StataCorp LP, College Station, TX) and P values less than 0.05 considered as statistically significant.
Results and discussion
Chromatography
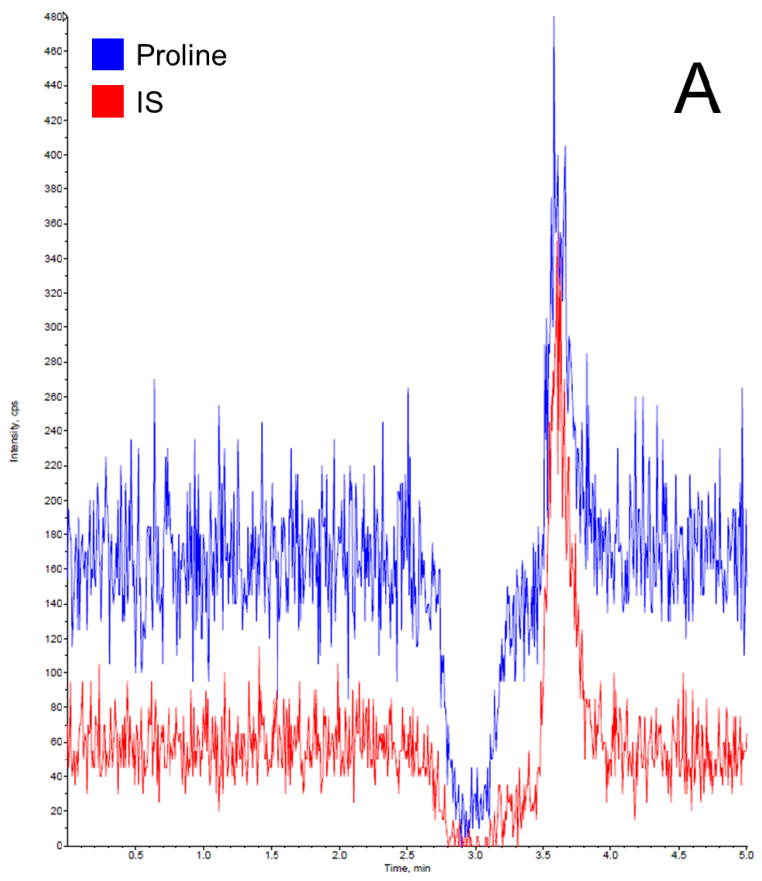
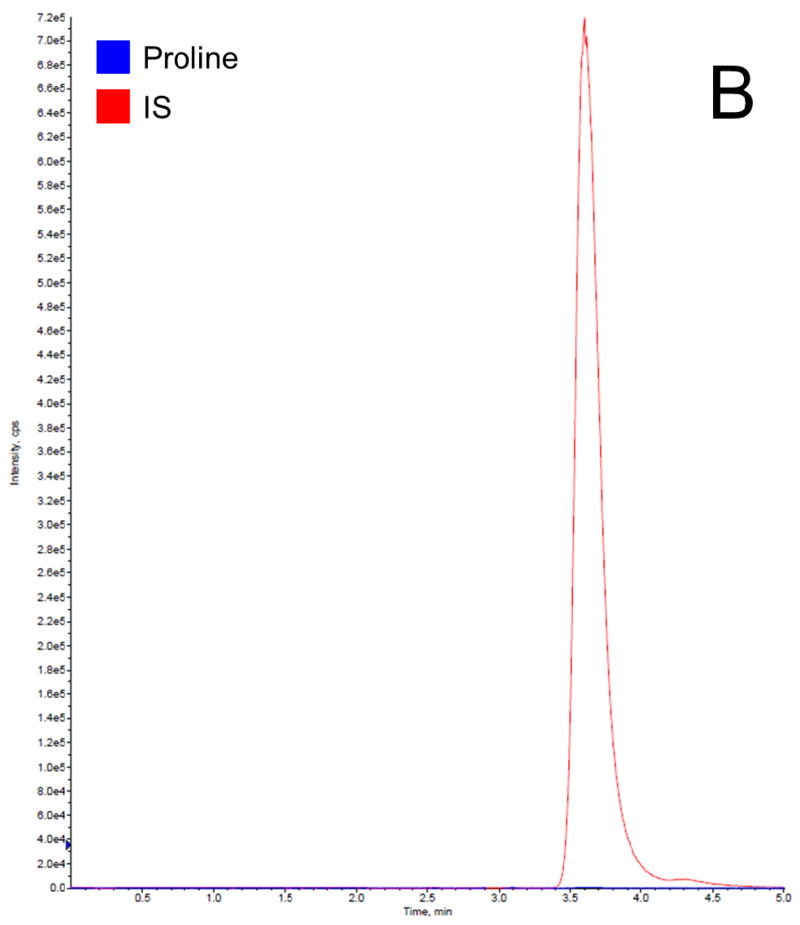
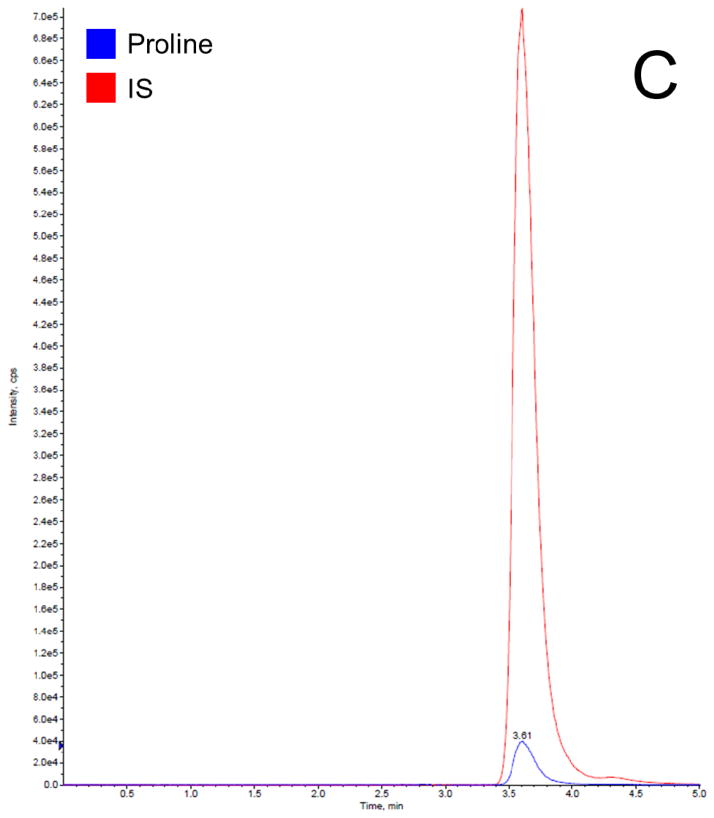
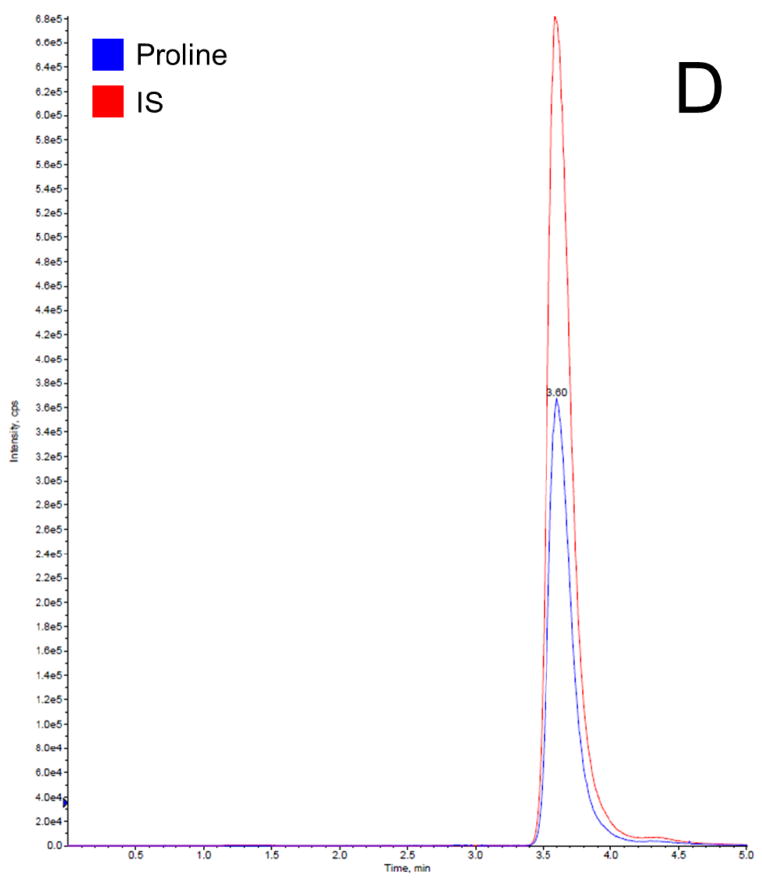
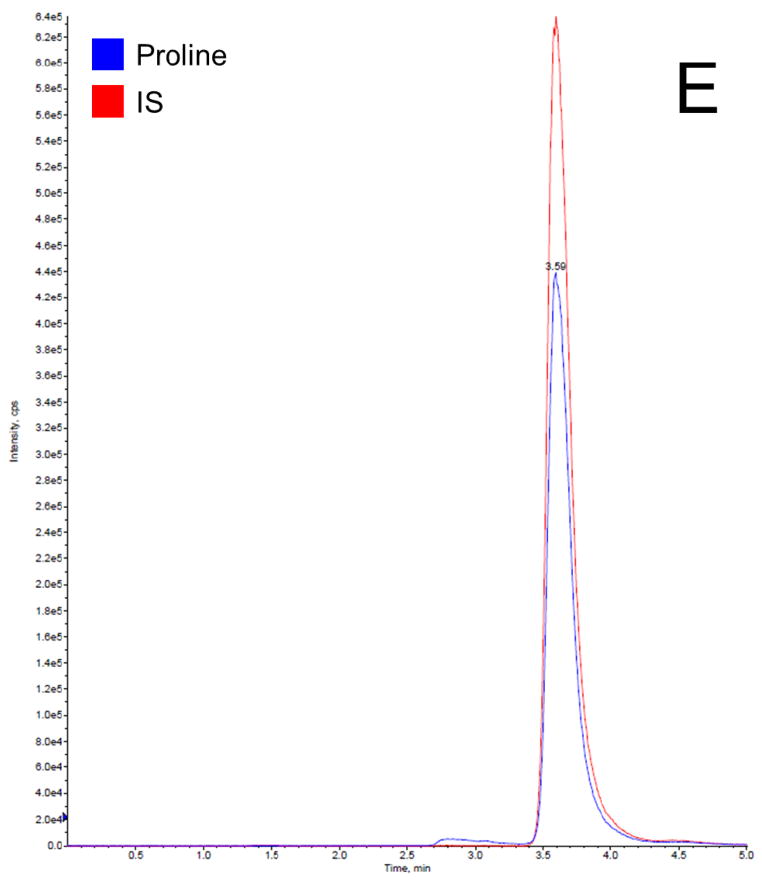
Before getting into the Phenomenex Lux 5u Cellulose-1 column, which is normally used in separation of enantiomers and racemic mixtures, we have tried the following columns: Waters XTerra MS C18 column (3.5 μm, 4.6 ×150 mm, Milford, MA), EMD Millipore SeQuant ZIC-HILIC column (3.5 μm, 4.6 × 150 mm, Billerica, MA), and Phenomenex Luna 5u NH2 column (250 × 4.6 mm, Torrance, CA). We found that C18 column did not provide a satisfactory retention time to separate proline and IS from the serum matrix, resulting significant matrix effect; HILIC and NH2 column provided good retention times for separation, but both resulted broader peaks compared to cellulose column. Therefore, the Phenomenex Lux 5u Cellulose-1 column was selected in this work because it provided a satisfactory retention time to separate proline and IS from the serum matrix and sharp peaks. The mobile phase composition was selected based on suggestions from the column’s user manual. The total run time for each chromatographic analysis was 5 min. The retention time for both proline and IS was 3.6 min. In this work, a stable isotope of proline was selected as the IS, which is the best choice for a LC-MS/MS analysis, because it can effectively compensate for variability such as in ionization efficiency, stability, and extraction recovery. Figure 2 shows typical chromatogram representatives from: (A) blank surrogate serum, (B) blank surrogate serum spiked with the IS only, (C) blank surrogate serum spiked with proline (2.5 μg/mL) and the IS, (D) blank surrogate serum spiked with proline (25 μg/mL) and the IS, and (E) a human serum sample. The data further demonstrated that: this rapid method was suitable to apply in a study with a large sample size; the baseline was very clean, no interferential peak appears; and the assay base on the selection of a stable isotope as the IS were consistent and reproducible.
Figure 2.
Representative LC-MS/MS chromatograms for (A) blank surrogate serum, (B) blank surrogate serum spiked with the IS only, (C) blank surrogate serum spiked with proline (2.5 μg/mL) and the IS, (D) blank surrogate serum spiked with proline (25 μg/mL) and the IS, and (E) a human serum sample.
Equivalency between surrogate and real human serum
The average equivalency determined according to Eq. 1 was 97.49%. This result proved that surrogate serum was equivalent to real human serum in this LC-MS/MS analysis of proline.
Linearity, LLOQ, and ULOQ
The linearity of the calibration curves was established over the concentration range of 2.5 – 100 μg/mL with correlation coefficient values > 0.999. Since proline is endogenous compound, and the concentration of free proline in normal human serum was reported to be 15.8 – 29.1 μg/mL (Inoue et al., 1995), the LLOQ selected in this work was 2.5 μg/mL, which was more than 6 times lower than the normal level. The ULOQ of the calibration curves selected was 100 μg/mL, which was more than 3 times higher than the normal level.
Extraction recovery and matrix effect
The average extraction recovery rate determined by measuring QC samples at three different concentration levels of proline were 99.20%, 98.06%, and 100.25%, respectively. The average matrix factor determined by measuring QC samples at three different concentration levels of proline were 0.54%, 1.73%, and 2.15%, respectively. Those data indicated that: the simple onestep protein precipitation method yielded very high and stable extraction recovery; the protein precipitation method plus the use of Phenomenex Lux 5u Cellulose-1 column resulted in no measurable matrix effect.
Accuracy and precision
The intra- or inter-day accuracy (present as relative error) and precision (present as coefficient of variation) of the assay were excellent (within the 15% acceptance range, results are summarized in Table 2). Those data indicated that the developed LC-MS/MS method was validated to be accurate and precise in analysis of human serum samples with proline concentration from 2.5 to 100 μg/mL. As mentioned previously, the ULOQ of the calibration curves selected was more than 3 times higher than the normal level. However, in order to cover the extraordinary cases which have abnormal higher proline level, the accuracy and precision in analysis of diluted samples were evaluated: accuracy and precision for 5 times dilution were 2.50% and 5.57%, respectively; for 10 times were 1.23% and 0.37%, respectively. Those results showed that this method can be used in determine of samples with abnormal higher proline concentration upon 5 or 10 times dilution.
Table 2.
Intra- and inter-day accuracy and precision of proline LC-MS/MS analysis.
| Concentration (μg/mL) | Intra-day (n=6) | Inter-day (n = 6) | ||
|---|---|---|---|---|
| Accuracy (RE*, %) | Precision (CV*, %) | Accuracy (RE, %) | Precision (CV, %) | |
| 4 | 1.08 | 0.85 | 6.83 | 1.04 |
| 40 | 2.42 | 1.08 | 2.83 | 1.28 |
| 80 | 0.69 | 0.67 | 1.06 | 1.27 |
RE = relative error; CV = coefficient of variation.
Stability
Stock solution stability
The samples obtained from the stock solution stored at 4 °C for over 2 month displayed an average of 97.5% of proline compare to the samples obtained from the freshly prepared stock solution, which suggested that the proline stock solution was stable at 4 °C at least for 2 month.
Short-term (bench-top) stability
Three sets of QC samples in pooled human serum displayed 97.3%, 98.5%, and 96.8% average proline amount remaining after 4, 8, or 24 h, respectively. These data showed that proline in human serum was stable at room temperature on the bench-top at least for 24 h.
Freeze-thaw stability
This set of QC samples prepared in pooled human serum displayed 97.4% average proline amount remaining, which suggested that proline in human serum was stable after three freeze-thaw cycles.
Processed sample stability
The serum extracts that remained on the bench-top for 24 h at room temperature displayed an average of 101.5% of proline compare to the freshly prepared ones, which indicated that the processed proline serum extracts were stable at room temperature at least for 24 h.
Long-term storage stability
This set of QC samples in pooled human serum displayed 95.8% average proline amount remaining, which indicated that proline in human serum was stable in the −80 °C freezer at least for 14 days.
Clinical studies
In this study, we analyzed the serum proline metabolite levels from 30 EAC patients and 30 healthy controls matched by age and gender using the developed method. Proline data were pooled for comparison and analyzed by Wilcoxon rank-sum test. Concentration range levels of proline were 14.40 to 72.80 μg/ml in controls and 14.40 to 39.50 μg/ml in EAC cases. We observed that proline levels were significantly lower in cases than in controls. The mean ± SD of proline levels were 24.93 ±7.19 μg/mL versus 31.09 ±11.00 μg/mL (P value = 0.011) for cases and controls, respectively. Our data is in agreement with previously reported studies, where significant differently lower levels of proline have been observed in serum samples of renal cell carcinoma (Mustafa et al., 2011), oral cancer (Tiziani et al., 2009), and colorectal cancer (Qiu et al., 2009). It is worth to note that no significance in proline levels was found in previous studies in EAC, despite decreased levels in high risk individuals of EAC were observed when compared to controls (Zhang et al., 2012). The lower level of proline was believed to be an indication of overutilization of amino acids in the tumor tissue as suggested previous studies.
Conclusions
In conclusion, we have developed a rapid, simple, specific, and reliable LC-MS/MS method for the quantification of proline in human serum that is suitable for clinical sample analysis. This method was validated to be accurate and precise over the concentration range of 2.5 – 100 μg/mL. To our knowledge, this is the first specific individual LC-MS/MS method developed and applied for quantification of proline concentration levels in clinical human serum samples. More importantly, this assay introduced a new approach to the analysis of amino acids by using LC-MS/MS with selecting a stable isotope as IS and preparing standard samples in blank surrogate serum. We have performed a serum metabolic analysis to test the hypothesis if distinct metabolite proline levels are present in EAC samples. This study provides preliminary evidence that EAC patients have significantly lower proline levels as compared to the healthy controls, suggesting that proline levels may prove to be a useful marker of screening and diagnosis of this disease. These results are promising, but further validation studies in larger and independent series of patient samples are necessary and ongoing.
Acknowledgments
This study was funded by National Institute of Health grants CA111922, 5SC3GM102018, 5G12RR003045-21, and support from the Premalignant Genome Atlas program of the Duncan Family Institute for Cancer Prevention and Risk Assessment at The University of Texas MD Anderson Cancer Center. Additional funding was provided by the MD Anderson Research Trust and MD Anderson institutional support for the Center for Translational and Public Health Genomics.
References
- Armstrong M, Jonscher K, Reisdorph NA. Analysis of 25 underivatized amino acids in human plasma using ion-pairing reversed-phase liquid chromatography/time-of-flight mass spectrometry. Rapid Commun Mass Spectrom. 2007;21(16):2717–26. doi: 10.1002/rcm.3124. [DOI] [PubMed] [Google Scholar]
- Catchpole G, Platzer A, Weikert C, Kempkensteffen C, Johannsen M, Krause H, Jung K, Miller K, Willmitzer L, Selbig J, Weikert S. Metabolic profiling reveals key metabolic features of renal cell carcinoma. Journal of Cellular and Molecular Medicine. 2011;15(1):109–18. doi: 10.1111/j.1582-4934.2009.00939.x. [DOI] [PMC free article] [PubMed] [Google Scholar]
- Husek P. Amino acid derivatization and analysis in five minutes. FEBS Letters. 1991;280(2):354–6. doi: 10.1016/0014-5793(91)80330-6. [DOI] [PubMed] [Google Scholar]
- Inoue H, Moritani K, Date Y, Kohashi K, Tsuruta Y. Determination of free hydroxyproline and proline in human serum by high-performance liquid chromatography using 4-(5,6-dimethoxy-2-phthalimidinyl)phenylsulfonyl chloride as a pre-column fluorescent labelling reagent. Analyst. 1995;120(4):1141–5. doi: 10.1039/an9952001141. [DOI] [PubMed] [Google Scholar]
- Le Boucher J, Charret C, Coudray-Lucas C, Giboudeau J, Cynober L. Amino acid determination in biological fluids by automated ion-exchange chromatography: performance of Hitachi L-8500A. Clinical Chemistry. 1997;43(8 Pt 1):1421–8. [PubMed] [Google Scholar]
- Liu W, Glunde K, Bhujwalla ZM, Raman V, Sharma A, Phang JM. Proline oxidase promotes tumor cell survival in hypoxic tumor microenvironments. Cancer Research. 2012;72(14):3677–86. doi: 10.1158/0008-5472.CAN-12-0080. [DOI] [PMC free article] [PubMed] [Google Scholar]
- Liu W, Le A, Hancock C, Lane AN, Dang CV, Fan TW, Phang JM. Reprogramming of proline and glutamine metabolism contributes to the proliferative and metabolic responses regulated by oncogenic transcription factor c-MYC. Proceedings of the National Academy of Sciences of the United States of America. 2012;109(23):8983–8. doi: 10.1073/pnas.1203244109. [DOI] [PMC free article] [PubMed] [Google Scholar]
- Liu Y, Borchert GL, Surazynski A, Phang JM. Proline oxidase, a p53-induced gene, targets COX-2/PGE2 signaling to induce apoptosis and inhibit tumor growth in colorectal cancers. Oncogene. 2008;27(53):6729–37. doi: 10.1038/onc.2008.322. [DOI] [PMC free article] [PubMed] [Google Scholar]
- Moore S, Spackman DH, Stein WH. Automatic recording apparatus for use in the chromatography of amino acids. Federation Proceedings. 1958;17(4):1107–15. [PubMed] [Google Scholar]
- Mustafa A, Gupta S, Hudes GR, Egleston BL, Uzzo RG, Kruger WD. Serum amino acid levels as a biomarker for renal cell carcinoma. Journal of Urology. 2011;186(4):1206–12. doi: 10.1016/j.juro.2011.05.085. [DOI] [PMC free article] [PubMed] [Google Scholar]
- Namera A, Yashiki M, Nishida M, Kojima T. Direct extract derivatization for determination of amino acids in human urine by gas chromatography and mass spectrometry. Journal of Chromatography B, Analytical Technologies in the Biomedical and Life Sciences. 2002;776(1):49–55. doi: 10.1016/s1570-0232(02)00075-2. [DOI] [PubMed] [Google Scholar]
- Phang JM, Liu W. Proline metabolism and cancer. Frontiers in Bioscience (Landmark Edition) 2012;17:1835–45. doi: 10.2741/4022. [DOI] [PMC free article] [PubMed] [Google Scholar]
- Phang JM, Liu W, Hancock C, Christian KJ. The proline regulatory axis and cancer. Frontiers in Oncology. 2012;2:60. doi: 10.3389/fonc.2012.00060. [DOI] [PMC free article] [PubMed] [Google Scholar]
- Qiu Y, Cai G, Su M, Chen T, Zheng X, Xu Y, Ni Y, Zhao A, Xu LX, Cai S, Jia W. Serum metabolite profiling of human colorectal cancer using GC-TOFMS and UPLC-QTOFMS. Journal of Proteome Research. 2009;8(10):4844–50. doi: 10.1021/pr9004162. [DOI] [PubMed] [Google Scholar]
- Schwarz EL, Roberts WL, Pasquali M. Analysis of plasma amino acids by HPLC with photodiode array and fluorescence detection. Clinica Chimica Acta. 2005;354(1–2):83–90. doi: 10.1016/j.cccn.2004.11.016. [DOI] [PubMed] [Google Scholar]
- Scioscia KA, Snyderman CH, Wagner R. Altered serum amino acid profiles in head and neck cancer. Nutrition and Cancer. 1998;30(2):144–7. doi: 10.1080/01635589809514654. [DOI] [PubMed] [Google Scholar]
- Tiziani S, Lopes V, Gunther UL. Early stage diagnosis of oral cancer using 1H NMR-based metabolomics. Neoplasia. 2009;11(3):269–76. 4. doi: 10.1593/neo.81396. following 269. [DOI] [PMC free article] [PubMed] [Google Scholar]
- Wu G. Determination of proline by reversed-phase high-performance liquid chromatography with automated pre-column o-phthaldialdehyde derivatization. Journal of Chromatography A. 1993;641(1):168–175. doi: 10.1016/s0021-9673(01)90673-9. http://dx.doi.org/10.1016/0021-9673(93)83471-4. [DOI] [PubMed] [Google Scholar]
- Zhang J, Bowers J, Liu L, Wei S, Gowda GA, Hammoud Z, Raftery D. Esophageal cancer metabolite biomarkers detected by LC-MS and NMR methods. PLoS One. 2012;7(1):e30181. doi: 10.1371/journal.pone.0030181. [DOI] [PMC free article] [PubMed] [Google Scholar]


