Abstract
Chondrogenic differentiation of mesenchymal stem cells is strongly influenced by the surrounding chemical and structural milieu. Since the majority of the native cartilage extracellular matrix is composed of nanofibrous collagen fibrils, much of recent cartilage tissue engineering research has focused on developing and utilizing scaffolds with similar nanoscale architecture. However, current literature lacks consensus regarding ideal fiber diameter, with differences in culture conditions making it difficult to compare between studies. Here, we aimed to develop a more thorough understanding of how cell-cell and cell-biomaterial interactions drive in vitro chondrogenic differentiation of bone marrow-derived mesenchymal stem cells (MSCs). Electrospun poly(ε-caprolactone) microfibers (4.3±0.8μm diameter, 90 μm2 pore size) and nanofibers (440±20 nm diameter, 1.2 μm2 pore size), were seeded with MSCs at initial densities ranging from 1×10⁵ to 4×10⁶ cells/cm3-scaffold and cultured under transforming growth factor-β (TGF-β) induced chondrogenic conditions for 3 or 6 weeks. Chondrogenic gene expression, cellular proliferation, as well as sulfated glycosaminoglycan and collagen production was enhanced on microfiber in comparison to nanofiber scaffolds, with high initial seeding densities being required for significant chondrogenic differentiation and extracellular matrix deposition. Both cell-cell and cell-material interactions appear to play important roles in chondrogenic differentiation of MSCs in vitro and consideration of several variables simultaneously is essential for understanding cell behavior in order to develop an optimal tissue engineering strategy.
Keywords: Mesenchymal stem cells, chondrogenesis, electrospinning, fibrous scaffolds, biomaterials
1. Introduction
Conservative estimates find that nearly 14% of the United States population over the age of 25 is affected by osteoarthritis and as the population continues to age, the prevalence is predicted to increase [1,2]. The limited intrinsic healing capacity of articular cartilage and lack of successful reparative or regenerative techniques has left total joint arthroplasty as the mainstay of treatment for severe osteoarthritis over the past several decades. While relatively successful in reducing pain and improving overall quality of life [3–5], patients undergoing total joint procedures still suffer decreased functional abilities in comparison to healthy individuals[3]. Furthermore, the failure rate of implants is 6% for 5 years and 12% for 10 years[6], and requires another surgery for revision. Due to the large health and economic burden and limited efficacy of current treatment methods, development of a functional tissue engineered cartilage construct may lead to a significant improvement in outcome for patients with osteoarthritis.
The often practiced paradigm for tissue engineering involves seeding cells onto biocompatible scaffolds and providing biochemical and/or biomechanical cues that drive cells towards a desired phenotype and stimulate them to secrete extracellular matrix (ECM) proteins to form a new and functional tissue replacement. In the native tissue environment, the complex and dynamic interactions that occur between cells and the ECM directly control tissue structure and composition. The ECM provides not only the tissue's mechanical strength, but also essential topographical and biochemical cues that direct cell behaviors including migration, proliferation and differentiation[7]. Therefore, utilizing scaffolds that mimic the native ECM architecture may improve tissue formation in vitro.
In articular cartilage, collagen makes up nearly 60% of the dry weight of the tissue and plays an important role in providing the mechanical properties needed in a load bearing tissue [8]. The fibrils found in articular cartilage typically range from 40 to 640 nm in diameter[9], and therefore many recent investigations have focused on utilizing nanofibrous scaffolds derived either from synthetic or natural materials that have fiber diameters less than 1μm. However, it is currently unclear whether nanofibers provide the optimal scaffold architecture or if other experimental factors are more important for successful cartilage tissue engineering. Therefore, examination of cell behavior on scaffolds with different fiber diameters in conjunction with other experimental variables may enhance understanding of what conditions are ideal for generating a tissue engineered cartilage construct.
Electrospinning is an inexpensive and versatile technique that has become popular for fabrication of nanofiber and microfiber scaffolds. Several studies have examined the effects of electrospun scaffold fiber diameter on different cell types and tissue applications including bone[10–13], nerve[14–17], ligament[18,19], skin[20,21], blood vessels[22], and cartilage[23–26]. The results of these studies suggest that the optimal fiber diameter may be highly dependent on various experimental factors and it may be impossible to isolate a single ideal fiber diameter independent of other conditions. For example, one study concluded that differentiation of mesenchymal stem cells (MSCs) towards a cartilage phenotype was better on electrospun poly(ε-caprolactone) (PCL) fibers that were 500 nm in diameter than on fibers 3 μm in diameter[24], while another group concluded that chondrogenesis was enhanced on poly(L-lactide) fibers with diameters of 5 μm or 9 μm in comparison to those between 300 nm and 1,400 nm in diameter[23]. While these studies appear to have conflicting results regarding the optimal fiber diameter for chondrogenesis, differences in other experimental parameters including differences in scaffold material, fiber alignment, medium composition, and initial cell seeding density may have contributed to the differences in outcome.
In vitro chondrogenesis is improved with 3-dimensional (3D) culture in comparison to 2D culture[27,28], which is not surprising given that cell-cell interactions are essential to initiate the initial condensation phase during cartilage development in vivo[29]. In tissue engineering studies, wide ranges of initial seeding densities have been examined. Seeding densities as low as 1×10⁴ cells/cm3-scaffold up to 4×10⁶ cells/cm3-scaffold have been used to examine MSC differentiation into an cartilage phenotype on fibrous scaffolds[23,30]. Even higher seeding densities, up to 100×106 cells/cm3-scaffold have been used when chondrocytes rather than stem cells were seeded, due to their reduced proliferation potential[31]. Higher seeding densities typically generate a greater amount of matrix sulfated glycosaminoglycan (GAG) and collagen produced per construct, but some studies have found that there is a saturation point where further increases in the number of cells seeded do not result in increased matrix deposition or mechanical properties[32,33], and in some cases may even lead to a decrease in matrix production on a per cell basis[34,35].
In this study, we examined the chondrogenic potential of human bone marrow-derived MSCs seeded onto electrospun PCL nanofiber and microfiber scaffolds. In addition to comparing the effects of varying the scaffold diameter, the role of initial seeding density is also observed in order to determine if the density of cells on the scaffold, which impacts cell-cell interaction, influences the chondrogenic potential of the cells seeded onto scaffolds with fibers of different diameters.
2. Materials and methods
2.1 Scaffold Fabrication
Nanofiber and microfiber PCL scaffolds were created by electrospinning using a custom made apparatus. PCL (80 kDa, Sigma-Aldrich, St. Louis, MO) was dissolved at 40°C overnight in a 1:1 mixture of N,N-dimethylformamide and tetrahydrofuran (Fisher Scientific, Pittsburgh, PA) at a concentration of 11.5% and 22% w/v for nanofibers and microfibers, respectively. 0.06% w/v sodium chloride was added to the 11.5% solution to increase conductivity and improve homogeneity of fiber diameter. The polymer solution was drawn into a 20 ml syringe connected to a stainless steel needle. A syringe pump (Harvard Apparatus, Holliston, MA) was used to deliver the solution at a constant rate of 2.0 ml/hr. Microfibers were electrospun using a 12-inch, 18G blunt-ended needle charged to 8 kV with a high voltage power supply (Gamma High Voltage Research Inc., Ormond, FL) at a distance of 23 cm from the collector. For nanofibrous scaffolds, a 4-inch, 22G blunt-ended needle was charged to 13.5 kV at a distance of 15 cm from the collector. The collector was a custom-made grounded aluminum mandrel rotating at 0.75 m/s. Additionally, aluminum shields were placed on either side of the mandrel and plate and charged to either 10 kV or 2 kV for nanofibers and microfibers, respectively, in order to guide the fibers onto the grounded surface.
2.2 Scaffold Characterization
Average scaffold thicknesses were measured using a digital micrometer in ten separate areas of the scaffolds. The structure of microfibers and nanofibers was examined using a scanning electron microscope (SEM) (JSM6335F; JEOL, Peabody, MA). Scaffolds were mounted onto aluminum studs, sputter-coated with 3.5 nm of palladium/gold alloy, and imaged under an accelerating voltage of 5 kV and a working distance of 8 mm. Average fiber diameter, pore size, and overall porosity were quantified from images using ImageJ analysis software (National Institutes of Health, Bethesda, MD).
2.3 Cell culture & seeding
MSCs were isolated from bone marrow obtained from the femoral heads of patients undergoing total hip arthroplasty with approval from the Institutional Review Board (University of Washington, Seattle, WA). Trabecular bone was isolated and the marrow was harvested using a bone curet and washed with DMEM containing 10% fetal bovine serum (FBS) (Gibco, Carlsbad, CA). The marrow solution was then passed through a 40 μm filter into a 50 mL conical tube and centrifuged for 5 min at 1,100 RPM. The pellet that formed was washed with phosphate buffered saline (PBS), and cells were plated onto tissue culture-treated flasks. Cells were maintained in growth medium consisting of DMEM supplemented with 10% FBS and 1% antibiotic-antimycotic (anti-anti) (Gibco) at 37°C and 5% CO2. Cells were passaged when they reached approximately 80% confluency using 0.5% trypsin/EDTA (Gibco), and all experiments were performed using passage 5 MSCs. Scaffolds were cut using a 1 cm diameter punch (McMaster-Carr, Elmhurst, IL) and then hydrated in 70% ethanol for 2 hours. Scaffolds were then rinsed with PBS twice for 30 minutes each, and left overnight in growth medium. To seed MSCs onto scaffolds, cells were first trypsinized, resuspended, and 50 μl of the solution was pipetted onto scaffolds to give initial cell seeding densities of 100,000 (100k), 500,000 (500k), 2,000,000 (2,000k) or 4,000,000 (4,000k) cells/cm3- scaffold. Cells were allowed to attach for 2 hours prior to adding 1 ml of growth medium to each well of a 24-well plate coated with Sigmacote (Sigma). After 24 hours of culture, growth medium was replaced with 2 ml of chondrogenic medium containing serum-free DMEM supplemented with 1% anti-anti, 50 μg/ml ascorbic acid (Sigma), 50 μg/ml L-proline (Sigma), 0.1 μM dexamethasone (Sigma), 1% insulin-transferrin-selenium (Gibco), and 10 ng/ml recombinant human transforming growth factor-β3 (TGF-β3; Peprotech, Rocky Hill, NJ). Medium was changed every 3 days for 3 to 6 weeks prior to harvesting.
2.4 RNA isolation and quantitative real-time polymerase chain reaction (qPCR)
Constructs from each group were rinsed with PBS, minced, and placed into tubes. Six scaffolds were pooled into each tube in order to obtain sufficient RNA from low seeding density scaffolds. 700 μl of TRIZOL (Invitrogen, Carlsbad, CA) was then added to each tube and the scaffolds were manually homogenized before storing at −80°C until the next step was performed. After adding 140 μl of chloroform (Fisher Scientific), each solution was incubated at room temperature for 5 minutes prior to centrifuging at 12,000 rpm and 4°C for 15 min. One volume of 70% ethanol was added to each sample followed by completing the RNA extraction using the RNeasy Micro Kit (Qiagen, Valencia, CA) following the manufacturer's protocol. The concentration and purity of RNA was determined using a Nanodrop 2000c spectrophotometer (Thermo Scientific, Wilmington, DE). Each RNA sample (200 ng) was reverse transcribed into cDNA using the SuperScript III First-Strand Synthesis Super Mix (Invitrogen) following the manufacturers protocol using Oligo(dT)20 primers.
Gene-specific primers (table 1) were designed using Primer-Blast software (NIH, Bethesda, MD)[36] and purchased from Integrated DNA Technologies (IDT, Coralville, IA). The primer concentrations and annealing temperatures were optimized for efficiency (95-105% efficiency) and specificity (melting curve analysis and product size by electrophoresis).
Table 1.
Primers used for real-time RT-PCR
| Gene | Primer Sequences | Annealing Temp (°C) |
|---|---|---|
| ACAN | Forward: 5′-AGG GGC GAG TGG AAT GAT GTT-3′ Reverse: 5′-GGT GGC TGT GCC CTT TTT-3′ |
56 |
| COL1 | Forward: 5′-CGA AGA CAT CCC ACC AAT CAC-3′ Reverse: 5′-CAT CGC ACA ACA CCT TGC C-3′ |
60 |
| COL2 | Forward: 5′-GGC AAT AGC AGG TTC ACG TAC A-3′ Reverse: 5′-CGA TAA CAG TCT TGC CCC ACT T-3′ |
52 |
a Aggrecan
b Collagen, type I, α2
c Collagen, type II, α1
cDNA (10 ng) was added to 10 μl SYBR® Green PCR Master Mix (Applied Biosystems, Carlsbad, CA) and 150 nM primers to a final volume of 20 μl and qPCR was performed using the StepOnePlus Real-Time PCR system (Applied Biosystems). After initial denaturation at 95°C for 10 min, 40 cycles of 15 sec at 95°C and 1 min at the primer-specific annealing temperature were completed to amplify DNA. Quantification of the target gene expression, relative to the 100k nanofiber sample at each time point, was performed using the ΔΔCT method with cyclophilin A used as an endogenous control.
2.5 Biochemical Assays
After washing with PBS, constructs were lyophilized and digested for 18 hours in 200 μl of a papain solution (125 μg/ml papain, 50 mM sodium phosphate buffer, 2 mM N-acetyl cysteine (Sigma), pH 6.5). Following digestion, samples were stored at −20°C. The DNA content in the scaffolds was quantified using the Quant-iT PicoGreen dsDNA Assay Kit (Invitrogen), following the manufacturer's protocol. The fluorescence of the PicoGreen-DNA solution was measured using a Synergy HT plate reader (BioTek, Highland Park, VT) at an excitation/emission of 485/528 nm, and DNA content in the samples was estimated using the DNA standard provided in the kit. Quantification of sulfated GAGs in the scaffolds was performed using a commercial Blyscan Glycosaminoglycan Assay kit (Accurate Chemical & Scientific, Westbury, NY). The absorbance at 656 nm was measured using a plate reader, and a chondroitin-4-sulfate solution provided with the kit was used as a standard. The lower detection threshold used was 0.25μg GAG/100μl sample, as defined by the manufacturer. The collagen content of the scaffolds was determined using a modified hydroxyproline assay[37] using bovine collagen type I as a standard. Briefly, 125μl of each sample and standard were hydrolyzed with 125 μl of 4N sodium hydroxide (Fisher) at 121°C for 20 min. 125 μl of 4N HCl (Fisher) was added and the solution was titrated to a neutral pH. 187.5 μl of chloramine-T solution (Sigma) (14.1 g/L chloramine-T, 50 g/L citric acid, 120 g/L sodium acetate trihydrate, 34 g NaOH, 0.21M acetic acid) was incubated with the sample at room temperature for 25 min. Then 187.5 μl of 15 g/L p-dimethylaminobenzaldehyde in 2:1 isopropanol:perchloric acid was added, and the solution was placed in a 60°C water bath for 20 min. Finally, 200 μl of each sample in triplicate was added into a 96 well plate and absorbance was read at 550 nm. The lower threshold of detection was defined as 7.5 μg collagen/125μl of sample, the first non-zero standard that was utilized to form the linear standard curve.
2.6 Immunofluorescence
Whole-mount constructs were utilized for detailed examination of matrix components. Briefly, constructs were fixed in 4% paraformaldehyde for 20 minutes, washed, and stored in PBS at 4°C until staining was performed. Prior to antibody application, enzymatic antigen retrieval was performed, with constructs incubated in 0.1% pepsin in 0.01 HCl, pH 3 for 15 minutes at 37°C to unmask antigens. Following retrieval, non-specific antibody binding was blocked with 5% normal goat serum (Vector) for 1 hour. Following blocking, samples were incubated overnight at 4°C with primary antibodies against collagen type I (Col I; 1:200; ab292, Abcam, Cambridge, MA) and collagen type II (Col II; 1:100; MAB8887; EMD Millipore, Billerica, MA). Samples were then washed and incubated in Cy3-conjugated goat anti-rabbit secondary to detect Col I and AlexaFluor 488-conjugated goat anti-mouse secondary antibodies to detect Col II for 1 hour followed by nuclear staining with 40,6-diamidino-2-phenylindole (DAPI; 1:1000; Invitrogen) for 2 minutes. Negative controls included omission of the primary antibody as well as species-specific isotype controls.
Constructs were imaged using laser scanning confocal microscopy (Fluoview 1000, Olympus, Center Valley, PA) and processed using NIS Elements software (Nikon Instruments, Inc., Melville, NY).
2.7 Statistical Analysis
All data were expressed as mean ± standard deviation and statistical analysis was performed using two-way analysis of variance (ANOVA) followed by Tukey's test for post hoc comparisons. A threshold of p<0.05 was used to determine statistical significance.
3. Results
3.1 Scaffold characterization
Electrospun nanofiber scaffolds had an average thickness of 0.95±0.1mm, average diameter of 440±20 nm, average pore size of 1.2±0.2 μm2 and overall porosity of 88±3%, while microfiber scaffolds had an average thickness of 0.97±0.2mm, average diameter of 4.3±0.8 μm, an average pore size of 90±10 μm2, and an overall porosity of 90±2% (figure 1).
Figure 1.
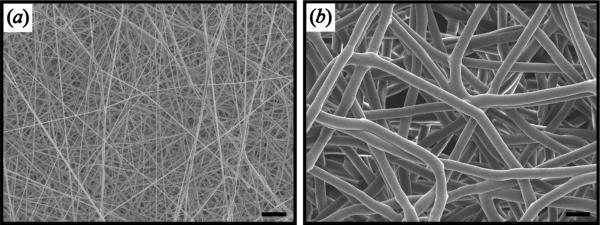
SEM image of nanofiber and microfiber scaffolds. (a) Nanofiber scaffolds with average diameter of 440±20 nm, average pore size of 1.2±0.2 μm2, and overall porosity of 88±3%. (b) Microfiber scaffolds with average diameter of 4.3±0.8 μm, average pore size of 90±10 μm2, and overall porosity of 90±2%. Scale bar = 10 μm.
3.2 Gene expression
At 3 and 6 weeks following induction of chondrogenic differentiation, ACAN expression was significantly higher overall when cells were seeded on microfibers in comparison to nanofibers (figure 2). Within each initial seeding density, there were significant differences at week 3 between microfibers and nanofibers in the two higher seeding density groups, and expression was significantly greater with an initial seeding density of at least 2,000k cells/cm3 than in the lower seeding density groups, although no significant differences were found between 2,000k and 4,000k groups. At week 6 there were no significant differences between expression in 500k, 2,000k and 4,000k microfiber groups, while 500k and 2,000k groups had higher ACAN expression on microfibers than nanofibers, and there was seemingly no difference in expression between nanofibers and microfibers at the 4,000k seeding density.
Figure 2.
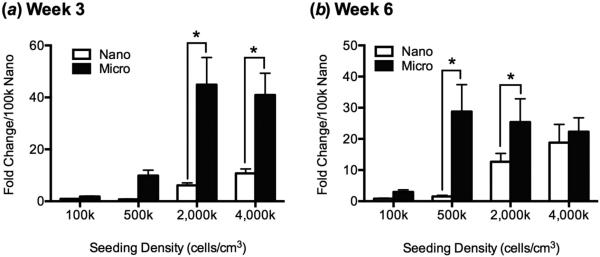
Relative aggrecan gene expression by MSCs seeded onto nanofibers and microfibers by qPCR after (a) 3 weeks and (b) 6 weeks of chondrogenic differentiation as a function of initial cell seeding density. After 3 weeks of culture, MSCs expressed significantly higher amounts of aggrecan when seeded onto microfibers than onto nanofibers at high initial cell density (2,000k or 4,000k cells/cm3-scaffold). After 6 weeks of culture, MSCs expressed significantly more aggrecan when seeded on microfibers than on nanofibers at 500k and 2,000k cells/cm3-scaffold. Cyclophilin A was used as an endogenous control for qRT-PCR, and expression level for each group was normalized to that of the 100k-nano group. Values are mean + SD (n = 3); *, p<0.05.
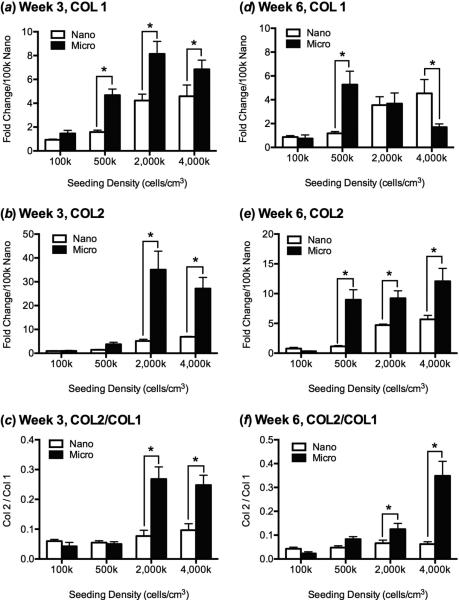
COL1 and COL2 gene expression at week 3 followed a similar trend, with higher seeding densities showing increased expression on microfibers in comparison to nanofibers (figure 3a,b). At week 6, however, COL1 expression was similar in microfibers and nanofibers in the 2,000k seeding group and significantly decreased on microfibers in the 4,000k group, while COL2 expression remained high (Figure 3d,e). Finally, the COL2/COL1 ratio, where higher values indicate a more hyaline cartilage phenotype, was significantly greater at both 3 and 6 weeks for the higher seeding densities on microfibers than nanofibers and in comparison to the lower seeding densities (figure 3c,f).
Figure 3.
Relative COL1 and COL2 gene expression by MSCs seeded onto nanofibers and microfibers by qPCR after (a,b,c) 3 weeks and (d,e,f) 6 weeks of chondrogenic differentiation as a function of initial cell seeding density. After 3 weeks of culture, (a) expression of COL1, (b) COL2, and (c) the ratio of COL2/COL1 was significantly greater for cells seeded on microfiber scaffolds in comparison to nanofiber scaffolds at higher initial seeding density; there were no significant differences between the 2,000k and 4,000k cells/cm3-scaffold groups of the same fiber diameter. After 6 weeks of culture, (d) expression of COL1 increased with increasing seeding density on nanofibers and decreased on microfibers, and (e) COL2 expression and (f) COL2/COL1 ratio were significantly higher on microfibers than nanofibers at higher initial cell seeding densities. Cyclophilin A was used as an endogenous qRT-PCR control, and expression level for each group was normalized to that of the 100k-nano group. Values are mean ± SD (n = 3); *, p<0.05.
3.3 Biochemical Characterization
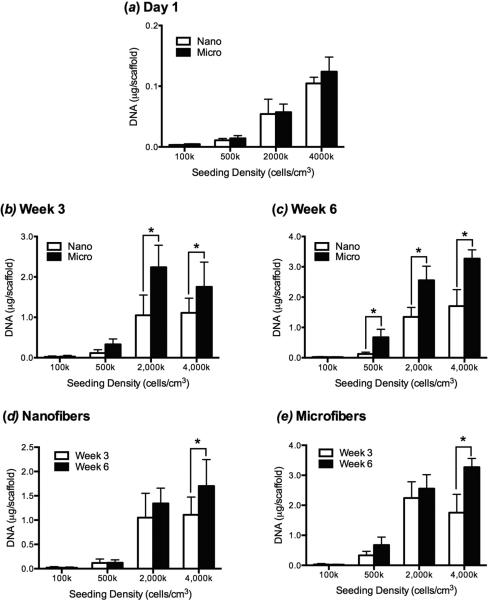
One day following cell seeding, there were no differences in the DNA content between microfibers and nanofibers for a given seeding density (figure 4a). The DNA content in scaffolds at week 3 was significantly higher overall in microfibers than nanofibers, and significantly more DNA was found in microfiber than nanofiber constructs in the high initial seeding density group (figure 4b). However, there was no significant difference between the amount of DNA in the 2,000k and 4,000k groups seeded on scaffolds with the same fiber diameter. A similar trend was seen in week 6, with a significantly greater amount of DNA also found on microfibers in the 500k group (figure 4c).
Figure 4.
Total cellular DNA content in MSC constructs in nanofiber and microfiber scaffolds as a function of chondrogenic culture time and initial seeding density. (a) 1 day after initial cell seeding there were no differences in the number of MSCs attached to nanofiber and microfiber scaffolds at each seeding density. (b) After 3 weeks of culture, there were significantly more MSCs on microfiber than nanofiber scaffolds seeded at initial densities of 2,000k and 4,000k cells/cm3-scaffold and no differences between cell numbers at high densities within each scaffold group. (c) After 6 weeks of culture, similar trends were seen, with greater numbers of MSCs on microfibers than on nanofibers on all but the 100k cells/cm3-scaffold group. (d,e) Proliferation on each scaffold type between week 3 and week 6 was only significant for nanofibers and microfibers in the 4,000k group. Values are mean ± SD (n = 6); *, p<0.05.
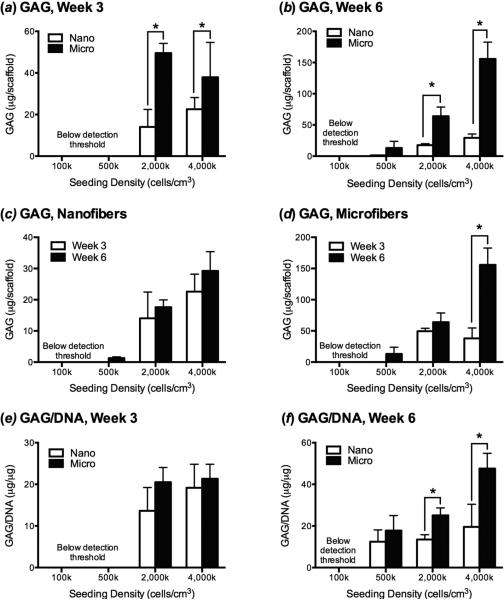
GAG production paralleled the DNA content at the week 3 time point, with significantly more GAG being produced by high seeding density microfiber groups (figure 5a). However, there was no significant difference when the GAG content was normalized to DNA content, suggesting that on a per cell basis, there were similar amounts of GAG production on the different scaffold times types (figure 5be). The GAG production at week 3 in the 100k or 500k groups was below the assay's level of detection and thus was excluded in the analysis. At week 6, both the total GAG and the GAG/DNA levels were significantly higher in the 2,000k and 4,000k groups (figure 5b,f). The 500k group produced enough GAG to meet the assay's threshold of detection at the 6-week time point, and while the total GAG production was lower than the higher seeding density groups, the GAG/DNA in the 500k group was not significantly different at 6 weeks than the 2,000k group. Within each scaffold type, the amount of GAG deposition only increased between week 3 and week 6 for cells seeded on microfibers at 4,000k cells/cm3-scaffold, while all other groups appeared to maintain the same quantity of GAG (figure 5c,d) and GAG/DNA (data not shown) between the two time points.
Figure 5.
GAG production by MSCs as a function of scaffold type, chondrogenic culture time, and initial seeding density. (a) After week 3 and (b) week 6 of culture MSCs produced significantly more GAG when seeded on microfiber than nanofiber scaffolds at initial densities of ≥2,000k cells/cm3. (c) The quantity of GAG produced by cells seeded on nanofibers did not significantly increase between week 3 and week 6 for any initial seeding density, and (d) only significantly increased between week 3 and week 6 on microfibers seeded with 4,000 cells/cm3. GAG production was below the detection limit of the assay for the 100k and 500k groups at week 3, and the 100k group at week 6. (e) When GAG content was normalized to cell number (GAG/DNA), there was no significant difference between scaffold types at 3 weeks. (f) After 6 weeks of culture, GAG/DNA were greater on microfibers than nanofibers when cells were seeded at ≥2,000k cells/cm3-scaffold, with cells seeded on microfibers at 4,000k cells/cm3-scaffold producing significantly more GAG than any other group. Values are mean ± SD (n = 6); *, p<0.05.
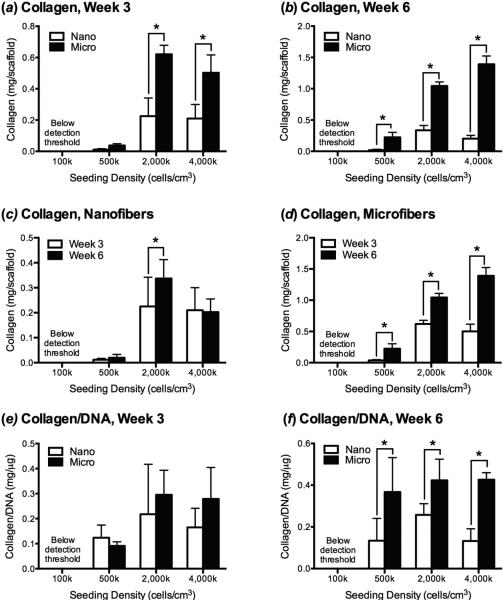
Differences in total collagen production and collagen/DNA followed the same trends as GAG production. More collagen was produced on microfibers in comparison to nanofibers in the 2,000k and 4,000k groups (figure 6a,b), although these differences only remained following normalization to DNA at week 6 (figure 6f). Unlike GAG, the total amount of collagen deposited on scaffolds between week 3 and week 6 increased for microfibers seeded with at least 500k cells/cm3-scaffold. There was no difference in the collagen/DNA at week 3 and week 6 for any of the groups (data not shown).
Figure 6.
Collagen production by MSCs as a function of scaffold type, chondrogenic culture time, and initial seeding density. (a) After week 3 of culture MSCs produced significantly more collagen when seeded on microfiber than nanofiber scaffolds at initial densities of ≥2,000k cells/cm3, and (b) after week 6, collagen deposition was higher on microfibers initially seeded at a density of ≥500k cells/cm3. (c) The quantity of collagen produced by cells seeded on nanofibers only significantly increased between week 3 and week 6 for the 2,000k group, while (d) collagen deposition significantly increased between week 3 and week 6 on microfibers seeded with ≥500k cells/cm3. Collagen production was below the detection limit of the assay for the 100k at both time points (e) When collagen content was normalized to cell number (collagen/DNA), there was no significant difference between scaffold types at 3 weeks. (f) After 6 weeks of culture, collagen/DNA was greater on microfibers than nanofibers when cells were seeded at ≥500k cells/cm3-scaffold. Values are mean ± SD (n = 6); *, p<0.05.
3.4 Immunofluorescence
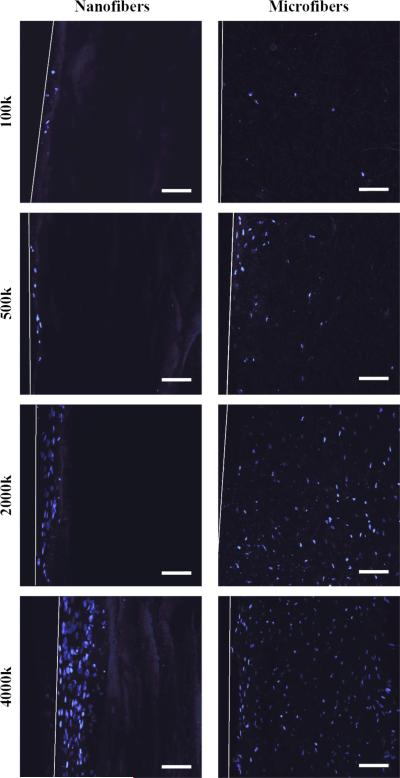
Cell density within the first 50 μm of the surface did not differ significantly for nanofibers and microfibers. However, cells seeded onto microfiber scaffolds migrated and proliferated throughout the thickness of the scaffold, whereas cells seeded onto nanofiber scaffolds were typically only able to penetrate 50-100 μm below the surface of the scaffold (figure 7).
Figure 7.
MSC penetration into nanofiber and microfiber scaffolds in chondrogenic cultures at varying cell seeding densities. Cross-sections of scaffolds were viewed after DAPI nuclear staining (blue) by confocal laser scanning microscopy. Cells seeded on nanofibers only migrated 50-100 μm below the scaffold surface, while cells seeded on microfibers were found throughout the entire thickness of the scaffold. White lines indicate the surface edge of the scaffold. Scale bar = 100 μm.
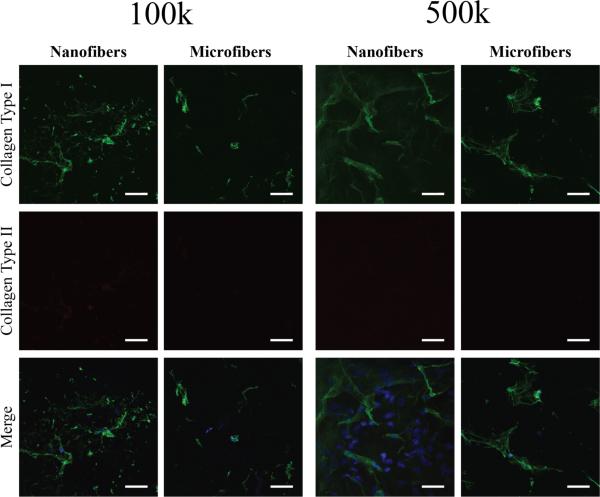
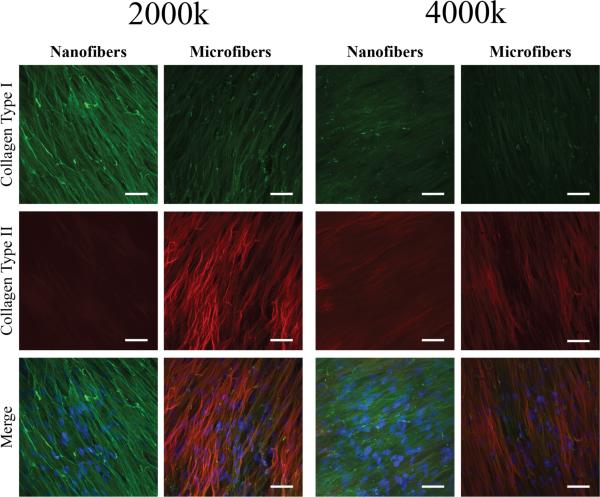
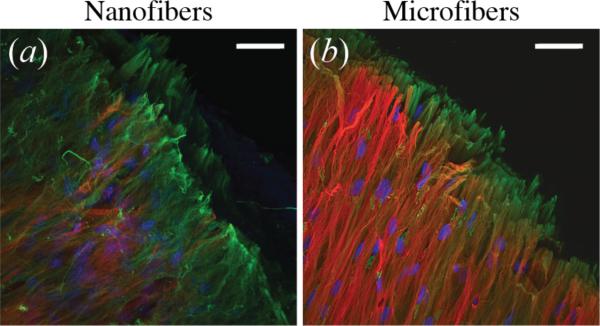
Scaffolds seeded with 100k or 500k cells/cm3-scaffold stained positively for collagen type I around sparse nuclei, but did not show significant staining for collagen type II (figure 8). At high seeding densities, collagen type I aligned parallel to the surface of the scaffold was seen on all groups (figure 9). Only nanofibers seeded at the highest density stained positively for collagen type II, while both the 2,000k and 4,000k microfiber groups appeared to have similar amounts and structure of collagen type II deposition. Images taken at the edge of 4,000k nanofiber and microfiber groups display some differences in the arrangement of collagen fibers. While collagen type II staining appears to be mainly on the surface of microfibers, with collagen type I below, the collagen type II staining appears to be mixed within the same layer as that of collagen type I on nanofiber scaffolds (figure 10).
Figure 8.
Collagen type I and type II deposition in low density MSC-seeded nanofiber and microfiber constructs after 6 weeks of chondrogenic culture viewed by confocal immunofluorescence microscopy. Only sparse collagen type I (green) and no apparent collagen type II (red) deposition was seen on nanofibers and microfibers seeded at 100k and 500k cells/cm3-scaffold. A merged image with nuclei stained with DAPI (blue) is also shown. Scale bar = 50 μm.
Figure 9.
Collagen type I and type II deposition in high density MSC-seeded nanofiber and microfiber constructs after 6 weeks of chondrogenic culture viewed by confocal immunofluorescence microscopy. Collagen type I deposition (green) in an aligned formation was seen on both nanofibers and microfibers at 2,000k and 4,000k cells/cm3-scaffold. There was no significant collagen type II staining (red) on nanofibers at 2,000k cells/cm3-scaffold, but staining was seen on nanofibers seeded at an initial density of 4,000k cells/cm3-scaffold and microfibers seeded with 2,000k and 4,000k cells/cm3-scaffold. A merged image with nuclei stained with DAPI (blue) is also shown. Scale bar = 50 μm.
Figure 10.
Collagen fiber organization on edge of (a) nanofiber and (b) microfiber scaffolds seeded with MSCs at 4,000k cells/cm3-scaffold after 6 weeks of chondrogenic differentiation, observed by confocal immunofluorescence microscopy. Nanofiber cultures show collagen type I (green) and collagen type II (red) fibers mixed within the same layer, while microfiber cultures appear to have a surface layer of collagen type II, with collagen type I fibers located below. Nuclei are stained with DAPI (blue). Scale bar = 50 μm.
4. Discussion
Previous studies examining the effects of fiber diameter on chondrogenesis are difficult to compare due to variations not only in the fiber diameters and cell seeding densities used, but also other variables, including the scaffold material, fiber alignment, cell type, media composition, time points analyzed, and the methods used to determine the outcomes. Thus, although the results between studies may appear to be conflicting, with some suggesting that nanofibers induce better cartilage formation than microfibers while others conclude the opposite, these differences may in fact be attributable to other experimental variables that are not controlled for between studies. The results of this study suggest that scaffold diameter, and specifically pore size, plays an important role in the chondrogenesis of MSCs on PCL scaffolds in vitro. Furthermore, the effects of varying the fiber diameter are dependent on the initial cell seeding density.
While the overall porosities of the microfiber and nanofiber scaffolds used in this study were similar, the average pore size of nanofiber scaffolds was about 75 times smaller than microfiber scaffolds. Since the average diameter of human MSCs in suspension is approximately 10-20 μm [38,39], cells were unable to penetrate deeply into the nanofiber scaffold over time, with only 2-10% of the scaffold thickness being colonized by MSCs, depending on the initial seeding density. In contrast, cells seeded onto the microfiber scaffolds containing larger pores were able to migrate throughout the entire thickness of the scaffold and have a relatively homogeneous cell distribution. The ability of the cells to populate the entire scaffold thickness on the microfiber scaffolds likely enhanced their ability to proliferate as well as lay down extracellular matrix proteins, as evidenced by persistent ECM production on microfiber scaffolds between week 3 and week 6. Adult human articular cartilage has an overall cell density of approximately 20×106 cells/cm3, while newborns may have cell densities that are 6-7 times higher[40]. The cell density near the surface of the scaffolds after 6 weeks of culture are within the range of cell densities found in adult and newborn on both nanofibers and microfibers for all groups except for the 100k seeding density group, suggesting that seeding densities from 500k cells/cm3-scaffold and higher may provide sufficient cell numbers to effectively promote chondrogenic differentiation provided the cells are able to homogeneously populate the entire thickness of the scaffold. However, utilizing a higher initial seeding density appears to result in a more rapid and persistent chondrogenic response, as would be desirable for future clinical application.
The first step in cartilage development is condensation of MSCs into high-density cell aggregates, allowing the formation of cell-cell contacts essential for successful cartilage development[41]. When cells are seeded at a very low density, the potential for cell-cell interactions is limited, and therefore chondrogenic differentiation is likely to be reduced. Consistent with this, our results show that seeding cells at a very low density (100k cells/cm3-scaffold) resulted in low chondrogenic gene expression and protein production for both microfiber and nanofiber scaffolds. There were no significant differences in chondrogenic gene expression or cell number between microfiber and nanofiber scaffolds, and the amounts of secreted collagen and GAG were not sufficient to be detected with the assays utilized. Immunofluorescence showed limited collagen type I deposition and staining for collagen type II was absent, with no apparent differences between microfiber and nanofiber scaffolds. These results suggest that low seeding densities have limited utility for studying chondrogenesis on electrospun fibers, independent of the scaffold diameter.
During cartilage development, ECM composed of collagen type I in addition to other cell-adhesion molecules is initially deposited by MSCs prior to differentiation[41,42]. As differentiation commences following condensation, a shift towards a phenotype with high collagen type II and proteoglycan deposition occurs. A similar pattern is seen in this study with microfiber constructs seeded at high initial cell densities. Specifically, in the 2,000k and 4,000k cells/cm3-scaffold seeding groups, gene expression of COL 1 in addition to COL 2 and ACAN are higher on microfibers at the 3-week time point, suggesting that while cells are still producing collagen type I, they may be beginning their shift towards increased collagen type II and proteoglycan production. Confirmation of this is seen after 6 weeks in culture, where expression of COL 1 on microfibers decreases in comparison to nanofibers, particularly for the 4,000k group. While the overall ratio of COL 1 expression remains greater than COL 2 even after six weeks of culture (COL2 / COL1 < 1), the trend towards increasing COL2 expression suggests cells seeded on microfibers are beginning to acquire a more chondrocytic phenotype. GAG and collagen protein deposition follow a similar pattern, and immunofluorescence shows the presence of collagen type II on the surface of the construct in addition to collagen type I. In comparison, cells seeded on nanofibers also stain positively for both collagen type I and type II, but seem to have less collagen type II than microfibers. Thus, it appears that at high initial cell seeding densities, the microfibrous PCL scaffolds used in this study more efficiently promote an articular cartilage phenotype and related ECM protein deposition than nanofibrous scaffolds.
While seeding densities of 2,000k cells/cm3-scaffold and higher appear to be superior for chondrogenesis, the lower seeding densities also provide some insight into cell behavior on scaffolds of different diameters. ACAN and COL 2 gene expression was significantly lower in both the 100k and 500k groups than the high initial seeding density groups after 3 weeks of culture, and no differences were seen between microfibers and nanofibers. COL 1 expression was higher at week 3 for the 500k group seeded on microfibers, suggesting that this may be the minimum seeding density needed to stimulate significant ECM deposition. After 6 weeks of culture, ACAN and COL 2 expression in the 500k group on microfibers increased to levels similar to the higher density groups and GAG and collagen production increased, indicating that chondrogenic differentiation is delayed at this seeding density, but can be induced over time. This delayed chondrogenic induction may be attributable to the number of cells needed to reach a threshold in cell density where enough cell-cell contacts are formed to induce chondrogenesis, and therefore stimulate increased expression of ACAN and COL 2 as well as increased GAG and collagen deposition.
There were no significant differences in the number of cells attached to microfiber and nanofiber scaffolds one day after seeding. This suggests that the greater number of cells as well as higher chondrogenic gene expression and protein production on microfibers are due to differences in the scaffold architecture that influence cell behavior and are not simply a direct result of the seeding efficiency being higher for microfiber scaffolds. One explanation is that while both of the high-density seeding groups have a cell density sufficient to induce chondrogenesis, the presence of cells throughout the entire thickness of the microfibers results in a larger area for cells to deposit ECM. Since cells cannot migrate deeply into the nanofiber scaffold, tissue deposition is restricted to the surface. During the early periods of culture, cells on both types of scaffolds deposit ECM pericellularly at a similar rate due to the abundance of space surrounding each cell. However, cells seeded on nanofibers become surrounded by the ECM more quickly due to the limited area that they occupy, perhaps causing protein secretion to slow and resulting in decreased GAG and collagen per cell in comparison to microfiber constructs seen at the 6-week time point. Conversely, on microfiber scaffolds where cells are able to penetrate throughout the scaffold, there is continued deposition of ECM proteins between the week 3 and week 6 time points, suggesting that the nanofiber architecture is limiting tissue maturation.
Cell morphology on scaffolds may also provide some insight into the differences in cell behavior on microfiber and nanofiber scaffolds. In native articular cartilage, the superficial zone is a thin layer containing flattened chondrocytes, while in the intermediate and deep zones chondrocytes are more round. A similar morphology is found on microfiber scaffolds seeded at high cell densities. In contrast, cells seeded on nanofiber scaffolds appear to mostly form a thicker layer of flattened superficial zone-like cells near the surface of the scaffold. In vivo, the cells of the intermediate and deep zones are the main synthesizers of proteoglycans, which could explain the decreased GAG formation in these scaffolds, and there is also evidence that collagen expression is higher in these areas as well[43].
In this study, MSCs were used at a relatively high passage number (passage 5) in order to obtain sufficient cell numbers. While these cells still retain sufficient, detectable chondrogenic activity, it is recognized that MSC expansion results in decreased chondrogenic potential. In future studies, it is thus desirable to examine earlier passage cells to better assess the parameters governing the generation of functional tissue-engineered cartilage constructs.
The results of this study strongly suggest that seeding MSCs onto microfibers promotes chondrogenesis better than nanofibers, although it remains unclear whether the differences are simply due to increased pore size leading to enhanced cell penetration, or if other aspects of the scaffold architecture are influencing differentiation. Additionally, while studies often utilize lower seeding densities to reduce cell-cell interactions and increase cell-material interactions to understand the role of materials on cell behavior, this may not be useful in cartilage tissue engineering applications due to the importance of the cell-cell interactions required in inducing chondrogenic differentiation. Future studies seeding MSCs at high densities onto microfiber and nanofiber scaffolds fabricated to have similar pore will be essential for understanding the effects of fiber diameter on MSC chondrogenesis independent of pore size. Additional investigation of a wider range of fiber diameters may also be important, as this study was limited to comparison of only two different fiber diameters, and it is possible that the optimal fiber diameter may be significantly different than those utilized here. Finally, it is important to consider the effects of fiber diameter and pore size on the mechanical properties of the scaffolds. Increasing the pore size for a given fiber diameter will likely result in a decrease of the mechanical properties of the unseeded scaffold. However, enhanced deposition of extracellular matrix proteins due to improved cellular penetration through the scaffold may be able to overcome this deficit, particularly as the scaffold material itself begins to degrade. Each of these variables warrants further investigation and highlights the difficulty in elucidating the optimal parameters for developing a viable tissue construct.
5. Conclusion
In conclusion, utilizing the three-pronged approach to tissue engineering strategies combining scaffolds, cells, and other bioactive stimulants creates a large number of potential variables that can influence experimental outcomes and makes comparison between studies difficult. In this study, we have examined two variables at the same time—seeding density and fiber diameter— in order to more fully understand the role that each of these variables play in influencing interactions that occur between MSCs and electrospun fibers under in vitro chondrogenic conditions. Our findings suggest that seeding MSCs at a high initial density onto a microfibrous scaffold stimulates chondrogenesis in vitro more effectively in comparison to using nanofiber scaffolds which may limit cell penetration due to small pore size, and/or low seeding densities which may not provide ample cell-cell contacts to induce chondrogenesis.
If only low seeding densities had been utilized in this study, it may have been concluded that the fiber diameter was unimportant for chondrogenesis. Or, if only nanofibers, the knowledge gained by understanding the potential importance of pore size and cell infiltration in conjunction with seeding density would have been lost. While it is not feasible to test all potential combinations of culture parameters at once, understanding the interplay between different parameters by examining multiple variables may be a beneficial strategy in attempting to a successful tissue engineered construct.
Acknowledgments
Funding for this work was provided by the Commonwealth of Pennsylvania and the Cardiovascular Bioengineering Training Program at the University of Pittsburgh (NIH T32HL076124). We would also like to acknowledge the Center for Biologic Imaging at the University of Pittsburgh for the use of their confocal microscopes and the staff for their technical assistance.
References
- 1.Lawrence RC, Felson DT, Helmick CG, Arnold LM, Choi H, Deyo RA, Gabriel S, Hirsch R, Hochberg MC, Hunder GG, Jordan JM, Katz JN, Kremers HM, Wolfe F. Estimates of the prevalence of arthritis and other rheumatic conditions in the United States. Part II. Arthritis Rheum. 2008;58:26–35. doi: 10.1002/art.23176. [DOI] [PMC free article] [PubMed] [Google Scholar]
- 2.Hootman JM, Helmick CG. Projections of US prevalence of arthritis and associated activity limitations. Arthritis Rheum. 2006;54:226–9. doi: 10.1002/art.21562. [DOI] [PubMed] [Google Scholar]
- 3.Bade MJ, Kohrt WM, Stevens-Lapsley JE. Outcomes before and after total knee arthroplasty compared to healthy adults. J. Orthop. Sports Phys. Ther. 2010;40:559–67. doi: 10.2519/jospt.2010.3317. [DOI] [PMC free article] [PubMed] [Google Scholar]
- 4.Mariconda M, Galasso O, Costa GG, Recano P, Cerbasi S. Quality of life and functionality after total hip arthroplasty: a long-term follow-up study. BMC Musculoskelet. Disord. 2011;12:222. doi: 10.1186/1471-2474-12-222. [DOI] [PMC free article] [PubMed] [Google Scholar]
- 5.Health N I of 2003 NIH Consensus Statement on total knee replacement. NIH Consens. State. Sci. Statements. 20:1–34. [PubMed] [Google Scholar]
- 6.Labek G, Thaler M, Janda W, Agreiter M, Stöckl B. Revision rates after total joint replacement: cumulative results from worldwide joint register datasets. J. Bone Joint Surg. Br. 2011;93:293–7. doi: 10.1302/0301-620X.93B3.25467. [DOI] [PubMed] [Google Scholar]
- 7.Hynes RO. The extracellular matrix: not just pretty fibrils. Science. 2009;326:1216–9. doi: 10.1126/science.1176009. [DOI] [PMC free article] [PubMed] [Google Scholar]
- 8.Buckwalter JA, Mankin HJ, Grodzinsky AJ. Articular cartilage and osteoarthritis. Instr. Course Lect. 2005;54:465–80. [PubMed] [Google Scholar]
- 9.Clarke IC. Articular cartilage: a review and scanning electron microscope study. 1. The interterritorial fibrillar architecture. J. Bone Joint Surg. Br. 1971;53:732–50. [PubMed] [Google Scholar]
- 10.Badami AS, Kreke MR, Thompson MS, Riffle JS, Goldstein AS. Effect of fiber diameter on spreading, proliferation, and differentiation of osteoblastic cells on electrospun poly(lactic acid) substrates. Biomaterials. 2006;27:596–606. doi: 10.1016/j.biomaterials.2005.05.084. [DOI] [PubMed] [Google Scholar]
- 11.Takahashi Y, Tabata Y. Effect of the fiber diameter and porosity of non-woven PET fabrics on the osteogenic differentiation of mesenchymal stem cells. J. Biomater. Sci. Polym. Ed. 2004;15:41–57. doi: 10.1163/156856204322752228. [DOI] [PubMed] [Google Scholar]
- 12.Hsu Y-M, Chen C-N, Chiu J-J, Chang S-H, Wang Y-J. The effects of fiber size on MG63 cells cultured with collagen based matrices. J. Biomed. Mater. Res. B. Appl. Biomater. 2009;91:737–45. doi: 10.1002/jbm.b.31450. [DOI] [PubMed] [Google Scholar]
- 13.Sisson K, Zhang C, Farach-Carson MC, Chase DB, Rabolt JF. Fiber diameters control osteoblastic cell migration and differentiation in electrospun gelatin. J. Biomed. Mater. Res. A. 2010;94:1312–20. doi: 10.1002/jbm.a.32756. [DOI] [PubMed] [Google Scholar]
- 14.Christopherson GT, Song H, Mao H-Q. The influence of fiber diameter of electrospun substrates on neural stem cell differentiation and proliferation. Biomaterials. 2009;30:556–64. doi: 10.1016/j.biomaterials.2008.10.004. [DOI] [PubMed] [Google Scholar]
- 15.Wang HB, Mullins ME, Cregg JM, McCarthy CW, Gilbert RJ. Varying the diameter of aligned electrospun fibers alters neurite outgrowth and Schwann cell migration. Acta Biomater. 2010;6:2970–8. doi: 10.1016/j.actbio.2010.02.020. [DOI] [PubMed] [Google Scholar]
- 16.Yao L, O’Brien N, Windebank A, Pandit A. Orienting neurite growth in electrospun fibrous neural conduits. J. Biomed. Mater. Res. B. Appl. Biomater. 2009;90:483–91. doi: 10.1002/jbm.b.31308. [DOI] [PubMed] [Google Scholar]
- 17.He L, Liao S, Quan D, Ma K, Chan C, Ramakrishna S, Lu J. Synergistic effects of electrospun PLLA fiber dimension and pattern on neonatal mouse cerebellum C17.2 stem cells. Acta Biomater. 2010;6:2960–9. doi: 10.1016/j.actbio.2010.02.039. [DOI] [PubMed] [Google Scholar]
- 18.Bashur C a, Shaffer RD, Dahlgren L a, Guelcher S a, Goldstein AS. Effect of fiber diameter and alignment of electrospun polyurethane meshes on mesenchymal progenitor cells. Tissue Eng. Part A. 2009;15:2435–45. doi: 10.1089/ten.tea.2008.0295. [DOI] [PubMed] [Google Scholar]
- 19.Bashur C a, Dahlgren L a, Goldstein AS. Effect of fiber diameter and orientation on fibroblast morphology and proliferation on electrospun poly(D,L-lactic-co-glycolic acid) meshes. Biomaterials. 2006;27:5681–8. doi: 10.1016/j.biomaterials.2006.07.005. [DOI] [PubMed] [Google Scholar]
- 20.Kumbar SG, Nukavarapu SP, James R, Nair LS, Laurencin CT. Electrospun poly(lactic acid-co-glycolic acid) scaffolds for skin tissue engineering. Biomaterials. 2008;29:4100–7. doi: 10.1016/j.biomaterials.2008.06.028. [DOI] [PMC free article] [PubMed] [Google Scholar]
- 21.Tian F, Hosseinkhani H, Hosseinkhani M, Khademhosseini A, Yokoyama Y, Estrada GG, Kobayashi H. Quantitative analysis of cell adhesion on aligned micro-and nanofibers. J. Biomed. Mater. Res. Part A. 2008;84:291–9. doi: 10.1002/jbm.a.31304. [DOI] [PubMed] [Google Scholar]
- 22.Ju YM, Choi JS, Atala A, Yoo JJ, Lee SJ. Bilayered scaffold for engineering cellularized blood vessels. Biomaterials. 2010;31:4313–21. doi: 10.1016/j.biomaterials.2010.02.002. [DOI] [PubMed] [Google Scholar]
- 23.Shanmugasundaram S, Chaudhry H, Arinzeh TL. Microscale versus nanoscale scaffold architecture for mesenchymal stem cell chondrogenesis. Tissue Eng. Part A. 2011;17:831–40. doi: 10.1089/ten.TEA.2010.0409. [DOI] [PubMed] [Google Scholar]
- 24.Wise JK, Yarin AL, Megaridis CM, Cho M. Chondrogenic differentiation of human mesenchymal stem cells on oriented nanofibrous scaffolds: engineering the superficial zone of articular cartilage. Tissue Eng. Part A. 2009;15:913–21. doi: 10.1089/ten.tea.2008.0109. [DOI] [PMC free article] [PubMed] [Google Scholar]
- 25.Li W-J, Jiang YJ, Tuan RS. Chondrocyte phenotype in engineered fibrous matrix is regulated by fiber size. Tissue Eng. 2006;12:1775–85. doi: 10.1089/ten.2006.12.1775. [DOI] [PubMed] [Google Scholar]
- 26.Noriega SE, Hasanova GI, Schneider MJ, Larsen GF, Subramanian A. Effect of fiber diameter on the spreading, proliferation and differentiation of chondrocytes on electrospun chitosan matrices. Cells. Tissues. Organs. 2012;195:207–21. doi: 10.1159/000325144. [DOI] [PMC free article] [PubMed] [Google Scholar]
- 27.Caron MMJ, Emans PJ, Coolsen MME, Voss L, Surtel D a M, Cremers A, van Rhijn LW, Welting TJM. Redifferentiation of dedifferentiated human articular chondrocytes: comparison of 2D and 3D cultures. Osteoarthritis Cartilage. 2012;20:1170–8. doi: 10.1016/j.joca.2012.06.016. [DOI] [PubMed] [Google Scholar]
- 28.Lin Z, Willers C, Xu J, Zheng M-H. The chondrocyte: biology and clinical application. Tissue Eng. 2006;12:1971–84. doi: 10.1089/ten.2006.12.1971. [DOI] [PubMed] [Google Scholar]
- 29.Tuli R, Tuli S, Nandi S, Huang X, Manner P a, Hozack WJ, Danielson KG, Hall DJ, Tuan RS. Transforming growth factor-beta-mediated chondrogenesis of human mesenchymal progenitor cells involves N-cadherin and mitogen-activated protein kinase and Wnt signaling cross-talk. J. Biol. Chem. 2003;278:41227–36. doi: 10.1074/jbc.M305312200. [DOI] [PubMed] [Google Scholar]
- 30.Li W-J, Tuli R, Okafor C, Derfoul A, Danielson KGKG, Hall DJDJ, Tuan RSRS. A three-dimensional nanofibrous scaffold for cartilage tissue engineering using human mesenchymal stem cells. Biomaterials. 2005;26:599–609. doi: 10.1016/j.biomaterials.2004.03.005. [DOI] [PubMed] [Google Scholar]
- 31.Talukdar S, Nguyen QT, Chen AC, Sah RL, Kundu SC. Effect of initial cell seeding density on 3D-engineered silk fibroin scaffolds for articular cartilage tissue engineering. Biomaterials. 2011;32:8927–37. doi: 10.1016/j.biomaterials.2011.08.027. [DOI] [PMC free article] [PubMed] [Google Scholar]
- 32.Huang AH, Stein A, Tuan RS, Mauck RL. Transient exposure to transforming growth factor beta 3 improves the mechanical properties of mesenchymal stem cell-laden cartilage constructs in a density-dependent manner. Tissue Eng. Part A. 2009;15:3461–72. doi: 10.1089/ten.tea.2009.0198. [DOI] [PMC free article] [PubMed] [Google Scholar]
- 33.Buxton A, Bahney C, Yoo J, Johnstone B. Temporal Exposure to Chondrogenic Factors Modulates Human Mesenchymal Stem Cell chondrogenesis in hydrogels. Tissue Eng. Part A. 2010;17:371–80. doi: 10.1089/ten.tea.2009.0839. [DOI] [PMC free article] [PubMed] [Google Scholar]
- 34.Kavalkovich KW, Boynton RE, Murphy JM, Barry F. Chondrogenic differentiation of human mesenchymal stem cells within an alginate layer culture system. Vitro Cell. Dev. Biol. Anim. 2002;38:457–66. doi: 10.1290/1071-2690(2002)038<0457:cdohms>2.0.co;2. [DOI] [PubMed] [Google Scholar]
- 35.Kobayashi S, Meir A, Urban J. Effect of cell density on the rate of glycosaminoglycan accumulation by disc and cartilage cells in vitro. J. Orthop. Res. 2008;26:493–503. doi: 10.1002/jor.20507. [DOI] [PubMed] [Google Scholar]
- 36.Ye J, Coulouris G, Zaretskaya I, Cutcutache I, Rozen S, Madden TL. Primer-BLAST: a tool to design target-specific primers for polymerase chain reaction. BMC Bioinformatics. 2012;13:134. doi: 10.1186/1471-2105-13-134. [DOI] [PMC free article] [PubMed] [Google Scholar]
- 37.Wang L, Seshareddy K, Weiss ML, Detamore MS. Effect of initial seeding density on human umbilical cord mesenchymal stromal cells for fibrocartilage tissue engineering. Tissue Eng. Part A. 2009;15:1009–17. doi: 10.1089/ten.tea.2008.0012. [DOI] [PMC free article] [PubMed] [Google Scholar]
- 38.Lee WC, Bhagat AAS, Huang S, Van Vliet KJ, Han J, Lim CT. High-throughput cell cycle synchronization using inertial forces in spiral microchannels. Lab Chip. 2011;11:1359–67. doi: 10.1039/c0lc00579g. [DOI] [PubMed] [Google Scholar]
- 39.Tan F, Naciri M, Dowling D, Al-Rubeai M. In vitro and in vivo bioactivity of CoBlast hydroxyapatite coating and the effect of impaction on its osteoconductivity. Biotechnol. Adv. 2011;30:352–62. doi: 10.1016/j.biotechadv.2011.07.008. [DOI] [PubMed] [Google Scholar]
- 40.Stockwell RA. The cell density of human articular and costal cartilage. J. Anat. 1967;101:753–63. [PMC free article] [PubMed] [Google Scholar]
- 41.DeLise a M, Fischer L, Tuan RS. Cellular interactions and signaling in cartilage development. Osteoarthritis Cartilage. 2000;8:309–34. doi: 10.1053/joca.1999.0306. [DOI] [PubMed] [Google Scholar]
- 42.Dessau W, von der Mark H, von der Mark K, Fischer S. Changes in the patterns of collagens and fibronectin during limb-bud chondrogenesis. J. Embryol. Exp. Morphol. 1980;57:51–60. [PubMed] [Google Scholar]
- 43.Darling EM, Hu JCY, Athanasiou K a. Zonal and topographical differences in articular cartilage gene expression. J. Orthop. Res. 2004;22:1182–7. doi: 10.1016/j.orthres.2004.03.001. [DOI] [PubMed] [Google Scholar]


