

Abstract
The central nucleus of the amygdala (CeA) is an important site for the reinforcing effects of ethanol and has been implicated in the development of alcohol dependence. The CeA GABAA receptor system is particularly vulnerable to the effects of acute and chronic ethanol. Previous work in the CeA focused on ethanol and phasic GABAA receptor signaling, but tonic GABAA receptor signaling in the rat CeA remains understudied. In the present study we found that the CeA contains two types of tonic conductance that are expressed in a cell type-specific manner. Low threshold bursting (LTB) and some regular spiking (RS) neurons have an ongoing tonic conductance that is mediated by the α1 GABAA receptor subunit and is insensitive to acute ethanol. Late spiking (LS) and a separate population of RS neurons do not display a persistent tonic conductance but have the potential for tonic signaling that is mediated by the δ GABAA receptor subunit and can be activated by increasing the ambient GABA concentration or by acute ethanol. Acute ethanol differentially alters the firing discharge of different CeA cell types. Chronic ethanol exposure produces a switch in tonic signaling such that the tonic conductance in LTB and some RS neurons is lost and an ongoing tonic conductance is present in LS and a separate population of RS neurons. Collectively, these data demonstrate cell type-specific tonic signaling in the CeA and provide new insight into how acute and chronic ethanol differentially alter specific aspects of inhibitory circuitry in the CeA.
INTRODUCTION
The central nucleus of the amygdala (CeA) is a component of the extended amygdala, the neural substrate for the motivational effects of alcohol and drugs of abuse (Alheid and Heimer, 1988). The CeA is composed predominantly of a heterogeneous population of GABAergic interneurons and projection neurons (Pitkanen and Amaral, 1994; Veinante and Freund-Mercier, 1998). The CeA GABAergic system is crucial in the behavioral effects of acute and chronic ethanol consumption (Hyytia and Koob, 1995; Roberts et al., 1996). GABAA receptor signaling is composed of two forms that function in a cell- and region-specific manner. Phasic signaling involves inhibitory postsynaptic currents (IPSCs) that result from ‘point to point’ transmission producing transient inhibition. Tonic signaling is characterized by persistent inhibitory currents resulting fromlow levels of ambient GABA acting at highly sensitized GABAA receptors [for review, see (Belelli et al., 2009; Glykys and Mody, 2007a; Semyanov et al., 2004)]. Previous work demonstrated that acute ethanol enhances GABA release in the rat CeA (Roberto et al., 2003; Roberto et al., 2004) and that chronic ethanol exposure increases GABA transmission in the CeA of ethanol-dependent rats (Roberto et al., 2004), however, no studies have investigated tonic inhibition in CeA neurons or the effects of ethanol on CeA tonic signaling.
GABAA receptors are composed of five individual subunits that confer specific biophysical properties. The α4, α6, and δ subunits are associated with increased sensitivity to GABA and low desensitization and are found in tonic GABAA receptors in a number of brain regions (Drasbek and Jensen, 2006; Jia et al., 2008; Stell et al., 2003). Recent reports describe tonic signaling mediated by GABAA receptors containing the α5 subunit in hippocampal (Caraiscos et al., 2004) and striatal neurons (Ade et al., 2008); and the α3 subunit in principal neurons of the basolateral amygdala (Marowsky et al., 2012). The δ, α1–3 and α5 subunits are all expressed in the CeA (Pirker et al., 2000), but no studies have investigated the presence of a tonic conductance mediated by GABAA receptors containing δ or α subunits in the rat CeA. Ethanol has been shown to augment tonic conductance in multiple brain regions (Carta et al., 2004; Hanchar et al., 2005; Jia et al., 2008), and the δ subunit has been implicated in this effect (Glykys et al., 2007; Wallner et al., 2003; Wei et al., 2004) however, the direct actions of ethanol on tonic receptors remains controversial (Baur et al., 2009; Borghese and Harris, 2007; Botta et al., 2007). Changes in tonic GABAA receptor currents in response to acute and chronic ethanol exposure have been shown in the hippocampus and thalamus (Jia et al., 2008; Liang et al., 2007; Wei et al., 2004) and chronic ethanol exposure has been shown to decrease α1 subunit mRNA and increase α6 subunit mRNA in the cerebellum (Mhatre and Ticku, 1992; Morrow et al., 1992), however studies in the central amygdala are lacking.
We recently reported the presence of tonic inhibition and selective ethanol sensitivity in CeA neurons in the mouse (Herman et al., 2013). Based on our previous findings, we hypothesized that tonic signaling would be present in rat CeA neurons and would display selective sensitivity to the effects of acute and chronic ethanol.
MATERIALS AND METHODS
Brain slice preparation
All procedures were approved by the Scripps Research Institutional Animal Care and Use Committee and were consistent with the National Institutes of Health Guide for the Care and Use of Laboratory Animals. We prepared slices from 52 adult male Sprague Dawley rats (150–350 g) subjected to brief anesthesia (3–5 % isoflurane) followed by rapid decapitation and removal of the brain to an ice-cold high-sucrose solution (pH 7.3–7.4) that contained (in mM): sucrose 206; KCl 2.5; CaCl2 0.5; MgCl2 7; NaH2PO4 1.2; NaHCO3 26; glucose 5; HEPES 5. Brains were cut into transverse sections (300 μm) on a vibrating microtome (Leica VT1000S, Leica Microsystems, Buffalo Grove, IL) and placed in an oxygenated (95% O2/5% CO2) artificial cerebrospinal fluid (aCSF) solution composed of the following (in mM): NaCl 120; KCl 2.5; EGTA 5; CaCl2 2 MgCl2 1; NaH2PO4 1.2; NaHCO3 26; Glucose 1.75; HEPES 5. Slices were incubated in this solution for 30 min at 35–37 °C, followed by 30 min equilibration at room temperature (21–22 °C). Following equilibration, a single slice was transferred to a recording chamber mounted on the stage of an upright microscope (Olympus BX50WI).
Electrophysiological recording
We visualized neurons using infrared differential interference contrast (IR-DIC) optics and an EXi Aqua camera (QImaging, Surrey, BC, Canada). A 60x magnification water immersion objective (Olympus) was used for identifying and approaching neurons. Whole-cell (voltage- and current-clamp) and juxtacellular (cell-attached) recordings were made with patch pipettes (4–6 MΩ; Warner Instruments) coupled to a Multiclamp 700B amplifier (Molecular Devices, Sunnyvale, CA), low-pass filtered at 2–5 kHz, digitized (Digidata 1440A; Axon Instruments), and stored on a computer using pClamp 10 software (Axon Instruments). Series resistance was typically <10 MΩ and was continuously monitored with a hyperpolarizing 10 mV pulse.
The intracellular solution used for all recordings was composed of (in mM): potassium chloride (KCl) 145; EGTA 5; MgCl2 5; HEPES 10; Na-ATP 2; Na-GTP 0.2. Drugs were dissolved in aCSF and applied either by Y-tubing application for local perfusion or by bath superfusion. To isolate inhibitory currents mediated by GABAA receptors, recordings (Vhold= −60mV) were performed in the presence of 6,7-dinitroquinoxaline-2,3-dione (DNQX, 20 μM), DL-2-amino-5-phosphonovalerate (AP-5, 30 μM) and CGP55845A (1 μM). All voltage-clamp and cell attached recordings were performed in a gap-free acquisition mode with a sampling rate per signal of 10 kHz or a total data throughput equal of 20 kHz (2.29 MB/min). All current clamp recordings were performed in sweeps with a sampling rate per signal of 10 kHz or a total data throughput equal of 20 kHz (2.29 MB/min) as defined by pClamp 10 Clampex software.
Immunohistochemistry
Adult male rats (n = 4) were deeply anesthetized by 35% chloral hydrate injection (0.4 ml, i.p., Sigma) followed by transcardial perfusion with phosphate buffered saline (PBS) and 4% paraformaldehyde (PFA). Brains were removed and stored in a cryoprotection solution (30% sucrose). Brains were cut into sequential sections (35 μm) on a Cryocut1800 (Reichert Jung), collected in PBS/0.1% Na-Azide solution and stored at 4° C. Free-floating sections were incubated in a 0.3% Triton X-100/5% normal donkey serum/0.1% bovine serum albumin/PBS blocking solution followed by overnight incubation in primary antibody diluted in 0.5% Tween-20/5% normal donkey serum/PBS. Primary antibodies used include anti-α1 and anti-δ GABAA receptor subunits (1:100; PhosphoSolutions). After washing, sections were transferred to a secondary antibody solution (CY3 donkey anti-rabbit 1:200; Jackson ImmunoResearch) for 1–2 h at room temperature. After washing, sections were mounted and coverslipped with DAPI-containing Vectashield (Vector Laboratories Inc). Slices were examined and images were digitally captured using a confocal microscope (Nikon A1R Confocal TIRF Storm Microscope with emission wavelengths 488, 568 and 647).
Chronic Intermittent Ethanol Vapor Inhalation
Four independent cohorts of 12 adult male Sprague Dawley rats (8–10 weeks, 250–350 g) were housed in chambers intermittently exposed to ethanol vapor (14 h) followed by air (10 h) for a period of 5–7 weeks. Blood alcohol levels (BALs) were determined 1–2 times weekly by tail-bleeding and terminal BALs were determined at the time of sacrifice. Average BALs from all cohorts were 188.4 ± 4.6 mg%. CIE vapor exposure produces somatic and motivational aspects of alcohol dependence during alcohol withdrawal (O’Dell et al., 2004).
Drugs and Chemicals
We purchased DNQX (6,7-dinitroquinoxaline-2,3-dione), AP-5 (DL-2-amino-5-phosphonovalerate) and CGP 55845A from Tocris Bioscience. We purchased bicuculline (BIC), nipecotic acid, SR-95531 (gabazine, GBZ), strychnine, 4,5,6,7-tetrahydroisoxazolo[5,4-c]pyridin-3-ol (THIP), tetrodotoxin (TTX), and zolpidem from Sigma.
Statistical Analysis
Tonic conductance was determined using Clampfit 10.2 (Molecular Devices) and a previously described method (Glykys and Mody, 2007b) in which the mean holding current (i.e., the current required to maintain the −60 mV membrane potential) was obtained by a Gaussian fit to a constrained all-points histogram over a 5 sec interval. Frequency, amplitude and decay of IPSCs were analyzed and visually confirmed using semi-automated threshold-based mini detection software (MiniAnalysis, Synaptosoft Inc.). IPSC characteristics were determined from a minimum of 60 events (time period of analysis varied as a product of individual event frequency). All detected events were used for event frequency analysis, but superimposed events were eliminated for amplitude and decay kinetic analysis. The frequency of firing discharge in cell-attached recordings was evaluated using threshold-based event detection analysis in Clampfit 10.2 (Molecular Devices). Events were analyzed for independent significance using a one-sample t-test and compared using a two-tailed t-test for independent samples, a paired two-tailed t-test for comparisons made within the same recording, and a one-way ANOVA with a Bonferroni post hoc analysis for comparisons made between 3 or more groups. All statistical analysis was performed using Prism 5.02 (GraphPad, San Diego, CA). Data are presented as mean ± standard error. In all cases, p<0.05 was the criterion for statistical significance.
RESULTS
Tonic inhibitory transmission in rat CeA neurons is cell type-specific
We used whole-cell current-clamp recordings and a step protocol of current injections to determine the cell type of CeA neurons by spiking characteristics, as previously described (Chieng et al., 2006; Dumont et al., 2002). CeA neurons are primarily composed of three main cell types: (1) low-threshold bursting (LTB), which exhibit one or two action potentials elicited by depolarizing current steps and after-hyperpolarization action potentials; (2) late spiking (LS), which exhibit delayed action potentials elicited by depolarizing current steps; and (3) regular spiking (RS), which exhibit regular action potentials in response to depolarizing current steps. A fourth type of CeA neuron has been described as fast spiking (FS), however these are not as frequently observed (Dumont et al., 2002). The most prevalent cells observed in the medial CeA were LTB and RS, however LS could be found there as well. FS cells were also encountered, but in an insufficient number to reliably characterize as an independent group, thus they were excluded from analysis. To examine cell types in equal proportions, we targeted certain cell types so that a statistically reliable sample was obtained for all experimental measures.
We assessed the tonic conductance in CeA cell types using whole-cell voltage-clamp recordings. A GABAA receptor-mediated tonic current was defined as the difference in holding current (i.e., the current required to maintain the neuron at −60mV) before and after application of the GABAA receptor antagonist gabazine. Focal application of gabazine (GBZ, 100 μM) produced a significant reduction in holding current in LTB and a subset of RS neurons [18.0 ± 1.6 and 12.8 ± 2.0 pA, respectively; *p<0.05, n = 13 (LTB) and n = 5 (RS); Figure 1A and 1C] that was not observed in LS and a separate portion of RS neurons [−0.3 ± 1.2 and −2.6 ± 0.8 pA, respectively; n = 6 (LS) and n = 7 (RS); Figure 1B and 1C]. These data suggest that CeA neurons possess a persistent tonic GABAA receptor conductance that is cell type-specific and is only expressed in LTB and a subset of RS neurons.
Figure 1.

A. Representative voltage-clamp recordings from a Low Threshold Bursting (LTB, left panel) and Regular Spiking (RS, right panel) CeA neuron during focal application of gabazine (GBZ, 100 μM). Dashed lines indicate average holding current. B. Representative voltage-clamp recordings from a Late Spiking (LS, left panel) and Regular Spiking (RS, right panel) CeA neuron during superfusion of gabazine (GBZ, 100 μM). Dashed lines indicate average holding current. C. Summary of the tonic current by cell type in CeA neurons revealed by focal application of GBZ [n = 13 (LTB); n = 5 (RS); n = 6 (LS); n = 7 (RS)] *p<0.05 by one-way ANOVA with Bonferroni post hoc comparison. D. Summary of the tonic current by cell type in CeA neurons revealed by superfusion of tetrodotoxin [TTX, 1 μM; n = 6 (LTB); n = 7 (RS); n = 6 (LS); n = 11 (RS)] *p<0.05 by one-way ANOVA with Bonferroni post hoc comparison.
We also examined the possibility of a glycine receptor-mediated tonic conductance in CeA neurons, as this form of tonic conductance has been shown in the spinal cord (Mitchell et al., 2007) and may be important in other brain areas. Focal application of the glycine receptor antagonist strychnine (1 μM) produced no change in holding current in any of the CeA neurons examined [−1.3 ± 1.2 pA, n = 5 (LTB); −1.1 ± 1.4 pA, n = 8 (RS) and −0.3 ± 0.3 pA, n = 4 (LS)]. In addition, strychnine produced no significant change in frequency or amplitude of sIPSCs in the CeA neurons examined. These data suggest that there is no ongoing glycine receptor-mediated tonic conductance in any of the CeA neurons that we studied.
To assess the impact of spontaneous phasic GABAA receptor transmission on the tonic conductance in CeA neurons, we applied the Na+ channel blocker tetrodotoxin (TTX) to block all action potential-mediated neurotransmission. Superfusion of TTX (1 μM) produced a significant reduction in holding current in LTB and a portion of RS neurons [16.2 ± 4.9 and 14.2 ± 2.8 pA, respectively; n = 6 (LTB) and n = 7 (RS); *p<0.05; Figure 1D]. In contrast, TTX produced no change in holding current in LS and a separate portion of RS neurons (−1.1 ± 1.3 and −0.5 ± 0.8 pA, respectively; n = 6 (LS) and n = 11 (RS); Figure 1D).
Cell type–specific expression of the α1 GABAA receptor subunit in the rat CeA
To examine the functional contribution of the α1 GABAA receptor subunit in the cell type-specific tonic conductance observed in CeA neurons, we used the benzodiazepine agonist zolpidem, which at low concentrations preferentially acts at GABAA receptors containing the α1 subunit (Sanger et al., 1996). Superfusion of zolpidem (100 nM) significantly increased holding current in LTB and a portion of RS neurons [18.4 ± 3.8 and 19.0 ± 3.0 pA, respectively; n = 6 (LTB) n = 5 (RS); Figure 2A and 2C) that was reversed by subsequent superfusion of the GABAA receptor antagonist bicuculline (BIC, 60 μM), producing a reduction in holding current in LTB and RS neurons [8.8 ± 2.1 and 10.5 ± 1.2 pA, respectively; n = 6 (LTB) n = 5 (RS); Figure 2A and 2D]. In contrast, superfusion of zolpidem (100 nM) only elicited a small increase in holding current in LS and a separate portion of RS neurons [3.9 ± 1.2 and 3.3 ± 2.7 pA; n = 5 (LS) n = 5 (RS); Figure 2B and 2C] and did not significantly change the holding current with subsequent superfusion of bicuculline in LS and RS neurons (−0.9 ± 0.9 and 0.4 ± 1.6 pA, respectively; n = 5 (LS) n = 5 (RS); Figure 2B and 2D]. Based on the electrophysiological data, we hypothesized that the α1 subunit was expressed in some, but not all, CeA neurons. Consistent with the functional data, immunohistochemical analysis demonstrates that the α1 GABAA receptor subunit is expressed in CeA neurons, but not in a uniform manner (Figure 2E). Collectively, the functional and anatomical data suggest that the ongoing tonic conductance observed in LTB and a portion of RS neurons is mediated by GABAA receptors containing the α1 subunit.
Figure 2.

A. Representative voltage-clamp recordings from a Low Threshold Bursting (LTB, left panel) and Regular Spiking (RS, right panel) CeA neuron during focal application of zolpidem (Zolp, 100 nM) followed by focal application of bicuclline (BIC, 60 μM). Dashed lines indicate average holding current. B. Representative voltage-clamp recordings from a Late Spiking (LS, left panel) and Regular Spiking (RS, right panel) CeA neuron during focal application of zolpidem (Zolp, 100 nM) followed by focal application of bicuclline (BIC, 60 μM). Dashed lines indicate average holding current. C. Summary of the tonic current by cell type in CeA neurons revealed by focal application of zolpidem [n = 6 (LTB); n = 5 (RS); n = 5 (LS); n = 5 (RS)] *p<0.05 by one-way ANOVA with Bonferroni post hoc comparison. D. Summary of the tonic current by cell type in CeA neurons revealed by focal application of bicuculline after zolpidem [n = 6 (LTB); n = 5 (RS); n = 5 (LS); n = 5 (RS)] *p<0.05 by one-way ANOVA with Bonferroni post hoc comparison. E. Photomicrograph (60x) of α1 GABAA receptor subunit expression (red fluorescence) and DAPI expression (blue fluorescence) in the CeA. Scale bar = 20 μm.
Cell type–specific expression of the δ GABAA receptor subunit in the rat CeA
To determine the functional contribution of the δ GABAA receptor subunit in the cell type-specific tonic conductance observed in CeA neurons, we used the δ subunit-preferring agonist gaboxadol (THIP). Focal application of THIP produced cell type-specific dose-responsive effects on tonic conductance in CeA neurons. Specifically, focal application of THIP did not significantly change holding current in LTB and a subset of RS neurons at concentrations ≤2 μM (Figure 3A and 3C) and only produced a significant increase in holding current in LTB and RS cells at concentrations ≥5 μM (19.2 ± 4.4 and 15.9 ± 2.4 pA, respectively; n = 5 (LTB) n = 7 (RS); Figure 3A and 3C). In contrast, focal application of 1 μM THIP significantly increased holding current in LS and a separate population of RS neurons [8.4 ± 2.6 and 9.9 ± 1.3 pA, respectively; n = 6 (LS) n = 5 (RS); Figure 3B and 3C]. Focal application of 2 μM THIP also produced an increase in holding current in LS and RS neurons [15.2 ± 4.8 and 24.0 ± 4.4 pA, respectively; n = 7 (LS) n = 6 (RS); Figure 3B and 3C), as did 5 μM THIP [44.9 ± 13.4 and 51.3 ± 34.0 pA, respectively; n = 7 (LS) n = 8 (RS); Figure 3B and 3C]. The increase in holding current with THIP application was significantly greater in LS and RS neurons as compared to LTB and RS neurons at THIP concentrations ≤2 μM (*p<0.05, Figure 3C). THIP application produced no cell-type specific alterations in sIPSC frequency or amplitude at any of the concentrations tested.
Figure 3.

A. Representative voltage-clamp recordings from Low Threshold Bursting (LTB, left panel) and Regular Spiking (RS, right panel) CeA neurons during focal application of THIP (1 μm, top panel; 2 μm, middle panel; 5 μm, lower panel). B. Representative voltage-clamp recordings from Late Spiking (LS, left panel) and Regular Spiking (RS, right panel) CeA neurons during focal application of THIP (1 μm, top panel; 2 μm, middle panel; 5 μm, lower panel). C. Summary of the tonic current by cell type in CeA neurons revealed by focal application of 1 μm THIP [n = 6 (LTB); n = 4 (RS); n = 6 (LS); n = 5 (RS)]; 2 μm THIP [n = 6 (LTB); n = 6 (RS); n = 7 (LS); n = 6 (RS)]; 5 μm THIP [n = 5 (LTB); n = 7 (RS); n = 7 (LS); n = 8 (RS)] *p<0.05 by one-way ANOVA with Bonferroni post hoc comparison. D. Photomicrograph (60x) of δ GABAA receptor subunit expression (red fluorescence) and DAPI expression (blue fluorescence) in the CeA. Scale bar = 20 μm.
Based on the electrophysiological data, we hypothesized that the δ subunit was expressed in some, but not all, CeA neurons. Consistent with the functional data, immunohistochemical analysis demonstrates that the δ GABAA receptor subunit is expressed in CeA neurons but not in a uniform manner (Figure 3D). Taken together, the anatomical and functional data suggest that the dose-dependent tonic conductance in LS and a portion of RS that is stimulated with THIP is mediated by GABAA receptors containing the δ subunit.
Blockade of GABA reuptake produces cell type–specific effects on tonic inhibitory transmission in the rat CeA
To examine whether blocking GABA reuptake in the CeA altered the cell type-specific expression of tonic conductance in CeA neurons, we performed recordings in all three types of CeA neurons during superfusion of the GABA reuptake inhibitor nipecotic acid followed by focal application of gabazine. Superfusion of nipecotic acid (NIP, 1 mM) produced an increase in holding current in LS and a subset of RS neurons [80.9 ± 12.4 and 99.6 ± 8.1 pA, respectively n = 6 (LS) and 5 (RS); Figure 4B and 4C] that was significantly greater than that observed in LTB and a portion of RS neurons [27.6 ± 4.2 and 45.2 ± 7.6 pA, respectively; n = 7 (LTB) and n = 5 (RS); *p<0.05; Figure 4A and 4C). Nipecotic acid produced no significant change in frequency, amplitude or decay of sIPSCs in any of the neurons examined. Subsequent application of gabazine in the same neurons produced a reduction in holding current in LS and a portion of RS neurons [69.3 ± 10.0 and 78.7 ± 7.0 pA, respectively n = 6 (LS) and n = 5 (RS); Figure 4B and 4D] that was significantly greater than that observed in LTB and a portion of RS neurons [23.7 ± 3.4 and 31.2 ± 6.1 pA, respectively; n = 7 (LTB) and n = 5 (RS); *p<0.05; Figure 4A and 4D]. Taken together, these data suggest that while LS and a portion of RS neurons in the CeA do not possess an ongoing tonic conductance, they do have the potential for a tonic conductance that is evident when the local GABA concentration is elevated.
Figure 4.

A. Representative voltage-clamp recordings from a Low Threshold Bursting (LTB, left panel) and Regular Spiking (RS, right panel) CeA neuron during superfusion of nipecotic acid (NIP, 1 mM) followed by focal application of gabazine (GBZ, 100 μM). Dashed lines indicate average holding current. B. Representative voltage-clamp recordings from a Late Spiking (LS, left panel) and Regular Spiking (RS, right panel) CeA neuron during superfusion of nipecotic acid (NIP, 1 mM) followed by focal application of gabazine (GBZ, 100 μM). Dashed lines indicate average holding current. C. Summary of the tonic current by cell type in CeA neurons revealed by focal application of nipecotic acid [n = 7 (LTB); n = 5 (RS); n = 6 (LS); n = 5 (RS)] *p<0.05 by one-way ANOVA with Bonferroni post hoc comparison. D. Summary of the tonic current by cell type in CeA neurons revealed by focal application of gabazine after nipecotic acid [n = 7 (LTB); n = 5 (RS); n = 6 (LS); n = 5 (RS)] *p<0.05 by one-way ANOVA with Bonferroni post hoc comparison. E. Summary of the correlation between the magnitude of tonic current stimulated by focal application of THIP (5 μM) and the magnitude of tonic current produced by superfusion of nipecotic acid in Regular Spiking (RS) CeA neurons; slope = 2.7 ± 0.4, R2 = 0.62, p<0.01, n = 10. F. Summary of the correlation between the magnitude of tonic current stimulated by focal application of THIP (5 μM) and the magnitude of tonic current blocked by focal application of gabazine in Regular Spiking (RS) CeA neurons; slope = 2.2 ± 0.2, R2 = 0.78, p<0.001, n = 10.
To test the hypothesis that the tonic conductance stimulated by elevating ambient GABA concentration is greater in δ subunit-containing RS CeA neurons, the δ subunit-preferring agonist THIP (5 μM) was applied and washed out prior to nipecotic acid superfusion and gabazine application. The magnitude of the tonic current stimulated by THIP was positively correlated with the magnitude of the tonic current induced by nipecotic acid (slope = 2.7 ± 0.4, R2 = 0.62, p<0.01, n = 10; Figure 4E). In addition, the magnitude of the tonic current stimulated by THIP was also positively correlated with the magnitude of the tonic current inhibited by gabazine (slope = 2.2 ± 0.2, R2 = 0.78, p<0.001, n = 10; Figure 4F). Collectively, these data suggest that δ subunit-containing LS and RS neurons have the potential for a tonic conductance that can be stimulated either directly by δ subunit-containing GABAA receptor agonists such as THIP, or indirectly by elevating the ambient GABA concentration in the CeA.
Ethanol produces cell type-specific effects on tonic and phasic signaling in rat CeA neurons
To examine the effects of ethanol on tonic signaling in CeA neurons, we performed whole cell voltage-clamp recording during focal application of ethanol (EtOH, 44 mM). Focal application of ethanol produced a significant increase in holding current in LS and a portion of RS neurons [13.2 ± 2.6 and 13.4 ± 0.5 pA, respectively; n = 6 (LS) and n = 5 (RS); Figure 5B and 5C] that was not observed in LTB and a separate portion of RS neurons [2.6 ± 0.5 and 5.2 ± 1.1 pA, respectively; *p<0.05; n = 6 (LTB) and n = 6 (RS); Figure 5A and 5C]. In addition, ethanol application significantly increased sIPSC frequency in LS and a portion of RS neurons [140.3 ± 8.3 and 139.7 ± 7.0 % of control, respectively; n = 6 (LS) and n = 5 (RS); Figure 5D] but produced no change in sIPSC frequency in LTB and a separate population of RS neurons [89.5 ± 4.4 and 104.5 ± 7.8 % of control, *p<0.05, respectively; n = 6 (LTB) and n = 6 (RS); Figure 5D]. These data suggest that ethanol selectively enhances both tonic and phasic inhibition in distinct populations of CeA neurons.
Figure 5.
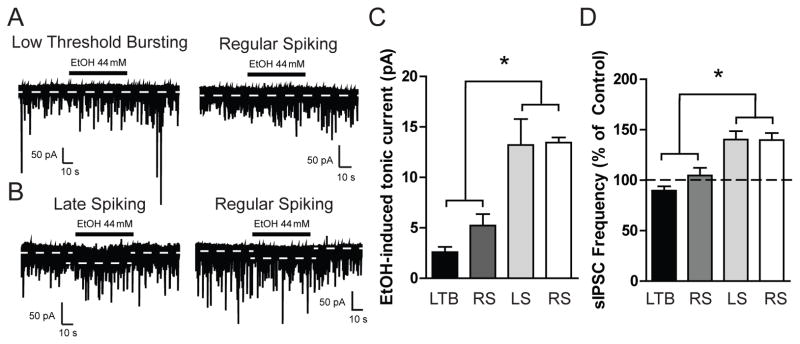
A. Representative voltage-clamp recordings from a Low Threshold Bursting (LTB, left panel) and Regular Spiking (RS, right panel) CeA neuron during focal application of ethanol (EtOH, 44 mM). B. Representative voltage-clamp recordings from a Late Spiking (LS, left panel) and Regular Spiking (RS, right panel) CeA neuron during focal application of ethanol (EtOH, 44 mM). C. Summary of the tonic current by cell type in CeA neurons produced by focal application of ethanol [n = 6 (LTB); n = 6 (RS); n = 6 (LS); n = 5 (RS)] *p<0.05 by one-way ANOVA with Bonferroni post hoc comparison. D. Summary of the change in sIPSC frequency by cell type in CeA neurons produced by focal application of ethanol [n = 6 (LTB); n = 6 (RS); n = 6 (LS); n = 5 (RS)] *p<0.05 by one-way ANOVA with Bonferroni post hoc comparison.
Ethanol produces divergent cell type-specific effects on the excitability of rat CeA neurons
The results of the whole-cell voltage-clamp recordings identified a cell type-selective ethanol sensitivity of both tonic and phasic GABAA receptor currents, but the impact of this selective enhancement of inhibitory signaling on overall excitability of CeA neurons cannot be determined in the voltage-clamp configuration. Thus, we performed extracellular cell-attached recordings to determine the effects of ethanol-induced changes in tonic and phasic conductance in specific populations of CeA neurons. Cell-attached recordings with superfusion of ethanol were completed first and then, following washout, we performed whole-cell current-clamp recordings in the same neurons to positively identify the cell type. Only neurons that displayed stable firing discharge and remained intact throughout the recording process, including cell typing, were included in the final data analysis. Superfusion of ethanol (EtOH 44 mM) significantly increased the firing discharge frequency in LTB and some RS neurons [266.5 ± 55.2 and 254.1 ± 62.0 % of baseline values, respectively; n = 6 (LTB) and n = 4 (RS); Figure 6A and 6C). In contrast, ethanol (EtOH 44 mM) significantly decreased the firing discharge frequency in LS and a separate population of RS neurons [33.7 ± 14.6 and 43.6 ± 8.1 % of baseline values, respectively; n = 3 (LS) and n = 6 (RS); Figure 6B and 6C). The differential effects of ethanol on LTB/RS and LS/RS neurons suggest that ethanol selectively engages specific components of CeA circuitry.
Figure 6.
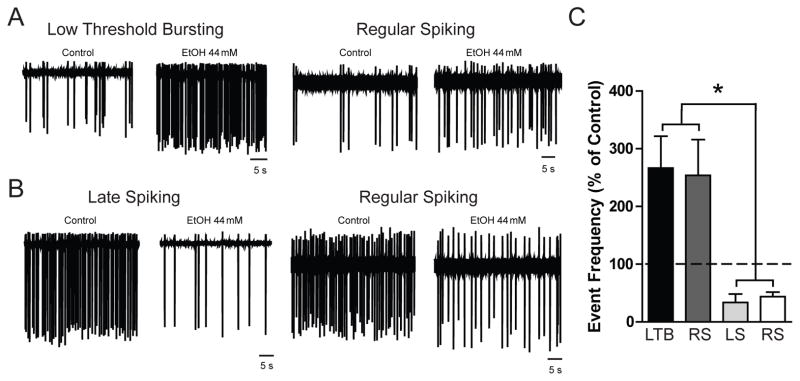
A. Representative cell-attached recording from a Low Threshold Bursting (LTB, left panels) and a Regular Spiking (RS, right panels) CeA neuron before (left trace) and during (right trace) superfusion of ethanol (EtOH 44 mM). B. Representative cell-attached recording from a Late Spiking (LS, left panels) and a Regular Spiking (RS, right panels) CeA neuron before (left trace) and during (right trace) superfusion of ethanol (EtOH 44 mM). C. Summary of the change in event frequency (% of Control) by cell type in CeA neurons produced by superfusion of ethanol [n = 6 (LTB); n = 4 (RS); n = 3 (LS); n = 6 (RS)] *p<0.05 by one-way ANOVA with Bonferroni post hoc comparison.
Chronic intermittent ethanol exposure produces cell type-specific alterations in tonic signaling in rat CeA neurons
To determine if chronic ethanol exposure alters cell-type-specific tonic GABAA receptor signaling, we performed whole cell voltage-clamp recordings in CeA neurons from naive and chronic intermittent ethanol (CIE) exposed rats. Focal application of gabazine (GBZ, 100 μM) onto CeA neurons from CIE rats did not significantly alter the holding current in LTB and a subset of RS neurons [1.5 ± 0.9 and 1.4 ± 1.3 pA, respectively; *p<0.05, n = 10 (LTB) and n = 5 (RS); Figure 7A and 7C] but did produce a significant reduction in holding current in LS and a separate portion of RS neurons [15.3 ± 2.9 and 11.2 ± 2.3 pA, respectively; n = 5 (LS) and n = 6 (RS); Figure 7B and 7C]. The change in holding current produced by gabazine in LTB/RS and LS/RS CeA neurons from CIE rats was significantly different from that observed in LTB/RS and LS/RS CeA neurons from naive rats (*p<0.05, Figure 7C). To examine the impact of changes in GABA release on tonic conductance following CIE, we performed whole cell voltage-clamp recordings with TTX to block action potential-dependent synaptic transmission. In contrast to what was observed in LTB/RS neurons from naïve rats, superfusion of TTX (1 μM) did not significantly alter the holding current in LTB/RS neurons (0.9 ± 2.5 and 3.3 ± 3.2 pA, respectively; n = 6 (LS) and n = 4 (RS); *p<0.05; Figure 7D). To determine if the cell type-specific changes in tonic conductance in CeA neurons are associated with changes in δsubunit receptor expression and/or function, we performed whole cell voltage-clamp recordings with THIP and ethanol. Focal application of 5 μM THIP onto CeA neurons from CIE rats produced an increase in holding current in all cells examined but the increase was significantly less in LTB/RS neurons [18.9 ± 2.9 and 11.9 ± 0.9 pA, respectively; n = 12 (LTB) n = 9 (RS)] than that observed in in LS/RS neurons [29.0 ± 6.7 and 43.5 ± 6.0 pA, respectively; n = 6 (LS) n = 6 (RS)] and in all cell types was not significantly different from that observed in CeA neurons from naïve rats (*p<0.05, Figure 7E). Focal application EtOH (44 mM) onto CeA neurons from CIE rats produced an increase in holding current that was significantly less in LTB/RS neurons [1.5 ± 0.8 and 2.2 ± 0.4 pA, respectively; n = 12 (LTB) n = 8 (RS)] than that observed in in LS/RS neurons [8.1 ± 1.2 and 10.8 ± 1.9 pA, respectively; n = 4 (LS) n = 6 (RS)] and in all cell types was not significantly different from that observed in CeA neurons from naïve rats (*p<0.05, Figure 7F). Collectively, these data suggest that CIE alters tonic inhibition in the CeA such that the ongoing tonic conductance in LTB/RS neurons is lost and an ongoing tonic conductance in LS/RS neurons appears. However, despite the ongoing tonic inhibition in LS/RS neurons, the ability of THIP and acute ethanol to stimulate further tonic inhibition in these neurons remains unchanged.
Figure 7.

A. Representative voltage-clamp recording of a Low Threshold Bursting (LTB) CeA neuron from a chronic intermittent ethanol (CIE) exposed rat during focal application of gabazine (GBZ, 100 μM). Dashed lines indicate average holding current. B. Representative voltage-clamp recording of a Late Spiking (LS) CeA neuron from a CIE exposed rat during focal application of gabazine (GBZ, 100 μM). Dashed lines indicate average holding current. C. Summary of the tonic current in LTB and RS CeA neurons from naïve and CIE exposed rats revealed by focal application of GBZ [n = 13 (naïve LTB), n = 10 (CIE LTB); n = 5 (naïve RS), n = 5 (CIE RS); n = 6 (naïve LS), n = 5 (CIE LS); n = 7 (naïve RS), n = 6 (CIE RS)] *p<0.05 by one-way ANOVA with Bonferroni post hoc comparison. D. Summary of the tonic current by cell type in CeA neurons from naïve and CIE exposed rats revealed by superfusion of tetrodotoxin [TTX, 1 μM; n = 6 (naïve LTB), n = 6 (CIE LTB); n = 7 (naïve RS), n = 4 (CIE RS)] *p<0.05 by one-way ANOVA with Bonferroni post hoc comparison. E. Summary of the tonic current by cell type in CeA neurons from naïve and CIE exposed rats revealed by focal application of 5 μm THIP [n = 5 (naïve LTB), n = 12 (CIE LTB); n = 7 (naïve RS), n = 9 (CIE RS); n = 7 (naïve LS), n = 6 (CIE LS); n = 9 (naïve RS), n = 6 (CIE RS)] *p<0.05 by one-way ANOVA with Bonferroni post hoc comparison. F. Summary of the tonic current by cell type in CeA neurons from naïve and CIE exposed rats produced by focal application of ethanol (EtOH 44 nM) [n = 6 (naïve LTB), n = 12 (CIE LTB); n = 6 (naïve RS), n = 8 (CIE RS); n = 6 (naïve LS), n = 4 (CIE LS); n = 5 (naïve RS), n= 6 (CIE RS)] *p<0.05 by one-way ANOVA with Bonferroni post hoc comparison.
DISCUSSION
The results of these studies demonstrate that the rat CeA possesses two kinds of tonic inhibition that are functionally and anatomically distinct and are expressed in a cell type-specific manner. Low threshold bursting (LTB) and some regular spiking (RS) neurons possess a persistently active tonic conductance that is mediated by GABAA receptors containing the α1 subunit, is driven by action potential-dependent GABA release, and is insensitive to the effects of acute ethanol (Figure 8). Late spiking (LS) and a separate group of RS neurons do not possess an ongoing tonic conductance but do display the potential for a tonic conductance that is mediated by GABAA receptors containing the δ subunit and can be stimulated by exogenous agonists, acute ethanol or by elevating the ambient GABA concentration (Figure 8). CeA neurons also displayed differential effects of ethanol on excitability as measured by firing discharge, which may be due to local synaptic connections between LS/RS neurons and LTB/RS neurons. Our previous study in mouse CeA neurons demonstrated this connectivity (Herman et al., 2013), and, although not directly demonstrated in the current study, likely exists due to the consistencies across studies, particularly with respect to cell-type specific effects of acute ethanol on firing. Chronic intermittent ethanol (CIE) exposure produces a functional switch in ongoing tonic inhibition in the CeA from LTB/RS neurons to LS/RS neurons, however there is no change in the ability of THIP and acute ethanol to further augment tonic conductance in these neurons, suggesting that these receptors are either not maximally activated or that THIP or ethanol is able to displace the ambient GABA to produce similar levels of activation as seen in naïve rats. Collectively, these findings provide new evidence for tonic conductance in rat CeA neurons and a novel mechanism by which acute and chronic ethanol selectively alters CeA inhibitory function in the rat.
Figure 8.

Schematic illustrating local cell type-specific phasic and tonic GABAA receptor transmission in CeA neurons from naïve (left panel) and chronic intermittent ethanol (CIE, right panel) rats. In naïve rats (left panel), Low Threshold Bursting (LTB) and some Regular Spiking (RS) CeA neurons possess an ongoing tonic conductance that is mediated by α1 subunit-containing tonic GABAA receptors located in or near the synaptic cleft. Late Spiking (LS) and a separate population of RS neurons do not possess an ongoing tonic conductance but do possess the potential for tonic conductance that is mediated by extrasynaptic δ subunit-containing tonic GABAA receptors that can be stimulated by elevations in ambient GABA or acute ethanol. Dashed lines indicate a proposed synaptic connection between LS/RS and LTB/RS neurons that may explain the differential effects of acute ethanol on CeA neuron firing. In CIE rats (right panel), the tonic conductance observed in LTB/RS CeA neurons from naïve rats is lost resulting in disinhibition and increased synaptic output (GABA release). In contrast, an ongoing tonic conductance is now present in LS/RS CeA neurons resulting in decreased synaptic output (GABA release).
The functional distinction between the tonic conductance in LTB/RS and LS/RS CeA neurons is determined by the subunit composition and concentration of ambient GABA available to these two distinct types of tonic GABAA receptors. The selective zolpidem sensitivity and immunohistochemical studies suggest that the persistent tonic signaling observed in LTB/RS neurons is mediated by GABAA receptors containing the α1 subunit. The decrease in holding current observed in these neurons with the Na+channel blocker tetrodotoxin (TTX) indicates that this tonic conductance is primarily driven by action potential-dependent GABA release, suggesting that these tonic GABAA receptors are located in or near the synaptic cleft (Figure 8). The THIP sensitivity and immunohistochemical studies in the LS/RS CeA neurons suggest that the potential for tonic signaling observed in this subpopulation of CeA neurons is mediated by GABAA receptors containing the δ subunit. The δ subunit is likely paired with an α4 or α6 subunit, as these subunits preferentially co-assemble in tonic GABAA receptors located in numerous brain regions including the hippocampus (Stell et al., 2003), cortex (Drasbek and Jensen, 2006), and thalamus (Sur et al., 1999). Tonic GABAA receptors that contain both the α1 and δ subunits have been reported in the hippocampus (Glykys et al., 2007). However this subunit assembly does not appear to be present in the CeA, or is only present in small amounts, as the CeA neurons that displayed THIP sensitivity were mutually exclusive with the CeA neurons that displayed zolpidem sensitivity, suggesting that the δ and α1 subunits do not co-assemble in the CeA. The relative insensitivity of LS/RS neurons to TTX in conjunction with previous reports indicating that the δ subunit is not found in the synaptic space (Nusser et al., 1998), strongly suggest that the tonic GABAA receptors located on LS/RS neurons are located in the extrasynaptic compartment (Figure 8). The lack of a persistent tonic conductance in LS/RS neurons further suggests that the extrasynaptic ambient GABA concentration in the CeA is too low to stimulate these receptors in the basal state. However, the finding that a tonic conductance can be stimulated in LS/RS neurons by blocking GABA reuptake suggests that this tonic inhibition may be of critical importance in conditions of elevated ambient GABA, such as chronic ethanol exposure (Roberto et al., 2004). The distinct anatomical and functional properties of the two types of tonic conductance found in specific cell types within the CeA is consistent with previous work demonstrating that inhibition generated by synaptic spillover is distinct from that generated by ambient GABA and that the δ subunit is associated solely with ambient GABA in the extrasynaptic space, not synaptic spillover (Bright et al., 2011).
These new findings on tonic conductance in the rat CeA are consistent with our recent work in corticotropin releasing factor receptor 1 (CRF1) fluorescent mice (Herman et al., 2013). We previously reported that CeA neurons expressing CRF1 were LTB or RS cells and possessed an ongoing tonic conductance that was mediated by GABAA receptors containing the α1 subunit. CeA neurons that did not express CRF1 were LS or RS cells and though they did not possess a persistent tonic conductance, they did display the potential for tonic signaling that was mediated by GABAA receptors containing the δ subunit. The relative consistency of these findings suggests that tonic conductance in the CeA is an important component of inhibitory function in the CeA and that it is conserved between species.
The cell type-specific ethanol sensitivity of phasic and tonic GABA transmission provides an additional layer of complexity in how ethanol can engage local inhibitory signaling in the CeA to produce disruptions in normal network function. We have previously demonstrated that acute ethanol increases action potential-independent GABA release in the majority of CeA neurons we studied (Roberto et al., 2003; Roberto et al., 2004). The present study expands on our understanding of the alterations in inhibitory signaling in the CeA produced by acute ethanol to include changes in spontaneous phasic signaling, tonic conductance, and overall excitability of CeA neurons. The increase in GABA release observed in LS and some RS neurons is consistent with our previous findings on action potential-independent GABA release. Acute ethanol produced no change in spontaneous GABA release in LTB and some RS neurons, suggesting that these cell types likely made up the minority of CeA neurons from which we previously observed no effect of acute ethanol on GABA release (Roberto et al., 2003; Roberto et al., 2004). The ability of ethanol to enhance both phasic and tonic inhibition in a subset of CeA neurons suggests that ethanol targets specific components of CeA circuitry to produce larger effects on overall network activity. Based on previous work demonstrating a seemingly paradoxical effect of anxiolytic drugs on GABA transmission in the CeA (Gilpin and Roberto, 2012) and our previous work in the mouse (Herman et al., 2013) we hypothesize that local interneurons represent the subpopulation of CeA neurons most vulnerable to the effects of acute ethanol and that the enhanced inhibition at local interneurons produced by ethanol results in dis-inhibition of neurons projecting out of the CeA. This configuration of local CeA microcircuitry would explain, in part, the differential effects of acute ethanol on the excitability of CeA neurons. The decrease in firing discharge observed in LS and some RS neurons with acute ethanol superfusion is likely due to enhanced phasic and tonic inhibition. The increase in firing observed in LTB and a separate population of RS neurons represents a more complicated phenomenon that likely involves local synaptic connectivity of these neurons. As these experiments were performed under pharmacological blockade of glutamate and GABAB receptors, one possibility is that LTB/RS neurons are under local inhibitory control by LS/RS neurons, and once that inhibition has been removed, LTB/RS neurons are disinhibited and increase their firing discharge. This is consistent with previous work demonstrating that LTB neurons project out of the CeA to other brain regions such as the parabrachial nucleus (Chieng et al., 2006) and the bed nucleus of the stria terminalis (Herman et al., 2013).
The changes in tonic conductance observed following CIE add an additional layer to the complex neuroadaptations in inhibitory circuitry in the CeA produced by chronic ethanol exposure. The loss of an ongoing tonic conductance in LTB/RS neurons likely results in the disinhibition and an increased level of GABA release from these neurons in the CIE state as compared to the naïve state (Figure 8). Conversely, the ongoing tonic conductance in LS/RS neurons following CIE likely results in decreased output (i.e., synaptic GABA release) from these neurons in the CIE state as compared to the naïve state (Figure 8). If LS/RS neurons represent local CeA interneurons that synapse onto LTB/RS neurons, then it is possible that the decrease in GABA release from LS/RS CeA neurons could be the source of the loss of ongoing tonic inhibition in LTB/RS neurons. If LTB/RS neurons represent a population of neurons that project out of the CeA, then the selective disinhibition of these neurons following CIE could provide one mechanism by which chronic ethanol alters CeA output to contribute to changes in other brain regions and the subsequent behavioral manifestations associated with alcohol dependence.
Collectively, the results of these studies highlight the need for a more complete understanding of CeA microcircuitry and how substances like ethanol engage components of that circuitry to produce disruptions in network function. The multiple layers of inhibitory control (phasic and tonic) within and between specific CeA cell populations provide numerous opportunities for alterations in local inhibitory signaling to regulate overall CeA output. Tonic inhibition, in particular, is a dynamic regulator of overall network activity (Krook-Magnuson and Huntsman, 2005; Semyanov et al., 2004). The two types of tonic inhibition in specific groups of CeA neurons and their divergent anatomical and functional properties provide significant opportunities for fine-tuned inhibitory control. This fine-tuned inhibitory regulation is a key component of normal physiologic CeA function and is likely responsible for the integration and selective processing of numerous disparate inputs. However, the multiple levels of inhibitory control observed in the CeA also provide multiple opportunities for pathological disruption and dysregulation of that inhibitory control at any level could significantly contribute to disease states like alcohol dependence.
Acknowledgments
This is manuscript number 26019 from The Scripps Research Institute. This work was supported by the Pearson Center for Alcoholism and Addiction Research and NIAAA grants F32AA020430, AA06420, AA015566, AA016985, and AA017447. We thank Chitra Mandyam for her technical assistance and Florence Varodayan for her valuable comments on the manuscript.
Footnotes
The authors have no conflict of interest to disclose.
AUTHOR CONTRIBUTIONS
MH and MR were both responsible for the concept and design of the study. MH was responsible for the acquisition of data. MH and MR were both responsible for the drafting, critical review, and final approval of the manuscript.
References
- Ade KK, Janssen MJ, Ortinski PI, Vicini S. Differential tonic GABA conductances in striatal medium spiny neurons. The Journal of neuroscience : the official journal of the Society for Neuroscience. 2008;28:1185–1197. doi: 10.1523/JNEUROSCI.3908-07.2008. [DOI] [PMC free article] [PubMed] [Google Scholar]
- Alheid GF, Heimer L. New perspectives in basal forebrain organization of special relevance for neuropsychiatric disorders: the striatopallidal, amygdaloid, and corticopetal components of substantia innominata. Neuroscience. 1988;27:1–39. doi: 10.1016/0306-4522(88)90217-5. [DOI] [PubMed] [Google Scholar]
- Baur R, Kaur KH, Sigel E. Structure of alpha6 beta3 delta GABA(A) receptors and their lack of ethanol sensitivity. Journal of neurochemistry. 2009;111:1172–1181. doi: 10.1111/j.1471-4159.2009.06387.x. [DOI] [PubMed] [Google Scholar]
- Belelli D, Harrison NL, Maguire J, Macdonald RL, Walker MC, Cope DW. Extrasynaptic GABAA receptors: form, pharmacology, and function. The Journal of neuroscience : the official journal of the Society for Neuroscience. 2009;29:12757–12763. doi: 10.1523/JNEUROSCI.3340-09.2009. [DOI] [PMC free article] [PubMed] [Google Scholar]
- Borghese CM, Harris RA. Studies of ethanol actions on recombinant delta-containing gamma-aminobutyric acid type A receptors yield contradictory results. Alcohol. 2007;41:155–162. doi: 10.1016/j.alcohol.2007.03.006. [DOI] [PMC free article] [PubMed] [Google Scholar]
- Botta P, Radcliffe RA, Carta M, Mameli M, Daly E, Floyd KL, Deitrich RA, Valenzuela CF. Modulation of GABAA receptors in cerebellar granule neurons by ethanol: a review of genetic and electrophysiological studies. Alcohol. 2007;41:187–199. doi: 10.1016/j.alcohol.2007.04.004. [DOI] [PMC free article] [PubMed] [Google Scholar]
- Bright DP, Renzi M, Bartram J, McGee TP, MacKenzie G, Hosie AM, Farrant M, Brickley SG. Profound desensitization by ambient GABA limits activation of delta-containing GABAA receptors during spillover. The Journal of neuroscience : the official journal of the Society for Neuroscience. 2011;31:753–763. doi: 10.1523/JNEUROSCI.2996-10.2011. [DOI] [PMC free article] [PubMed] [Google Scholar]
- Caraiscos VB, Elliott EM, You-Ten KE, Cheng VY, Belelli D, Newell JG, Jackson MF, Lambert JJ, Rosahl TW, Wafford KA, et al. Tonic inhibition in mouse hippocampal CA1 pyramidal neurons is mediated by alpha5 subunit-containing gamma-aminobutyric acid type A receptors. Proceedings of the National Academy of Sciences of the United States of America. 2004;101:3662–3667. doi: 10.1073/pnas.0307231101. [DOI] [PMC free article] [PubMed] [Google Scholar]
- Carta M, Mameli M, Valenzuela CF. Alcohol enhances GABAergic transmission to cerebellar granule cells via an increase in Golgi cell excitability. The Journal of neuroscience : the official journal of the Society for Neuroscience. 2004;24:3746–3751. doi: 10.1523/JNEUROSCI.0067-04.2004. [DOI] [PMC free article] [PubMed] [Google Scholar]
- Chieng BC, Christie MJ, Osborne PB. Characterization of neurons in the rat central nucleus of the amygdala: cellular physiology, morphology, and opioid sensitivity. The Journal of comparative neurology. 2006;497:910–927. doi: 10.1002/cne.21025. [DOI] [PubMed] [Google Scholar]
- Drasbek KR, Jensen K. THIP, a hypnotic and antinociceptive drug, enhances an extrasynaptic GABAA receptor-mediated conductance in mouse neocortex. Cerebral cortex. 2006;16:1134–1141. doi: 10.1093/cercor/bhj055. [DOI] [PubMed] [Google Scholar]
- Dumont EC, Martina M, Samson RD, Drolet G, Pare D. Physiological properties of central amygdala neurons: species differences. The European journal of neuroscience. 2002;15:545–552. doi: 10.1046/j.0953-816x.2001.01879.x. [DOI] [PubMed] [Google Scholar]
- Gilpin NW, Roberto M. Neuropeptide modulation of central amygdala neuroplasticity is a key mediator of alcohol dependence. Neuroscience and biobehavioral reviews. 2012;36:873–888. doi: 10.1016/j.neubiorev.2011.11.002. [DOI] [PMC free article] [PubMed] [Google Scholar]
- Glykys J, Mody I. Activation of GABAA receptors: views from outside the synaptic cleft. Neuron. 2007a;56:763–770. doi: 10.1016/j.neuron.2007.11.002. [DOI] [PubMed] [Google Scholar]
- Glykys J, Mody I. The main source of ambient GABA responsible for tonic inhibition in the mouse hippocampus. J Physiol. 2007b;582:1163–1178. doi: 10.1113/jphysiol.2007.134460. [DOI] [PMC free article] [PubMed] [Google Scholar]
- Glykys J, Peng Z, Chandra D, Homanics GE, Houser CR, Mody I. A new naturally occurring GABA(A) receptor subunit partnership with high sensitivity to ethanol. Nature neuroscience. 2007;10:40–48. doi: 10.1038/nn1813. [DOI] [PubMed] [Google Scholar]
- Hanchar HJ, Dodson PD, Olsen RW, Otis TS, Wallner M. Alcohol-induced motor impairment caused by increased extrasynaptic GABA(A) receptor activity. Nature neuroscience. 2005;8:339–345. doi: 10.1038/nn1398. [DOI] [PMC free article] [PubMed] [Google Scholar]
- Herman MA, Contet C, Justice NJ, Vale W, Roberto M. Novel subunit-specific tonic GABA currents and differential effects of ethanol in the central amygdala of CRF receptor-1 reporter mice. The Journal of neuroscience : the official journal of the Society for Neuroscience. 2013;33:3284–3298. doi: 10.1523/JNEUROSCI.2490-12.2013. [DOI] [PMC free article] [PubMed] [Google Scholar]
- Hyytia P, Koob GF. GABAA receptor antagonism in the extended amygdala decreases ethanol self-administration in rats. European journal of pharmacology. 1995;283:151–159. doi: 10.1016/0014-2999(95)00314-b. [DOI] [PubMed] [Google Scholar]
- Jia F, Chandra D, Homanics GE, Harrison NL. Ethanol modulates synaptic and extrasynaptic GABAA receptors in the thalamus. The Journal of pharmacology and experimental therapeutics. 2008;326:475–482. doi: 10.1124/jpet.108.139303. [DOI] [PMC free article] [PubMed] [Google Scholar]
- Krook-Magnuson EI, Huntsman MM. Excitability of cortical neurons depends upon a powerful tonic conductance in inhibitory networks. Thalamus & related systems. 2005;3:115–120. doi: 10.1017/S1472928807000192. [DOI] [PMC free article] [PubMed] [Google Scholar]
- Liang J, Suryanarayanan A, Abriam A, Snyder B, Olsen RW, Spigelman I. Mechanisms of reversible GABAA receptor plasticity after ethanol intoxication. The Journal of neuroscience : the official journal of the Society for Neuroscience. 2007;27:12367–12377. doi: 10.1523/JNEUROSCI.2786-07.2007. [DOI] [PMC free article] [PubMed] [Google Scholar]
- Marowsky A, Rudolph U, Fritschy JM, Arand M. Tonic inhibition in principal cells of the amygdala: a central role for alpha3 subunit-containing GABAA receptors. The Journal of neuroscience : the official journal of the Society for Neuroscience. 2012;32:8611–8619. doi: 10.1523/JNEUROSCI.4404-11.2012. [DOI] [PMC free article] [PubMed] [Google Scholar]
- Mhatre MC, Ticku MK. Chronic ethanol administration alters gamma-aminobutyric acidA receptor gene expression. Molecular pharmacology. 1992;42:415–422. [PubMed] [Google Scholar]
- Mitchell EA, Gentet LJ, Dempster J, Belelli D. GABAA and glycine receptor-mediated transmission in rat lamina II neurones: relevance to the analgesic actions of neuroactive steroids. The Journal of physiology. 2007;583:1021–1040. doi: 10.1113/jphysiol.2007.134445. [DOI] [PMC free article] [PubMed] [Google Scholar]
- Morrow AL, Herbert JS, Montpied P. Differential effects of chronic ethanol administration on GABA(A) receptor alpha1 and alpha6 subunit mRNA levels in rat cerebellum. Molecular and cellular neurosciences. 1992;3:251–258. doi: 10.1016/1044-7431(92)90045-4. [DOI] [PubMed] [Google Scholar]
- Nusser Z, Sieghart W, Somogyi P. Segregation of different GABAA receptors to synaptic and extrasynaptic membranes of cerebellar granule cells. The Journal of neuroscience : the official journal of the Society for Neuroscience. 1998;18:1693–1703. doi: 10.1523/JNEUROSCI.18-05-01693.1998. [DOI] [PMC free article] [PubMed] [Google Scholar]
- O’Dell LE, Roberts AJ, Smith RT, Koob GF. Enhanced alcohol self-administration after intermittent versus continuous alcohol vapor exposure. Alcoholism, clinical and experimental research. 2004;28:1676–1682. doi: 10.1097/01.alc.0000145781.11923.4e. [DOI] [PubMed] [Google Scholar]
- Pirker S, Schwarzer C, Wieselthaler A, Sieghart W, Sperk G. GABA(A) receptors: immunocytochemical distribution of 13 subunits in the adult rat brain. Neuroscience. 2000;101:815–850. doi: 10.1016/s0306-4522(00)00442-5. [DOI] [PubMed] [Google Scholar]
- Pitkanen A, Amaral DG. The distribution of GABAergic cells, fibers, and terminals in the monkey amygdaloid complex: an immunohistochemical and in situ hybridization study. The Journal of neuroscience : the official journal of the Society for Neuroscience. 1994;14:2200–2224. doi: 10.1523/JNEUROSCI.14-04-02200.1994. [DOI] [PMC free article] [PubMed] [Google Scholar]
- Roberto M, Madamba SG, Moore SD, Tallent MK, Siggins GR. Ethanol increases GABAergic transmission at both pre- and postsynaptic sites in rat central amygdala neurons. Proceedings of the National Academy of Sciences of the United States of America. 2003;100:2053–2058. doi: 10.1073/pnas.0437926100. [DOI] [PMC free article] [PubMed] [Google Scholar]
- Roberto M, Madamba SG, Stouffer DG, Parsons LH, Siggins GR. Increased GABA release in the central amygdala of ethanol-dependent rats. The Journal of neuroscience : the official journal of the Society for Neuroscience. 2004;24:10159–10166. doi: 10.1523/JNEUROSCI.3004-04.2004. [DOI] [PMC free article] [PubMed] [Google Scholar]
- Roberts AJ, Cole M, Koob GF. Intra-amygdala muscimol decreases operant ethanol self-administration in dependent rats. Alcoholism, clinical and experimental research. 1996;20:1289–1298. doi: 10.1111/j.1530-0277.1996.tb01125.x. [DOI] [PubMed] [Google Scholar]
- Sanger DJ, Morel E, Perrault G. Comparison of the pharmacological profiles of the hypnotic drugs, zaleplon and zolpidem. European journal of pharmacology. 1996;313:35–42. doi: 10.1016/0014-2999(96)00510-9. [DOI] [PubMed] [Google Scholar]
- Semyanov A, Walker MC, Kullmann DM, Silver RA. Tonically active GABA A receptors: modulating gain and maintaining the tone. Trends in neurosciences. 2004;27:262–269. doi: 10.1016/j.tins.2004.03.005. [DOI] [PubMed] [Google Scholar]
- Stell BM, Brickley SG, Tang CY, Farrant M, Mody I. Neuroactive steroids reduce neuronal excitability by selectively enhancing tonic inhibition mediated by delta subunit-containing GABAA receptors. Proceedings of the National Academy of Sciences of the United States of America. 2003;100:14439–14444. doi: 10.1073/pnas.2435457100. [DOI] [PMC free article] [PubMed] [Google Scholar]
- Sur C, Farrar SJ, Kerby J, Whiting PJ, Atack JR, McKernan RM. Preferential coassembly of alpha4 and delta subunits of the gamma-aminobutyric acidA receptor in rat thalamus. Molecular pharmacology. 1999;56:110–115. doi: 10.1124/mol.56.1.110. [DOI] [PubMed] [Google Scholar]
- Veinante P, Freund-Mercier MJ. Intrinsic and extrinsic connections of the rat central extended amygdala: an in vivo electrophysiological study of the central amygdaloid nucleus. Brain research. 1998;794:188–198. doi: 10.1016/s0006-8993(98)00228-5. [DOI] [PubMed] [Google Scholar]
- Wallner M, Hanchar HJ, Olsen RW. Ethanol enhances alpha 4 beta 3 delta and alpha 6 beta 3 delta gamma-aminobutyric acid type A receptors at low concentrations known to affect humans. Proceedings of the National Academy of Sciences of the United States of America. 2003;100:15218–15223. doi: 10.1073/pnas.2435171100. [DOI] [PMC free article] [PubMed] [Google Scholar]
- Wei W, Faria LC, Mody I. Low ethanol concentrations selectively augment the tonic inhibition mediated by delta subunit-containing GABAA receptors in hippocampal neurons. The Journal of neuroscience : the official journal of the Society for Neuroscience. 2004;24:8379–8382. doi: 10.1523/JNEUROSCI.2040-04.2004. [DOI] [PMC free article] [PubMed] [Google Scholar]