

Abstract
Autophagy is a catabolic process that has been implicated as both a tumor suppressor and in tumor progression. Here, we investigate this dichotomy in cancer biology by studying the influence of altered autophagy in Drosophila models of tissue overgrowth. We find that the impact of altered autophagy depends on both genotype and cell type. As previously observed in mammals, decreased autophagy suppresses Ras-induced eye epithelial overgrowth. By contrast, autophagy restricts epithelial overgrowth in a Notch-dependent eye model. Even though decreased autophagy did not influence Hippo pathway-triggered overgrowth, activation of autophagy strongly suppresses this eye epithelial overgrowth. Surprisingly, activation of autophagy enhanced Hippo pathway-driven overgrowth in glia cells. These results indicate that autophagy has different influences on tissue growth in distinct contexts, and highlight the importance of understanding the influence of autophagy on growth to augment a rationale therapeutic strategy.
Keywords: autophagy, epithelial growth, glia, cancer, Drosophila
Introduction
Autophagy is used to deliver cytoplasmic material to lysosomes for degradation. Autophagy is activated by multiple forms of stress, including reduced nutrient and oxygen levels, elevated reactive oxygen species, and organelle damage, many of which have been implicated in tumor formation and progression (1). During autophagy, cargoes such as damaged organelles and protein aggregates are recruited into double membrane autophagosome vesicles for clearance by fusion with lysosomes to form autolysosomes where they are degraded by hydrolases (2). Thus, autophagy serves to alleviate stress, and failure to do so could promote genetic alterations and tumor development (3, 4). Although much is known about how autophagy (Atg) genes control this process based on studies in yeast, our understanding of the multiple potential roles of autophagy in animal cell, tissue and tumor biology remains rudimentary.
Autophagy has been implicated as both a tumor suppressor and in tumor progression (5). This paradox may be explained by multiple possibilities, including inherent differences in the cells and tissues where tumors arise, the presence of secondary genetic alterations in tumor promoting genes, and numerous others. For example, recent studies indicate that p53 status influences the impact of autophagy on K-Ras-triggered mouse models of pancreatic and lung cancers; loss of Atg gene function inhibits tumor progression in the presence of p53, but in the absence of p53 loss of autophagy accelerates tumor onset (6, 7). In addition, much of what is known about the influence of autophagy on tumor biology is based on studies of the Beclin1/Atg6 gene, and it is now clear that this gene influences a wide variety of vesicle trafficking processes, including endocytosis, protein secretion and autophagy (8, 9). Furthermore, while the role of autophagy in oncogenic Ras-driven tumor growth and the dependence on p53 status has been investigated, the influence of autophagy in different tumor contexts is largely unknown. Thus, studies of the role of autophagy in other tumor models are needed.
The fruit fly Drosophila melanogaster serves as a useful model to study epithelial growth, and the influence of oncogenes and tumor suppressors on epithelial overgrowth. Mammalian oncogenes and tumor suppressors are conserved in Drosophila and their deregulation can cause tissue overgrowth (10, 11). For example, oncogenic Ras which is associated with approximately 30% of human tumors (12), triggers epithelial overgrowth and also inhibits apoptosis in Drosophila (13-15). De-regulation of Notch causes certain forms of cancer in humans (16), and is also associated with severe overgrowth in Drosophila. One striking example of Notch-induced overgrowth is the eyeful phenotype which is characterized by strong eye overgrowth and secondary metastasis-like growths (17). Another growth regulatory pathway which is deregulated in human cancer is the Hippo pathway which was originally discovered in Drosophila (18). Critical components in the Hippo pathway include the Hippo and Warts kinases which prevent the transcriptional co-activator Yorkie (YAP in mammals) from translocating to the nucleus to induce cell proliferation. In addition, mutations in the tumor suppressor scribble (scrib) cause loss of apical-basal polarity, failure to differentiate and apoptosis that involves c-Jun N-terminal kinase (JNK)-induced signaling (19). However, if scrib mutant cell clones are protected from apoptosis by expression of transgenes encoding either dominant negative JNK (JNKDN), the caspase inhibitor p35 or the oncogene RasV12 (referred to as scrib+JNKDN, scrib+P35 or scrib+RasV12), scrib mutant cells survive and unleash their full oncogenic activity, resulting in over-proliferation and formation of neoplastic tissue masses (20-22).
The influence of autophagy on tissue overgrowth caused by most of these growth regulatory factors is unknown. Here, we investigate the influence of altered autophagy on tissue overgrowth in Drosophila. We discover that the influence of loss and gain of autophagy differs depending on the growth-inducing stimulus and tissue. Like in mammals, autophagy is required for Ras-triggered epithelial overgrowth. In contrast, autophagy restricts increased epithelial growth in the Notch-dependent eyeful overgrowth model. Furthermore, increased growth driven by either loss of the growth regulator hippo or mis-expression of Yorkie is not influenced by decreased Atg gene function. Nevertheless, ectopic autophagy strongly suppresses epithelial overgrowth in these models. In contrast, activation of autophagy enhanced Yorkie-driven overgrowth in glia cells. These studies highlight the potential complexities of modulating autophagy in different in vivo models of cell and tissue overgrowth, and encourage a greater understanding of the influence of modulating autophagy for therapeutic purposes.
Results
Autophagy can enhance or suppress tissue growth depending on genotype
Studies in mammalian Ras-driven cancer models indicate that autophagy is required for tumor progression (6, 7, 23). As previously described, expression of activated RasV12 combined with loss of scrib in the Drosophila eye epithelium results in a strong tissue overgrowth phenotype (note the increase in GFP-expressing mutant tissue) compared to equivalent wild type tissue (Figure 1a,a′,b,b′) (20, 22). We analyzed the effect of reduced autophagy on scrib+RasV12-driven overgrowth by expression of RNAi against Atg1 (Atg1IR). Similar to mammalian K-Ras-driven models of cancer, Atg1IR suppresses either scrib+RasV12- or RasV12-driven overgrowth (Figure 1c,c′ and Supplementary Figure 1b,c, note the reduction in GFP-expressing mutant tissue), indicating that autophagy is required for tissue overgrowth.
Figure 1.
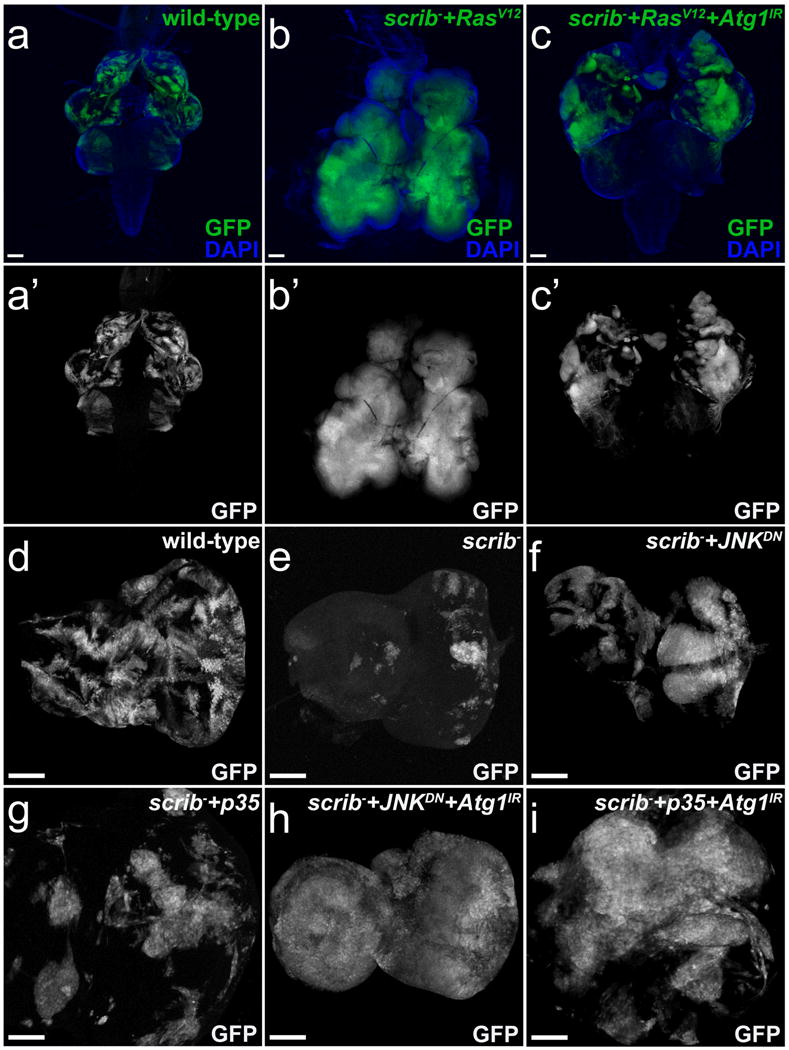
Activated Ras status impacts the influence of autophagy on growth. Wild-type control clones (a,a′,d), scrib clones (e) and scrib mutant clones expressing various transgenes (b,b′,c,c′,f,g,h,i) were induced by MARCM and are labeled by GFP (green in a-c, grey in a′-c′,d-i). (a-c′) Tissue complexes of mosaic eye-antennal imaginal discs and optic lobes of wild-type (a), scrib+RasV12 (b) and scrib+RasV12+Atg1IR (c) 3rd instar larvae labeled for GFP and DAPI (green and blue in a-c) or just GFP (grey in a′-c′). DAPI (blue) marks the outline of the tissue. Expression of RasV12 dramatically increases scrib clone size (compare a′ and b′). The eye-antennal imaginal discs are strongly overgrown and absorb the optic lobe such that both tissues cannot be separated (b). RNAi targeting Atg1 strongly reduces scrib+RasV12 clone size (c′). The outline of the optic lobe is visible (c). (d-g) Mosaic eye antennal imaginal discs of wild-type (d) scrib (e) scrib+JNKDN (f) and scrib+p35 (g) 3rd instar larvae labeled for GFP (grey). Expression of either dominant negative JNK (JNKDN) or the caspase inhibitor p35 strongly increases scrib cell clone size (f,g) compared to wild-type (d). (h-i) Mosaic eye antennal imaginal discs of scrib+JNKDN+Atg1IR (h) and scrib+p35+Atg1IR (i) 3rd instar larvae labeled for GFP (grey). Decreased Atg1 function increases scrib clone size even more (h,i compared to f,g). IR – inverted repeats. Scale bars, 100 μm. Genotypes: (a,a′) yw ey-FLP/+; Act>y+>gal4, UAS-GFP56ST/+; FRT82B tub-Gal80/FRT82B w+. (b,b′) yw ey-FLP/+; Act>y+>gal4, UAS-GFP56ST/+; FRT82B tub-Gal80/RasV12FRT82B scrib2. (c,c′) yw ey-FLP/+; Act>y+>gal4, UAS-GFP56ST/UAS-Atg1IR; FRT82B tub-Gal80/UAS-RasV12FRT82B scrib2. (d) yw ey-FLP/+; Act>y+>gal4, UAS-GFP56ST/+; FRT82B tub-Gal80/FRT82B w+. (e) yw ey-FLP/+; Act>y+>gal4, UAS-GFP56ST/sp or Cyo; FRT82B tub-Gal80/FRT82B scrib2. (f) yw ey-FLP/UAS-bskDN; Act>y+>gal4, UAS-GFP56ST/sp or Cyo; FRT82B tub-Gal80/FRT82B scrib2. (g) yw ey-FLP/+; Act>y+>gal4, UAS-GFP56ST/UAS-p35; FRT82B tub-Gal80/FRT82B scrib2. (h) yw ey-FLP/UAS-bskDN; Act>y+>gal4, UAS-GFP56ST/UAS-Atg1IR; FRT82B tub-Gal80/FRT82B scrib2. (i) yw ey-FLP/+; Act>y+>gal4, UAS-GFP56ST/UAS-Atg1IR, UAS-p35; FRT82B tub-Gal80/FRT82B scrib2.
RasV12 not only protects cells from apoptosis, but also has other oncogenic effects that drive tumor growth. To uncouple these different effects of RasV12 with respect to autophagy, we blocked apoptosis by expression of either JNKDN or p35, but did not induce any other oncogenic activity. As reported previously (20), inhibition of apoptosis is sufficient to trigger scrib-induced overgrowth in epithelial tissue (Figure 1d,e,f,g, note the increase in GFP-expressing mutant tissue compared to control). Surprisingly, in contrast to scrib+RasV12, in scrib mutants with impaired apoptosis by expression of either JNKDN or p35, reduction of autophagy using the same Atg1 RNAi transgene as in Figure 1c enhances scrib-induced overgrowth (Figure 1h, i, note the increase in GFP-expressing mutant tissue compared to tissue lacking GFP). Most strikingly, autophagy-deficient scrib+JNKDN cells make up almost the entire eye tissue (Figure 1h) suggesting that autophagy restricts growth of apoptosis-inhibited scrib cell clones. Similarly, reduction of autophagy in apoptotic scrib mutant cells slightly increases clone size (Supplementary Figure 1d,e). These results indicate that oncogenic RasV12 requires autophagy to drive strong tissue overgrowth; in the presence of RasV12, autophagy promotes growth of scrib mutant tissue (Figure 1c), and in the absence of RasV12, autophagy restricts tissue growth (Figure 1h, i). These observations are consistent with data from mammalian tumor models and encourage further characterization of the role of autophagy in other oncogenic and cellular contexts in Drosophila.
Autophagy suppresses eyeful-induced tissue overgrowth
To examine the role of autophagy in a different oncogenic fly model, we used the established tissue overgrowth model called eyeful. eyeful is a Notch-dependent overgrowth model resulting from mis-expression of the Notch ligand Delta and of two chromatin modifiers, lola and pipsqueak, in the eye (17). The eyeful phenotype consists of eye tissue overgrowth that ranges from mild overgrowth to overgrowth with tissue folds (Figure 2a,b,f,g) as well as less frequent secondary ”metastasis-like” eye growths in other parts of the body (17). The eyeful-induced overgrowth is visible in developing larval antennal-eye precursor tissues, called imaginal discs (Figure 2l,m). To examine a potential contribution of autophagy to the eyeful phenotype, we decreased the function of 12 different Atg genes (Atg1, Atg6, Atg12, Atg5, Atg7, Atg4a, Atg4b, Atg8a, Atg8b, Atg3, Atg9, Atg18) by RNAi. Strikingly, knock-down of any of these Atg genes strongly enhances eyeful-induced tissue overgrowth in both the adult eye (compare Figure 2c,d,e to 2b; summarized in Figure 2j) and in imaginal discs (compare Figure 2n,o to 2m), but do not influence development of wild-type eye tissue (Supplementary Figure 2). Even more strikingly, these eyes do not only display enhanced overgrowth, but often grow out from the eye in the form of projections (Figure 2h,i; arrows). Knock-down of the 12 Atg genes in the eyeful overgrowth model resulted in significant increases in the percentage of animals with eye projections (Figure 2k). eyeful imaginal disc cells also possessed increased mCherry-Atg8 autophagy reporter puncta (compare Supplementary Figure 3d' to b') and accumulate Ref(2)P proteins (Drosophila ortholog of p62 and autophagy substrate) in areas where mCherry-Atg8 labeling is either low or absent (compare Supplementary Figure 3d” to b”). These data indicate that in the context of oncogenic Notch signaling, autophagy restricts growth. This is in strong contrast to the influence of autophagy as an enhancer of RasV12-driven overgrowth (Figure 1c). These observations indicate that autophagy differentially influences tissue growth depending on the oncogenic activity in a given epithelium.
Figure 2.
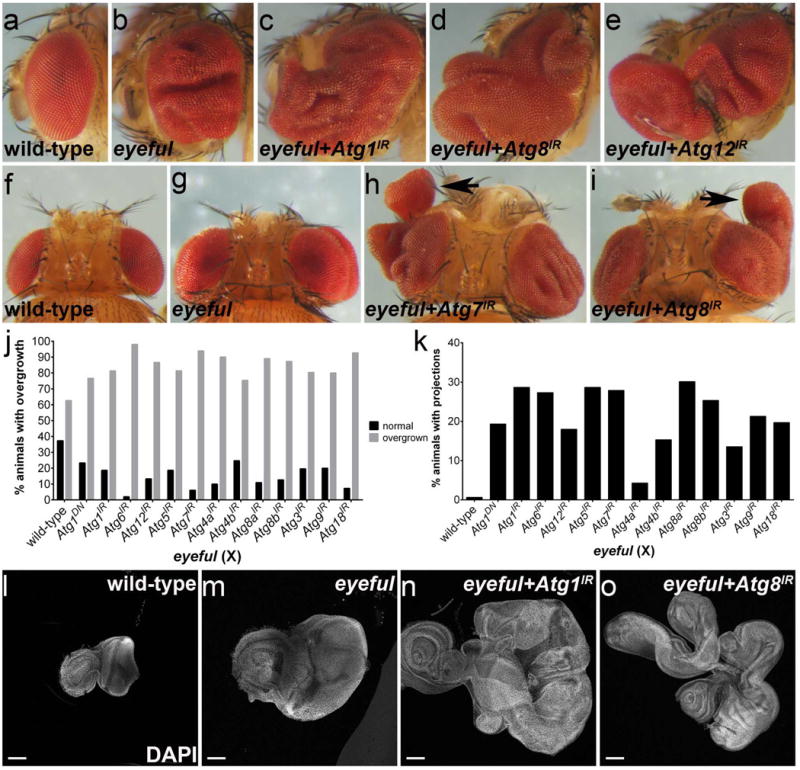
Endogenous autophagy restricts eyeful-induced tissue overgrowth. (a-e) Side view images of adult eyes. (a) Wild-type. (b) eyeful. (c-e) Expression of UAS-based RNAi transgenes targeting Atg1, Atg8, or Atg12 enhances eyeful induced overgrowth. (f-i) Top views of adult heads. (f) Wild-type. (g) eyeful. (h,i) Expression of UAS-based RNAi transgenes targeting Atg7 (h) and Atg8 (i) strongly enhances eyeful-induced overgrowth and also triggers eye tissue outgrowth in the form of projections (arrows). (j) Quantification of animals with overgrown adult eyes. Expression of transgenes encoding a dominant negative Atg1 (Atg1DN) and RNAi constructs targeting Atg1, Atg6, Atg12, Atg5, Atg7, Atg4, Atg8, Atg3, Atg9, and Atg18 increases the percentage of eyeful animals with overgrown eyes. Overgrown eyes include eyes with tissue folds, eye projections and secondary eye growths. (k) Quantification of animals with eye projections only. Expression of transgenes encoding a dominant negative Atg1 (Atg1DN) and RNAi constructs targeting Atg1, Atg6, Atg12, Atg5, Atg7, Atg4, Atg8, Atg3, Atg9, and Atg18 increases the percentage of eyeful animals with eye projections. (l-o) 3rd instar larval eye-antennal imaginal discs stained with DAPI to reveal disc outline. Scale bars, 100 μm. (l) wild-type. (m) eyeful. (n,o) Knockdown of Atg1 and Atg8 enhances eyeful-induced overgrowth. Genotypes: (a,f,l) CantonS; (b,g,m) eyeful/+; (c) eyeful/UAS-Atg1IR; (d,i,o) eyeful/UAS-Atg8IR; (e) eyeful/UAS-Atg12IR; (h) eyeful/UAS-Atg7IR; (n) eyeful/UAS-Atg1IR. The graphs in (j) and (k) express the indicated transgenes in an eyeful background. 150 flies per genotype were counted. IR – inverted repeats.
To further characterize the function of autophagy in tissue growth, we tested the effect of increased autophagy on the eyeful model. Expression of Atg1 is sufficient to induce autophagy in multiple Drosophila cell and tissue types (24-26). Consistent with our loss-of-Atg gene function data, induction of autophagy by expression of Atg1 strongly suppresses eyeful-induced tissue overgrowth (Figure 3a,b). We next addressed if suppression of eyeful tissue overgrowth by Atg1 expression depends on Atg gene function. To accomplish this task, we co-expressed Atg1 with RNAi transgenes targeting either Atg8 (Atg8IR) or Atg12 (Atg12IR) in eyeful animals and examined eye tissue overgrowth. Expression of either Atg8IR or Atg12IR reverts the Atg1-induced suppression of the eyeful overgrowth back to overgrown eye tissue (Figure 3c, d) indicating that suppression of eyeful overgrowth by Atg1 expression is dependent on the autophagy pathway. Taken together, these results indicate that ectopically induced autophagy functions as a suppressor of eyeful-induced tissue overgrowth.
Figure 3.
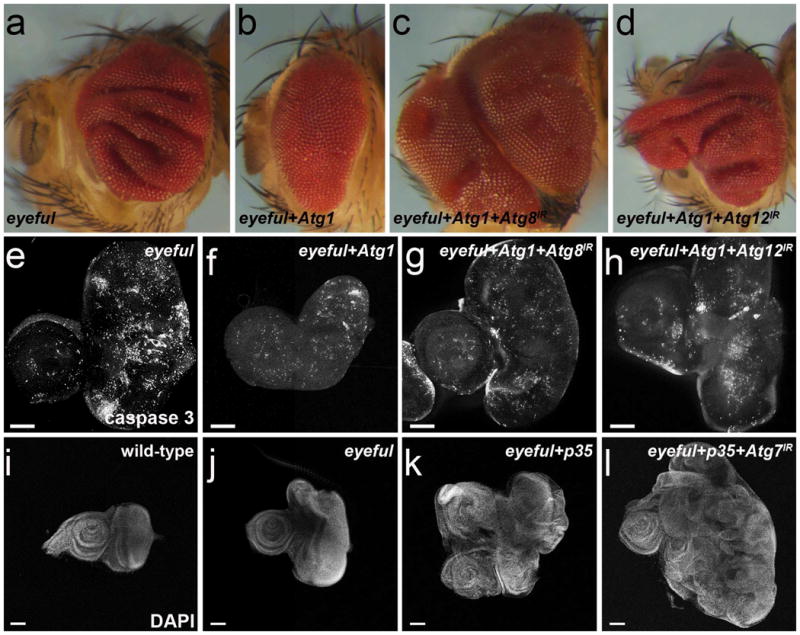
Suppression of eyeful overgrowth by Atg1 expression is dependent on autophagy. (a-d) Side view images of adult eyes. (a) eyeful. (b) Expression of Atg1 suppresses eyeful-induced overgrowth. (c,d) Expression of RNAi transgenes targeting Atg8 and Atg12 reverses the suppression of eyeful induced overgrowth by Atg1. Eye tissue is overgrown compared to (a,b). IR – inverted repeats. (e-h) 3rd instar larval eye-antennal imaginal discs labeled for cleaved caspase-3 (cCas3) to detect apoptotic cells. (e) cCas3 labeling of eyeful discs. (f) cCas3 labeling of eyeful discs expressing Atg1. (g,h) cCas3 labeling of eyeful discs co-expressing Atg1 and RNAi transgenes targeting Atg8 or Atg12. (i-l) 3rd instar larval eye-antennal imaginal discs labeled with DAPI to outline discs. (i) Wild-type; (j) eyeful. (k) Expression of p35 in eyeful animals enhances overgrowth. (I) Expression of p35 and RNAi transgene targeting Atg7 further enhances overgrowth. Scale bars, 100 μm. Genotypes: (a,e) eyeful/+. (b,f) eyeful/+; UAS-Atg1 GS10797/+. (c,g) eyeful/CyO; UAS-Atg8IR, UAS-Atg1 GS10797/+. (d,h) eyeful/UAS-Atg12IR, UAS-Atg1 GS10797/+. (i) CantonS. (j) eyeful/+. (k) eyeful/UAS-p35. (l) eyeful/UAS-p35; UAS-Atg7IR/+.
Atg1-induced autophagy can induce either caspase-dependent or -independent cell death (24, 25). Therefore, we assessed the role of caspases in the suppression of eyeful-induced overgrowth by Atg1 expression. To assay apoptotic cell death, we immuno-labeled larval antennal-eye disc tissues with antibodies to detect cleaved caspase-3. Interestingly, we observed cleaved caspases in eyeful larval eye discs alone (Figure 3e) suggesting that eyeful induces apoptosis that is associated with overgrowth. Although Atg1 expression in eyeful tissue is also associated with elevated cleaved caspase-3 labeling (Figure 3f), it is unclear if it is increased over eyeful alone (Figure 3e). Importantly, cleaved caspase-3 labeling was observed when either Atg8IR or Atg12IR were co-expressed with Atg1 in eyeful tissue (Figure 3g,h). Combined, these results suggest that cleaved caspase-3 labeling is associated with eyeful-induced tissue overgrowth, but does not appear to be associated with Atg1-triggered autophagy.
Our data suggest that apoptosis does not play a significant role in Atg1-dependent suppression of eyeful-induced tissue overgrowth. Nevertheless, because we observed cleaved caspase-3 in eyeful tissue (Figure 3e), we explored the role of caspases for eyeful-induced tissue overgrowth by expressing the caspase inhibitor p35 in eyeful tissue. This treatment strongly enhances tissue overgrowth (Figure 3k) compared to eyeful alone (Figure 3j). In addition, decreased Atg7 function further enhanced the eyeful and p35 overgrowth phenotype (Figure 3k,l). Combined, these data suggest that both caspases and autophagy restrict tissue growth in the eyeful model.
Ectopic autophagy suppresses or enhances hippo pathway-induced overgrowth depending on tissue
The evolutionarily conserved Hippo signaling pathway is important for proper growth control and tumorigenesis. hippo is a tumor suppressor, as loss of hippo causes tissue overgrowth (Figure 4a,b, e,f) (18). We reduced autophagy by expression of Atg8IR in hippo- mutant cells. However, this treatment had little effect on either mutant cell clone or tissue size in imaginal discs and in adult heads (Figure 4c,g). By contrast, induction of autophagy by mis-expression of Atg1 in hippo- mutant cell clones dramatically reduces mutant clone size in larval imaginal eye tissue and adult eyes (Figure 4d,h). Thus, while endogenous autophagy does not restrict hippo--induced tissue overgrowth, the induction of autophagy strongly suppresses hippo- induced tissue overgrowth. Similarly, mis-expression of the Hippo pathway transcription factor Yorkie in the eye causes strong eye overgrowth which is suppressed by simultaneous overexpression of Atg1 (Figure 4i-l). Analyses of imaginal discs showed that expression of Atg1 decreases Yorkie-induced cell proliferation based on phospo-histone H3 (PH3) antibody staining (Supplementary Figure 4).
Figure 4.
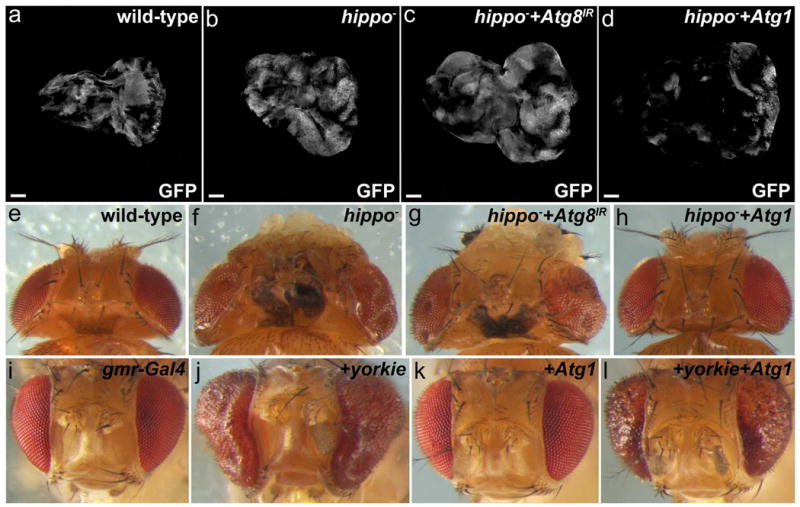
While endogenous autophagy has no effect on hippo- induced tissue overgrowth, induction of autophagy suppresses it. (a-d) Prepupal eye imaginal discs stained with DAPI to outline disc size and morphology. GFP depicts control and hippo clones induced by MARCM. Posterior is to the right. (a) Wild-type (control) MARCM mosaic. (b) hippo mutant clones and overall eye discs are overgrown. (c) Expression of Atg8 RNAi in hippo- clones does not significantly affect clone size. (d) Expression of Atg1 in hippo- clones strongly reduces clone size. (e) Top view of wild-type MARCM adult mosaic showing eyes and head capsule. (f) Eyes and head capsule are overgrown in hippo- mosaic adults. (g) Expression of Atg8 RNAi in hippo mutant clones does not suppress overgrowth of eyes and head capsule in hippo- mosaic adults (compare to f). (h) Expression of Atg1 in hippo- clones suppresses overgrowth of eyes and head capsule of hippo mosaics (compare to f). (i-l) Shown are adult eyes which express the indicated transgenes using gmr-Gal4. Crosses were kept at room temperature (22°C). (i) Wild-type. (j) Expression of yorkie induces overgrowth of eyes (compare to i). (k) Expression of Atg1. (l) Expression of Atg1 suppresses yorkie induced overgrowth of eyes (compare to j). Scale bars, 100 μm. Genotypes: (a,e) yw ey-FLP/+; FRT42D tub-Gal80/FRT42D yw+; tub-Gal4 UAS-CD8-GFP/+. (b,f) yw ey-FLP/+; FRT42D tub-Gal80/FRT42D hippo3D; tub-Gal4 UAS-CD8-GFP/+. (c,g) yw ey-FLP/+; FRT42D tub-Gal80/FRT42D hippo3D; tub-Gal4 UAS-CD8-GFP/UAS-Atg8IR. (d,h) yw ey-FLP/+; FRT42D tub-Gal80/FRT42D hippo3D; tub-Gal4 UAS-CD8-GFP/UAS-Atg1GS10797. (i) gmr-Gal4/+. (j) gmr-Gal4/+; UAS-yorkie/+. (k) gmr-Gal4/+; UAS-Atg1GS10797/+. (l) gmr-Gal4/+; UAS-yorkie/ UAS-Atg1GS10797.
Our data indicate that modulation of autophagy has distinct impacts on eye epithelial growth depending on the genetic alteration that drives overgrowth. Since modulation of autophagy in hippo mutant cells had a modest influence on eye tissue growth, we tested if altered autophagy has an impact on growth of a different cell type, glia cells, undergoing Yorkie-induced overgrowth (27). In addition, we examined the role of autophagy in Yorkie-induced glia overgrowth in a different tissue, the leg imaginal discs. Expression of Yorkie in glia cells of the leg imaginal discs strongly increases the number of glia cells using Repo antibody as glia cell marker (Figure 5b,b'). Ectopic induction of Atg1 slightly increases the number of repo-positive glia cells in leg discs (Figure 5c,c'). Surprisingly, however, expression of Atg1 dramatically enhances Yorkie-induced glia overgrowth in larval leg discs (Figure 5d,d'). A similar, although somewhat weaker effect of Atg1-induced autophagy was observed in Yorkie-induced glia overgrowth in eye imaginal discs (Supplementary Figure 5). These observations are surprising as ectopic Atg1 expression acts as a strong suppressor of overgrowth in epithelial tissue (Figure 3b, 4d), including hippo-induced overgrowth. Thus, while ectopic autophagy suppresses hippo-induced overgrowth in epithelial tissue, it enhances growth in a population of glia cells.
Figure 5.
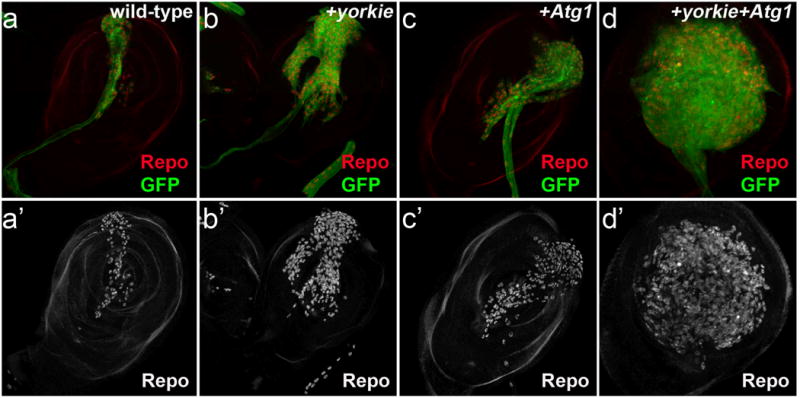
Induction of autophagy enhances yorkie-induced overgrowth in glia cells. Shown are 3rd instar larval leg imaginal discs which express the indicated transgenes using repo-Gal4. Anti-Repo antibody (red) and GFP (green) labels glia cells in (a-d), anti-repo labelings alone in (a′-d′) is in grey. (a,a′) Wild-type. (b,b′) Expression of yorkie increases the number of glia (b,b′) compared to control (a,a′). (c,c′) Expression of Atg1 slightly increases the number of glia (c,c′) compared to control (a,a′). (d,d′) Simultaneous expression of yorkie and Atg1 dramatically increases the number of glia (d,d′) compared to yorkie (b,b′) or Atg1 (c,c′) expression alone. Genotypes: (a) UAS-dicer2/+; repo-Gal4, UAS-MCD8::GFP/+. (b) UAS-dicer2/+; repo-Gal4, UAS-MCD8::GFP/UAS-yorkie. (c) UAS-dicer2/+; repo-Gal4, UAS-MCD8::GFP/UAS-atg1GS10797. (d) UAS-dicer2/Sco or CyO; repo-Gal4, UAS-MCD8::GFP/UAS-yorkie, UAS-Atg1GS10797.
Discussion
Substantial evidence indicates that autophagy can play distinct roles in different cellular contexts. In cancer, autophagy has been implicated in both tumor suppression and tumor progression (5). Studies in mice indicate that autophagy restricts tumor initiation by restricting genome damage (3, 4). By contrast, autophagy appears to promote tumor progression once tumors are established by enabling cancer cell survival (23, 28). However, no previous study has systematically analyzed the influence of autophagy when either distinct oncogenic stimuli are activated within a single epithelial tissue, or if an identical oncogenic stimulus is activated in different cellular contexts.
Here we investigate the influence of autophagy in distinct epithelial cell contexts in Drosophila. We find that, like in mammals, autophagy promotes overgrowth in the context of a Ras-driven eye epithelial model. By contrast, autophagy suppresses overgrowth in the same epithelial tissue in a model with altered JNK function. Strikingly, autophagy also suppresses severe overgrowth observed in the eyes of a model involving Notch activation. Finally, we show that autophagy fails to suppress overgrowth in the eye epithelium when Hippo function is reduced, and that activation of autophagy enhances overgrowth in glia. Therefore, our results indicate a wide variety of potential influences of autophagy on cell and tissue growth, and that these may depend on both oncogenic signal and cell type.
Autophagy is a catabolic process that is activated to alleviate cell stress, and also maintains bioenergetic homeostasis under nutrient restriction. In both of these scenarios, autophagy promotes cell survival. Therefore, it is possible that the different influences of autophagy on tissue growth are related to these different survival-associated functions and the influence of either different growth or oncogenic signals on the pathways influenced by autophagy. For example, metabolism is known to be altered in many cancers (29), and since autophagy is a catabolic process this may explain one type of cellular outcome. Alternatively, stress activates autophagy, and altered metabolism combined with a different ability to cope with stress because of altered signaling could result in a different cell and tissue outcome. Autophagy has also been implicated in cell death, and how autophagy promotes cell death also appears context dependent (30). Therefore, many possibilities exist for how autophagy may contribute to epithelial growth.
Multiple oncogenic and growth regulatory signals have been shown to influence autophagy, and autophagy influences growth pathways. For example, mTOR directly represses autophagy by phosphorylation of Atg13, and factors upstream of mTOR, including p110, PTEN and Akt, have been shown to influence autophagy (31). In addition, autophagy influences mTOR activity under nutrient restriction by the association of this kinase with autolysosomes that control nutrient availability and the activity of mTOR (32, 33). In addition, both the Ras and Hippo pathways influence autophagy (25, 34). Interestingly, activated Ras often represses autophagy, but in at least some tumor cell lines with activated Ras autophagy is activated (35). These studies further emphasize the important relationship between nutrient sensing, growth regulatory and autophagy pathways.
The modulation of autophagy is considered to be a promising therapeutic strategy for treating cancer. Our studies highlight the importance of considering tumor genotype when autophagy is targeted for therapies. Therefore, much work is needed to better understand the potential impact of altered autophagy in different cancers. At this stage, it is unclear which tumor characteristics are best to consider when manipulating autophagy for therapeutic purposes. Our data indicating that decreased autophagy suppresses Ras-triggered overgrowth is consistent with work in mammals, but recent studies indicate that p53 status is important to consider when treating Ras-driven tumors (6, 7). Future studies should enable us to classify tumors such that modulation of autophagy is a rationale therapeutic strategy.
Materials and Methods
Fly stocks, over-expression and clonal analysis, and quantification of overgrowth
All crosses were kept at 25°C, except where indicated. Either Canton-S or w1118 was used as control. For induction of tissue overgrowth eyeful/Cyo (eyeless-Gal4>UAS-delta, GS88A8 UAS-lola, UAS-pipsqueak)(17), eyeless-Gal4, gmr-Gal4, UAS-yorkie (36), UAS- RasV12, UAS-dicer2; repo-Gal4 UAS-MCD::GFP/TM6B (27), yw hs-FLP; sp/Cyo; FRT82B scrib2/TM3, w; UAS-p35; FRT82B scrib2/TM6B, UAS-bskDN; sp/Cyo; FRT82B scrib2/TM6B, yw; UAS-RasV12FRT82B scrib2/TM6B (37), w; FRT42D hippo3D/Cyo were used. For down-regulation or induction of autophagy we used lines from Vienna Drosophila RNAi Center (VDRC) and Bloomington (BL) Stock Center unless noted: Atg1IR VDRC Transformant ID (TID) 16133, Atg6IR TID 11647, Atg12IR BL34675, Atg5IR BL27551, Atg4bIR TID 11855, Atg4aIR TID 11315, Atg8aIR TID 43097, Atg8bIR TID 17079, Atg3IR TID 108666, Atg9IR TID 2029, Atg7IR TID 45561, Atg18IR TID 22646, Atg1K38Q, Atg16B, and Atg1GS10797 (24, 25). To induce cell clones yw ey-FLP1; Act>y+>Gal4 UAS-GFPS65T; FRT82B tubGal80 and yw ey-FLP; FRT42D tubulin-Gal80; tub-Gal4 UAS-CD8-GFP/T(2;3)SM5-TM6B were used. For mCherry-Atg8 analysis, we used UAS-mCherry-Atg8 (38).
The UAS-Gal4 system was used to mis-express genes of interest or express RNAi against target genes (39). MARCM (mosaic analysis with a repressible cell marker) was used to express genes of interest or express RNAi against target genes in mutant clones (40).
For larval staging egg-laying was allowed for 24 hours, and larvae were aged at 25 °C. Wandering 3rd instar wild-type larvae were collected and dissected on day 5. On day 12 wandering 3rd instar larvae with either UAS-RasV12 scrib2 or UAS-Atg1IR UAS-RasV12 scrib2 MARCM clones were collected and dissected.
GraphPad Prism 6 software was used to quantify animals with overgrown eyes, secondary growths, or eye projections. Adult eye or head capsule images were taken with a Zeiss SteReo Discovery.V20 stereo microscope and processed with Zen 2012 blue edition imaging software.
Immunostaining and Microscopy
Eye-antennal or leg imaginal discs from wandering 3rd instar larvae or white prepupa were dissected and stained with the following antibodies: rabbit anti-cleaved caspase-3 (1:200, Cell Signaling Technology, 9661), rabbit anti-Ref(2)P (1:2000, G. Juhasz) (41), rabbit anti-PH3 (1:1000, Upstate), rat anti-ELAV (1:40, Developmental Studies Hybridoma Bank, 7E8A10) and mouse anti-repo (1:20, Developmental Studies Hybridoma Bank, 8D12). FITC, Cy-3 and Cy-5 fluorescently-conjugated secondary antibodies were from Jackson ImmunoResearch. Vectashield mounting medium with DAPI was from Vector Laboratories. Images were obtained with a Zeiss LSM 700 confocal microscope with Zen 2012 imaging software and processed with Adobe Photoshop CS5.1.
Quantification and Statistical Analysis
PH3-positive cells were counted posterior to the morphogenetic furrow. Ten representative eye discs were counted for each genotype. GraphPad Prism 6 software was used to determine the average number of mitotic cells per eye disc, and a P value was obtained using a two-tailed t-test. All quantitative data are shown as mean ± s.d.
Supplementary Material
Acknowledgments
We thank T. Chang, M. Dominguez, M. Freeman, G. Halder, G. Juhasz, M. Kango-Singh, T.P. Neufeld, the Bloomington Stock Center, the VDRC for flies and antibodies, J. Lindblad, C. Nelson, and T. Fortier for technical support, and the Bergmann and Baehrecke labs for constructive comments. This work was supported by NIH grants GM068016 to AB and CA159314 to EHB. EHB is an Ellison Medical Foundation Scholar.
Footnotes
Conflict of Interest: The authors declare no conflict of interest.
References
- 1.Kondo Y, Kanzawa T, Sawaya R, Kondo S. The role of autophagy in cancer development and response to therapy. Nat Rev Cancer. 2005;5:726–34. doi: 10.1038/nrc1692. [DOI] [PubMed] [Google Scholar]
- 2.Mizushima N, Komatsu M. Autophagy: Renovation of Cells and Tissues. Cell. 2011;147:728–41. doi: 10.1016/j.cell.2011.10.026. [DOI] [PubMed] [Google Scholar]
- 3.Mathew R, Kongara S, Beaudoin B, Karp CM, Bray K, Degenhardt K, et al. Autophagy suppresses tumor progression by limiting chromosomal instability. Genes Dev. 2007;21:1367–81. doi: 10.1101/gad.1545107. [DOI] [PMC free article] [PubMed] [Google Scholar]
- 4.Karantza-Wadsworth V, Patel S, Kravchuk O, Chen G, Mathew R, Jin S, et al. Autophagy mitigates metabolic stress and genome damage in mammary tumorigenesis. Genes Dev. 2007;21:1621–35. doi: 10.1101/gad.1565707. [DOI] [PMC free article] [PubMed] [Google Scholar]
- 5.Mathew R, Karantza-Wadsworth V, White E. Role of autophagy in cancer. Nat Rev Cancer. 2007;7:961–7. doi: 10.1038/nrc2254. [DOI] [PMC free article] [PubMed] [Google Scholar]
- 6.Rosenfeldt MT, O'Prey J, Morton JP, Nixon C, MacKay G, Mrowinska A, et al. p53 status determines the role of autophagy in pancreatic tumour development. Nature. 2013;504:296–300. doi: 10.1038/nature12865. [DOI] [PubMed] [Google Scholar]
- 7.Rao S, Tortola L, Perlot T, Wirnsberger G, Novatchkova M, Nitsch R, et al. A dual role for autophagy in a murine model of lung cancer. Nat Commun. 2014;5:3056. doi: 10.1038/ncomms4056. [DOI] [PubMed] [Google Scholar]
- 8.Funderburk SF, Wang QJ, Yue Z. The Beclin 1-VPS34 complex--at the crossroads of autophagy and beyond. Trends Cell Biol. 2010;20:355–62. doi: 10.1016/j.tcb.2010.03.002. [DOI] [PMC free article] [PubMed] [Google Scholar]
- 9.Shravage BV, Hill JH, Powers CM, Wu L, Baehrecke EH. Atg6 is required for multiple vesicle trafficking pathways and hematopoiesis in Drosophila. Development. 2013;140:1321–9. doi: 10.1242/dev.089490. [DOI] [PMC free article] [PubMed] [Google Scholar]
- 10.Tipping M, Perrimon N. Drosophila as a model for context-dependent tumorigenesis. J Cell Physiol. 2014;229:27–33. doi: 10.1002/jcp.24427. [DOI] [PMC free article] [PubMed] [Google Scholar]
- 11.Rudrapatna VA, Cagan RL, Das TK. Drosophila cancer models. Dev Dyn. 2012;241:107–18. doi: 10.1002/dvdy.22771. [DOI] [PMC free article] [PubMed] [Google Scholar]
- 12.Bos JL. ras oncogenes in human cancer: a review. Cancer Res. 1989;49:4682–9. [PubMed] [Google Scholar]
- 13.Karim FD, Rubin GM. Ectopic expression of activated Ras1 induces hyperplastic growth and increased cell death in Drosophila imaginal tissues. Development. 1998;125:1–9. doi: 10.1242/dev.125.1.1. [DOI] [PubMed] [Google Scholar]
- 14.Bergmann A, Agapite J, McCall K, Steller H. The Drosophila gene hid is a direct molecular target of Ras-dependent survival signaling. Cell. 1998;95:331–41. doi: 10.1016/s0092-8674(00)81765-1. [DOI] [PubMed] [Google Scholar]
- 15.Kurada P, White K. Ras promotes cell survival in Drosophila by downregulating hid expression. Cell. 1998;95:319–29. doi: 10.1016/s0092-8674(00)81764-x. [DOI] [PubMed] [Google Scholar]
- 16.Lobry C, Oh P, Aifantis I. Oncogenic and tumor suppressor functions of Notch in cancer: it's NOTCH what you think. J Exp Med. 2011;208:1931–5. doi: 10.1084/jem.20111855. [DOI] [PMC free article] [PubMed] [Google Scholar]
- 17.Ferres-Marco D, Gutierrez-Garcia I, Vallejo DM, Bolivar J, Gutierrez-Aviño FJ, Dominguez M. Epigenetic silencers and Notch collaborate to promote malignant tumours by Rb silencing. Nature. 2006;439:430–6. doi: 10.1038/nature04376. [DOI] [PubMed] [Google Scholar]
- 18.Johnson R, Halder G. The two faces of Hippo: targeting the Hippo pathway for regenerative medicine and cancer treatment. Nat Rev Drug Discov. 2014;13:63–79. doi: 10.1038/nrd4161. [DOI] [PMC free article] [PubMed] [Google Scholar]
- 19.Elsum I, Yates L, Humbert PO, Richardson HE. The Scribble-Dlg-Lgl polarity module in development and cancer: from flies to man. Essays Biochem. 2012;53:141–68. doi: 10.1042/bse0530141. [DOI] [PubMed] [Google Scholar]
- 20.Pagliarini RA, Xu T. A genetic screen in Drosophila for metastatic behavior. Science. 2003;302:1227–31. doi: 10.1126/science.1088474. [DOI] [PubMed] [Google Scholar]
- 21.Igaki T, Pagliarini RA, Xu T. Loss of cell polarity drives tumor growth and invasion through JNK activation in Drosophila. Curr Biol. 2006;16:1139–46. doi: 10.1016/j.cub.2006.04.042. [DOI] [PubMed] [Google Scholar]
- 22.Brumby AM, Richardson HE. scribble mutants cooperate with oncogenic Ras or Notch to cause neoplastic overgrowth in Drosophila. EMBO J. 2003;22:5769–79. doi: 10.1093/emboj/cdg548. [DOI] [PMC free article] [PubMed] [Google Scholar]
- 23.Guo JY, Karsli-Uzunbas G, Mathew R, Aisner SC, Kamphorst JJ, Strohecker AM, et al. Autophagy suppresses progression of K-ras-induced lung tumors to oncocytomas and maintains lipid homeostasis. Genes Dev. 2013;27:1447–61. doi: 10.1101/gad.219642.113. [DOI] [PMC free article] [PubMed] [Google Scholar]
- 24.Scott RC, Juhász G, Neufeld TP. Direct induction of autophagy by Atg1 inhibits cell growth and induces apoptotic cell death. Curr Biol. 2007;17:1–11. doi: 10.1016/j.cub.2006.10.053. [DOI] [PMC free article] [PubMed] [Google Scholar]
- 25.Berry DL, Baehrecke EH. Growth arrest and autophagy are required for salivary gland cell degradation in Drosophila. Cell. 2007;131:1137–48. doi: 10.1016/j.cell.2007.10.048. [DOI] [PMC free article] [PubMed] [Google Scholar]
- 26.Chang TK, Shravage BV, Hayes SD, Powers CM, Simin RT, Harper JW, et al. Uba1 functions in Atg7- and Atg3-independent autophagy. Nat Cell Biol. 2013;15:1067–78. doi: 10.1038/ncb2804. [DOI] [PMC free article] [PubMed] [Google Scholar]
- 27.Reddy BV, Irvine KD. Regulation of Drosophila glial cell proliferation by Merlin-Hippo signaling. Development. 2011;138:5201–12. doi: 10.1242/dev.069385. [DOI] [PMC free article] [PubMed] [Google Scholar]
- 28.Takamura A, Komatsu M, Hara T, Sakamoto A, Kishi C, Waguri S, et al. Autophagy-deficient mice develop multiple liver tumors. Genes Dev. 2011;25:795–800. doi: 10.1101/gad.2016211. [DOI] [PMC free article] [PubMed] [Google Scholar]
- 29.Vander Heiden MG, Cantley LC, Thompson CB. Understanding the Warburg effect: the metabolic requirements of cell proliferation. Science. 2009;324:1029–33. doi: 10.1126/science.1160809. [DOI] [PMC free article] [PubMed] [Google Scholar]
- 30.McPhee CK, Baehrecke EH. Autophagy in Drosophila melanogaster. Biochim Biophys Acta. 2009;1793:1452–60. doi: 10.1016/j.bbamcr.2009.02.009. [DOI] [PMC free article] [PubMed] [Google Scholar]
- 31.Scott RC, Schuldiner O, Neufeld TP. Role and regulation of starvation-induced autophagy in the Drosophila fat body. Dev Cell. 2004;7:167–78. doi: 10.1016/j.devcel.2004.07.009. [DOI] [PubMed] [Google Scholar]
- 32.Yu L, McPhee CK, Zheng L, Mardones GA, Rong Y, Peng J, et al. Autophagy termination and lysosome reformation regulated by mTOR. Nature. 2010;465:942–6. doi: 10.1038/nature09076. [DOI] [PMC free article] [PubMed] [Google Scholar]
- 33.Sancak Y, Bar-Peled L, Zoncu R, Markhard AL, Nada S, Sabatini DM. Ragulator-Rag complex targets mTORC1 to the lysosomal surface and is necessary for its activation by amino acids. Cell. 2010;141:290–303. doi: 10.1016/j.cell.2010.02.024. [DOI] [PMC free article] [PubMed] [Google Scholar]
- 34.Dutta S, Baehrecke EH. Warts is required for PI3K-regulated growth arrest, autophagy, and autophagic cell death in Drosophila. Curr Biol. 2008;18:1466–75. doi: 10.1016/j.cub.2008.08.052. [DOI] [PMC free article] [PubMed] [Google Scholar]
- 35.Guo JY, Chen HY, Mathew R, Fan J, Strohecker AM, Karsli-Uzunbas G, et al. Activated Ras requires autophagy to maintain oxidative metabolism and tumorigenesis. Genes Dev. 2011;25:460–70. doi: 10.1101/gad.2016311. [DOI] [PMC free article] [PubMed] [Google Scholar]
- 36.Huang J, Wu S, Barrera J, Matthews K, Pan D. The Hippo signaling pathway coordinately regulates cell proliferation and apoptosis by inactivating Yorkie, the Drosophila Homolog of YAP. Cell. 2005;122:421–34. doi: 10.1016/j.cell.2005.06.007. [DOI] [PubMed] [Google Scholar]
- 37.Chen CL, Schroeder MC, Kango-Singh M, Tao C, Halder G. Tumor suppression by cell competition through regulation of the Hippo pathway. Proc Natl Acad Sci U S A. 2012;109:484–9. doi: 10.1073/pnas.1113882109. [DOI] [PMC free article] [PubMed] [Google Scholar]
- 38.Chang YY, Neufeld TP. An Atg1/Atg13 complex with multiple roles in TOR-mediated autophagy regulation. Mol Biol Cell. 2009;20:2004–14. doi: 10.1091/mbc.E08-12-1250. [DOI] [PMC free article] [PubMed] [Google Scholar]
- 39.Brand AH, Perrimon N. Targeted gene expression as a means of altering cell fates and generating dominant phenotypes. Development. 1993;118:401–15. doi: 10.1242/dev.118.2.401. [DOI] [PubMed] [Google Scholar]
- 40.Lee T, Luo L. Mosaic analysis with a repressible cell marker (MARCM) for Drosophila neural development. Trends Neurosci. 2001;24:251–4. doi: 10.1016/s0166-2236(00)01791-4. [DOI] [PubMed] [Google Scholar]
- 41.Pircs K, Nagy P, Varga A, Venkei Z, Erdi B, Hegedus K, et al. Advantages and Limitations of Different p62-Based Assays for Estimating Autophagic Activity in Drosophila. PLoS ONE. 2012;7:e44214. doi: 10.1371/journal.pone.0044214. [DOI] [PMC free article] [PubMed] [Google Scholar]
Associated Data
This section collects any data citations, data availability statements, or supplementary materials included in this article.