

Abstract
Water discharging from abandoned coal mines can contain extremely high manganese levels. Removing this metal is an ongoing challenge. Passive Mn(II) removal beds (MRBs) contain microorganisms that oxidize soluble Mn(II) to insoluble Mn(III/IV) minerals, but system performance is unpredictable. Using amplicon pyrosequencing, we profiled the bacterial, fungal, algal, and archaeal communities in four MRBs, performing at different levels, in Pennsylvania to determine whether they differed among MRBs and from surrounding soil and to establish the relative abundance of known Mn(II) oxidizers. Archaea were not detected; PCRs with archaeal primers returned only nontarget bacterial sequences. Fungal taxonomic profiles differed starkly between sites that remove the majority of influent Mn and those that do not, with the former being dominated by Ascomycota (mostly Dothideomycetes) and the latter by Basidiomycota (almost entirely Agaricomycetes). Taxonomic profiles for the other groups did not differ significantly between MRBs, but operational taxonomic unit-based analyses showed significant clustering by MRB with all three groups (P < 0.05). Soil samples clustered separately from MRBs in all groups except fungi, whose soil samples clustered loosely with their respective MRB. Known Mn(II) oxidizers accounted for a minor proportion of bacterial sequences (up to 0.20%) but a greater proportion of fungal sequences (up to 14.78%). MRB communities are more diverse than previously thought, and more organisms may be capable of Mn(II) oxidation than are currently known.
INTRODUCTION
Coal mine drainage (CMD) from operating and abandoned mines often contains elevated concentrations of dissolved manganese (Mn). Removing this metal from contaminated water is a significant challenge in mining regions across the world, including the Appalachian Coal Basin in the eastern United States, where centuries of coal mining have left thousands of abandoned mines with effluent dissolved Mn concentrations as high as 150 mg liter−1 (1, 2). At such levels, Mn can damage ecosystems and water distribution systems. One of the most common remediation methods in this region involves biologically active limestone treatment beds (3). These beds raise the pH of the CMD and promote the oxidation of soluble Mn(II) to sparingly soluble Mn(III/IV) minerals (4), which are retained in the beds and can be removed periodically. Unfortunately, the performance of these Mn(II) removal beds (MRBs) is highly variable due to insufficient knowledge of the processes (biotic and abiotic) involved (2, 5). A better understanding of the primary mechanisms contributing to Mn(II) oxidation will aid technological advances and removal efficiencies.
Recent studies have demonstrated that although abiotic Mn(II) oxidation is thermodynamically inhibited below pH 9 when oxygen is the oxidant (6), Mn oxide surfaces (7) and reactive oxygen species (8, 9) catalyze oxidation of Mn(II) at near-neutral pH. Mineral surface-catalyzed Mn(II) oxidation was shown to occur in simulated CMD treatment bioreactors, although microbial activity dominated the oxidation of Mn(II) to Mn(III/IV) oxides under certain treatment conditions (2). A diversity of bacteria (10–15) and fungi (12, 15–18), isolated from a range of aquatic and terrestrial environments, are known to oxidize Mn(II) when grown in pure culture, although not as an energy-conserving process but rather as a side reaction of unknown physiological basis. The remediation of Mn-contaminated waters is thought to rely largely on such organisms. Indeed, culture-based studies of Mn(II) removal systems in Wales, United Kingdom (19), and across Pennsylvania (5, 20) have identified numerous resident bacteria and fungi that oxidize Mn(II), although the abundance and activity of these isolates relative to the total microbial communities in the treatment systems is unknown. Since Mn(II) oxidation is not an energy conservation process (i.e., respiration) in any known Mn(II)-oxidizing microorganism (21, 22), it is possible that it does not correlate positively with abundance. For example, superoxide-mediated Mn(II) oxidation would be negatively correlated with abundance if an organism used superoxide as a signal at low cell densities but not at higher densities.
While culture-based studies are essential for elucidating the mechanisms promoting biological Mn(II) oxidation (22–28), these isolated organisms exist in complex communities whose interactions could be modulating their Mn(II) oxidation activity in the environment. Other community members, notably phototrophs and diazotrophs, could be providing essential carbon and nitrogen compounds. Conversely, heterotrophs could be competing for limited resources. Finally, other unidentified community members could be oxidizing Mn(II) but have resisted laboratory cultivation. A culture-independent, community-level approach that encompasses groups known to contribute to biological Mn(II) oxidation (bacteria and fungi), as well as other potentially relevant community members (algae and archaea), has, to our knowledge, not been performed on these treatment systems but would greatly improve our understanding of key organisms and community interactions promoting Mn(II) oxidation in situ.
Using an amplicon pyrosequencing approach, we characterized four microbial target groups (bacteria, archaea, fungi, and algae) existing in four MRBs, performing at different levels, in Pennsylvania that have been described previously (2, 5, 20) and from which Mn(II)-oxidizing bacteria and fungi were isolated (20): De Sale 1 and 2 (DS1 and DS2), PBS, and Saxman Run bed C1 (SRC1), also known as Derry Ridge (2). At the time of sampling, PBS and SRC1 were removing nearly 100% of influent Mn(II), DS2 was removing 50%, and DS1 was not removing any influent Mn(II). We aimed to determine (i) whether similar microbial communities are found in different MRBs or whether each MRB develops a distinct community, (ii) whether differences in community structure are apparent within MRBs, from the influent [where dissolved Mn(II) concentrations are highest] to the effluent (where they are lowest), and (iii) whether communities in MRBs are distinct from those in the surrounding uncontaminated soil. These results ultimately will contribute to improving Mn(II) remediation technologies by increasing our understanding of MRB community diversity and highlighting key taxa present in MRBs with near-complete Mn(II) removal.
MATERIALS AND METHODS
Sample collection.
Four limestone-filled, geotextile-lined Mn(II) removal beds (MRBs) in western Pennsylvania were sampled in November 2010: PBS, Saxman Run bed C1 (SRC1), and De Sale phases 1 and 2 (DS1 and DS2). These systems, described in earlier studies (2, 5, 20), treat coal mine drainage with considerable dissolved manganese concentrations by promoting microbiologically catalyzed oxidation of aqueous Mn(II) compounds to sparingly soluble Mn(III/IV) oxide minerals that are retained within the beds. DS1, PBS, and SRC1 receive influent Mn(II) concentrations averaging 18 to 20 mg liter−1, whereas DS2 has a higher mean influent Mn(II) concentration, 31.2 mg liter−1 (see Table S1 in the supplemental material) (2). PBS and SRC1 are highly effective in attenuating Mn, with over 90% removal, resulting in mean effluent concentrations of 0.29 and 1.3 mg liter−1, respectively. DS2 is attenuating approximately 50% of dissolved Mn (mean effluent concentration of 17.1 mg liter−1), and DS1 showed minimal Mn attenuation in the year preceding sampling (see Table S1) (2). DS1 and DS2 are in close proximity to each other (roughly 250 m) but are treating different influents. SRC1 and PBS are roughly 100 km and 150 km from the DS sites, respectively, and are separated by 50 km.
MnOx-rich samples (limestone pebbles, sediment, and organic debris) were collected near the influent, in the middle of the bed, and near the effluent, although not every location was accessible in each MRB. There is no influent sample for DS2 and no effluent sample for PBS, but DS1 and DS2 each have two middle samples. In DS1 and DS2, the Mn oxides occurred as loose soil-like sediments that were collected with sterile spatulas. In PBS and SRC1, Mn oxides formed varnish-like coatings on the limestone cobbles, so entire cobbles were collected. In addition, a control soil sample was taken outside each MRB. Samples were immediately flash-frozen in a dry ice-ethanol bath in the field and stored on dry ice during transportation to the laboratory, where they were kept at −80°C until processing.
DNA extraction, amplification, and pyrosequencing.
Mn oxide sediments and fragments of Mn-coated limestone were crushed with a sterile pestle and mortar. For DS1 and DS2 samples, a single 0.5-g aliquot of crushed sediment yielded sufficient DNA for amplification and sequencing. However, samples from PBS and SRC1 were more resistant to extraction. Four 0.25-g aliquots of each sample were extracted separately and subsequently pooled and concentrated with ethanol precipitation, using glycogen as a carrier. With these samples, smaller amounts of starting material (half that recommended by the kit manufacturer) gave the best yields, suggesting the difficulties were due to inhibition by metal cations rather than to low biomass. DNA was extracted with the FastDNA Spin kit for soil (MP Biomedicals), with the following modifications. Poly(A) (200 μg per sample) was added to the lysis buffer to reduce inhibition by metal cations. Two homogenization steps on the FastPrep instrument (MP Biomedicals) were carried out with a 5-min incubation on ice in between. The initial centrifugation step to remove sediments and cell debris was extended to 15 min, and the binding matrix incubation was extended to 10 min. Elution was carried out by resuspending the binding matrix in 100 μl nuclease-free sterile water and incubating at 55°C. Extracts were quantified using the Qubit double-stranded DNA HS assay kit (Life Technologies) with a Qubit 1.0 fluorometer, and those exceeding 15 ng μl−1 were diluted to that concentration. Each extract then was divided into four aliquots, one for each of the four target amplifications.
Tag-encoded FLX amplicon pyrosequencing (TEFAP) was carried out directly from aliquots of total community DNA at the Research and Testing Laboratory (Lubbock, TX) as previously described (29). Four target groups were amplified and sequenced from each of the 16 samples: (i) bacterial 16S rRNA with primers 28F (modified from reference 30) and 519R (modified from reference 31), (ii) archaeal 16S rRNA with primers 349F and 806R (32), (iii) fungal ITS1-5.8S-ITS2 with primers ITS1F and ITS4 (33, 34), and (iv) algal plastid 23S rRNA with primers AlgaeF and AlgaeR (35) (see Table S2 in the supplemental material). Although the algae are polyphyletic and are not a true phylogenetic group, these plastid 23S rRNA primers amplify cyanobacteria and six eukaryotic algal lineages: Chlorophyta (green algae), Rhodophyta (red algae), Bacillariophyta (diatoms), Phaeophyceae (brown algae), Xanthophyceae (yellow-green algae), and Euglenida (euglenids) (35).
Processing of raw pyrosequencing reads.
Raw pyrosequencing reads were processed as described in reference 36, using mothur 1.31.1 (37) and following the recommendations of reference 38. Algal plastid flow files were trimmed to a minimum and maximum length of 350, whereas other target flow files were trimmed to 400.
Bacterial and archaeal sequences were aligned to the Silva bacterial and archaeal small-subunit rRNA reference alignments (39) available in mothur. Algal sequences were aligned to the Silva LSURef 111 database, with metazoa sequences removed (which greatly improved the alignment performance). Only the sequences spanning the targeted regions were kept, and all sequences were trimmed to the same length. For bacteria and archaea, this was determined by optimizing alignment end and minimum length so as to keep 90% of sequences. For algae, the start and end positions were manually set based on the alignment statistics. Data were further denoised by clustering together sequences with a 1-bp mismatch per 100 bp, and chimeras were removed using the mothur implementation of uchime (40), with the more abundant sequences as a reference. Bacterial sequences were further cleaned up by classifying against the Silva reference database using the Wang et al. method (41) with a k-mer size of 8, 100 bootstrap iterations, and a threshold of 60% for taxonomic assignment. Following this step, sequences identified as mitochondria, chloroplasts, Archaea, or Eukarya were removed. For fungal sequences, following the primer, barcode, and homopolymer removal outlined in the previous paragraph, the ITS1 region was extracted using ITSx (42) on the PlutoF Workbench (43), and sequences shorter than 100 bp following this step were discarded. Chimeras were removed as described above.
Diversity analyses and taxonomic assignment.
Within each target, the number of sequences per sample was normalized to the size of the sample with the lowest number of sequences. For bacteria, archaea, and algae, operational taxonomic unit (OTU) clustering was carried out in mothur using the multiple-sequence alignments generated during sequence processing. However, since multiple-sequence alignments of fungal internal transcribed spacer (ITS) are problematic for all but the most closely related species, OTU clustering of fungal sequences was carried out based on pairwise distance values calculated in mothur, with consecutive gaps treated as one and ignoring gaps at the ends of pairs.
mothur was used to generate OTU-by-sample tables at all OTU clustering levels between 0.00 and 0.25 and to calculate the Simpson evenness index (44). R (45) was used for plotting and subsequent analyses. The vegan package (46) was used to calculate Bray-Curtis distances from relative abundance matrices and Jaccard distances from presence/absence matrices (47), followed by nonmetric multidimensional scaling. Community variation was partitioned between the two factors in this study (MRB and location within bed) and their interaction using permutational analysis of variance based on distance matrices (48), which is implemented by the adonis function in the vegan package, with 999 permutations. Bray-Curtis and Jaccard distances subsequently were used in pairwise comparisons of the four target groups (bacteria, archaea, fungi, and algae) to look for evidence of biotic coupling, which would be suggested by positive correlations in distance values. The significance of pairwise correlations was assessed using the Mantel test with 999 permutations.
Bacterial and archaeal sequences were classified against the Silva reference databases available in mothur, as described above, with a threshold of 60%. Algal sequences were classified against the Silva LSURef 111 database, with metazoan and fungal sequences removed and a threshold of 60%. For fungal ITS1 sequences, the UNITE+INSDC fungal ITS database (49), version 27.01.13 (downloaded February 2013 from http://unite.ut.ee/repository.php), was used as a reference for classification with the modifications described in reference 36. Differences in the relative abundances of taxonomic groups were assessed in R using t tests (soils versus MRBs) and analysis of variance (ANOVA) (four MRBs), with P values corrected for multiple comparisons.
Sequence read accession numbers.
All sequence data were deposited, with MIMARKS-compliant metadata, in the NCBI Sequence Read Archive under BioProject number PRJNA229802, BioSample numbers SAMN02404598 to SAMN02404613. The metadata also are available separately as a MIMARKS-formatted table (see Data Set S1 in the supplemental material).
RESULTS
In total, 228,444 sequences passed a highly stringent quality control (Table 1; also see Results in the supplemental material). After clustering into operational taxonomic units (OTUs), richness and evenness of bacteria, fungi, and algae were plotted (see Fig. S1 and S2), but no consistent patterns were observed (see Results in the supplemental material), suggesting that at a coarse level, microbial diversity is similar within and between MRBs and is comparable to that in the surrounding soil. Statistical comparisons of observed and estimated (Chao1) richness among the different MRBs (ANOVA) and between the MRBs and the soils (t test) are shown in Table S3.
TABLE 1.
Amplicon pyrosequencing output for the four target groups before and after sequence processing
| Target | No. of raw sequences | No. per sample | No. passing QC | % passing QC | Final subsampled no. per sample | Mean final sequence length (bp) |
|---|---|---|---|---|---|---|
| Algae | 221,986 | 1,986–44,231 | 79,491 | 35.8 | 518a | 209.5 |
| Archaea | 110,177 | 1,850–14,016 | 20,256 | 18.4 | 254 | 226.7 |
| Bacteria | 167,808 | 2,817–20,535 | 50,095 | 29.9 | 1,166 | 210.7 |
| Fungi | 372,851 | 6,833–123,772 | 78,602 | 21.1 | 1,885 | 163.9 |
| Total | 872,822 | 228,444 | 26.2 |
One algal sample, SRC1-soil, was removed from the data set due to the low number of sequences passing QC.
Archaea.
Of the four targets, the archaeal sequence data proved most problematic and resulted both in the smallest percentage passing quality control (QC) (18.4%) (Table 1) and in the smallest sample size (n = 254). When classified against the Silva archaeal reference database, 70.8% of sequences remained unclassified at the phylum level. Of the sequences that were placed in an archaeal phylum, fewer than 1% (46 sequences in total) were classified further. However, when classified against a combined bacterial/archaeal Silva database with a higher bootstrap threshold (80 instead of 60), all sequences were found to be bacterial (see Fig. S3 in the supplemental material). Most were placed in the phyla Chlamydiae, Planctomycetes, and Verrucomicrobia, with only 4.6% remaining unclassified at the phylum level. Given that the archaeal data set appears to consist entirely of nontarget bacterial amplicons, it was excluded from further analyses. Further work with different primer sets will be needed to determine whether Archaea truly are so scarce as to be undetectable or whether their absence from our data set was due to their signal being overwhelmed by nontarget amplification.
Influence of Mn(II) removal bed and location within beds.
Nonmetric multidimensional scaling (NMDS) was performed to cluster samples based on the similarity of their microbial communities. NMDS based on Bray-Curtis distance of OTU relative abundances showed that, with the three target groups (bacteria, fungi, and algae), samples clustered largely by MRB (Fig. 1) and not by their location within each bed (at the influent, where Mn concentrations would be highest, in the middle, or at the effluent, which would have the lowest Mn concentration). The soil samples from each site, however, formed a separate cluster rather than grouping with their corresponding treatment bed, except for fungi, whose soil samples did not form a separate group. Figure 1 shows clustering based on OTUs defined at the 0.03 level, but similar patterns were observed at all OTU clustering levels between 0.00 and 0.20 (data not shown). Furthermore, the same patterns were observed with NMDS based on Jaccard distance calculated from presence/absence matrices as opposed to relative abundance (data not shown).
FIG 1.
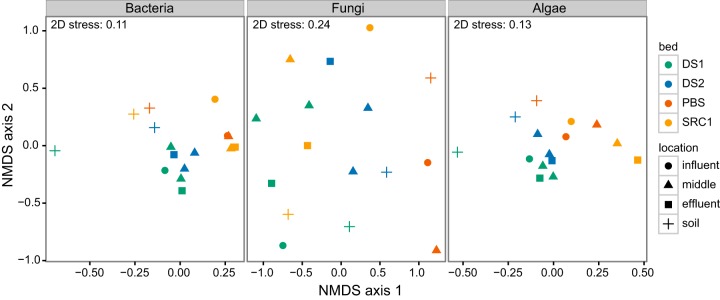
Nonmetric multidimensional scaling of Bray-Curtis distances from bacterial, fungal, and algal OTU relative abundance matrices. The threshold for OTU clustering was a sequence divergence of 0.03 (i.e., 97% similarity). n = 1,166, 1,885, and 518 sequences per sample for bacteria, fungi, and algae, respectively.
To test whether the clustering observed in NMDS plots indicated significant differences, we carried out permutational analysis of variance based on distances, which partitioned the sample variance among the two factors, MRB (DS1, DS2, PBS, and SRC1) and location within the bed (influent, middle, and effluent), as well as their interaction (see Table S4 in the supplemental material). The effect of the MRB was significant for bacteria, fungi, and algae based on Bray-Curtis distances calculated from relative abundance matrices, and it was significant for bacteria and algae based on Jaccard distances calculated from presence/absence matrices (P < 0.05) (see Table S4). The location within beds (influent, middle, or effluent) had a significant effect only on the bacterial communities with presence/absence data, and there was no significant interaction between these two factors in any of the three target groups. Similar results (data not shown) were obtained at the other OTU clustering levels (0.00 to 0.20).
Taxonomic profile.
Proteobacteria accounted for 46.9% of all bacterial sequences (36.9 to 57.9% per sample), more than all other phyla combined, not including the 11.0% of bacterial sequences that remained unclassified at the phylum level (Fig. 2). They were significantly more abundant in the MRBs than in the soil samples (mean proportion of 49.1% in beds versus 40.6% in soils; P = 0.031) (see Table S5 in the supplemental material). The predominant proteobacterial classes, orders, and families are shown in Fig. S4, S5, and S6, respectively. Most Proteobacteria belonged to the alpha and beta classes (see Fig. S4), and there were no significant differences in the relative abundance of the classes between the soil and beds or among the four beds. The Alphaproteobacteria were dominated by the order Rhizobiales in all samples except SRC1-influent (see Fig. S5), and within this one order, 14 families were detected (see Fig. S6), pointing to considerable diversity at increasingly fine resolution. Betaproteobacteria sequences were split mostly between the orders Burkholderiales and Nitrosomonadales (see Fig. S5), although the ratio of these two orders varied widely between and within MRBs (e.g., Betaproteobacteria in PBS were mostly Nitrosomonadales, whereas those in SRC1 were mostly Burkholderiales). In all soil samples and in the PBS MRB samples, all Nitrosomonadales sequences belonged to the family Nitrosomonadaceae (see Fig. S6); however, samples from inside the other MRBs also included various proportions (2 to 100%) of the family Gallionellaceae (iron-oxidizing chemolithotrophs).
FIG 2.

Taxonomic affiliation of bacterial, fungal, and algal sequences. Bacterial profiles (n = 1,166 sequences per sample) are shown at the phylum level. For clarity, only phyla accounting for at least 2% of sequences are shown, with the less abundant phyla grouped under “other bacteria.” For fungi (n = 1,885 sequences per sample), only classes accounting for at least 1% of sequences are shown, with remaining grouped under “other fungi.” For algae (n = 518 sequences per sample), phyla belonging to the Viridiplantae are shown in green, and phyla belonging to the Stramenopiles are shown in purple. Labels on the horizontal axis indicate the sample location within each Mn(II) removal bed (inf, influent; mid, middle; eff, effluent; soil, uncontaminated soil collected outside the bed), and for display, black lines separate the soil samples from the Mn(II) removal bed samples.
Of the other bacterial phyla detected, five accounted for 5 to 10% each of total bacterial sequences (Actinobacteria, Chloroflexi, Acidobacteria, Cyanobacteria, and Bacteroidetes), and three (Planctomycetes, Gemmatimonadetes, and Firmicutes) accounted for 1 to 5% each. The relative abundance of these eight phyla was similar in the four MRBs and in the soil samples, except for the Acidobacteria, which were significantly more abundant in the soil samples (mean relative abundance of 3.4% in beds versus 13.6% in soils; P < 0.01). An additional 15 phylum-level groups were detected with overall relative abundances below 1% (Nitrospirae, Verrucomicrobia, Fusobacteria, Chlorobi, Fibrobacteres, Deinococcus-Thermus, Spirochaetes, WCHB1-60, BD1-5, GOUTA4, and candidate divisions OD1, OP10, TM6, TM7, and WS3).
The fungal sequences belonged mostly to the phyla Basidiomycota (47.4% overall) and Ascomycota (38.8% overall), with 9.7% of all fungal sequences remaining unclassified at the phylum level (Fig. 2). Three other fungal phyla occurred only sparsely (3.6% Zygomycota, 0.4% Chytridiomycota, and 0.1% Glomeromycota). Unlike in the bacterial sequence data, stark differences were observed between the MRBs at the phylum level in the fungal data (Fig. 2), with Ascomycota and Basidiomycota relative abundances being significantly different among the four beds (P < 0.001). DS1 and DS2 bed samples were heavily dominated by Basidiomycota (which accounted for 80.3% and 73.1% of fungal sequences, respectively), whereas for PBS and SRC1 samples, these proportions were 31.3% and 17.6%, respectively. Conversely, DS1 and DS2 had lower relative abundances of Ascomycota sequences (10.9% and 7.0%, respectively) than PBS (35.1%) and SRC1 (62.2%). Also in contrast to the bacterial taxonomic profiles, which showed some clear differences between MRBs and soil samples (consistently more Acidobacteria and fewer Proteobacteria in soils, for example), none of the fungal classes differed significantly in relative abundance between MRB samples and soil samples. Overall, most Ascomycota sequences belonged to the class Dothideomycetes (Fig. 2), and most of these were further grouped into the subclass Pleosporomycetidae (see Fig. S7 in the supplemental material). Basidiomycota sequences belonged almost entirely to the class Agaricomycetes, subclasses Agaricomycetidae, and incertae sedis (encompassing the orders Cantharellales, Polyporales, Russulales, Sebacinales, and Thelephorales). A much larger proportion of Basidiomycetes than Ascomycetes remained unclassified at the subclass level and beyond (see Fig. S7).
Almost half of algal sequences (40.4%) belonged to the phylum Chlorophyta (green algae) (Fig. 2). Most green algae (79.3% of Chlorophyta sequences) could not be classified further. Those that could were placed in the classes Chlorophyceae (orders Sphaeropleales, Chlamydomonadales, and Oedogoniales) and Trebouxiophyceae (orders Chlorellales, Microthamniales, and Coccomyxaceae). After the Chlorophyta, the next most abundant phyla were the Bacillariophyta (diatoms), accounting for 18.9% of total sequences, and the PX clade (encompassing the yellow-green algae phylum Xanthophyceae), accounting for 11.3% overall. A total of 14.9% of algal sequences were unclassified at the phylum level. All of the Bacillariophyta sequences that could be classified to genus level (39.2%) were placed in the genus Fistulifera, and all of the PX clade Xanthophyceae sequences belonged to the genus Vaucheria, filamentous yellow-green algae. Of the four main phyla detected in the algal sequence data, only the Bacillariophyta appeared to differ among the four MRBs, with higher abundances in beds DS1 and DS2 (26.4% and 37.6%, respectively) than with PBS (6.7%) and SRC1 (6.9%); however, following correction for multiple comparisons, the difference was not significant (P = 0.197). Similarly, Bacillariophyta appeared to differ between bed samples (21.0%) and soil samples (10.3%), but the difference was not significant (P = 0.249).
Occurrence of known Mn(II)-oxidizing organisms.
Four Mn(II)-oxidizing bacterial strains were isolated previously from these MRBs (20), but no sequences with 100% similarity to these isolates were detected in the MRB sequence data, except for one Pseudomonas sp. strain DS3sK1h sequence in SRC1. At a similarity level of 97.0 to 99.9%, these isolates accounted for 0.11% of DS1 bacterial sequences, 0.06% of DS2 sequences, 0.20% of SRC sequences, and 0.13% of soil sequences (all soil sites combined). Relatives of the Mn(II)-oxidizing bacterial isolates were not detected in the PBS sequence data, even at a similarity level of only 95%.
Overall, nine Mn(II)-oxidizing fungi isolated from these MRBs (20) accounted for a greater proportion of the sequence data than did the Mn-oxidizing bacterial isolates, with several fungal isolates individually exceeding 1% of sequences at a similarity level of 100% within some treatment beds (see Fig. S8 in the supplemental material). SRC1 had the greatest abundance of known Mn(II)-oxidizing fungi: eight of the nine isolates were detected, with Phoma sp. strain DS1wsM30b accounting for 10.52% of sequences and Alternaria alternata SRC1lrK2f accounting for 2.81%. In total, known Mn(II)-oxidizing fungal isolates accounted for 14.78% of SRC1 fungal sequences. In contrast, these fungal isolates together accounted for 1.92% of DS1 fungal sequences, 1.63% of DS2 sequences, and 1.43% of PBS sequences (see Fig. S8). Eight of the nine isolates were detected in the control soils, and together they accounted for 4.11% of soil fungal sequences.
Biotic coupling.
Previous analyses were carried out separately with the three target groups (bacteria, fungi, and algae). With this final analysis, we attempted to determine whether the community structures of the three target groups were correlated or whether they were independent. In other words, are samples that are more similar with respect to one target group also more similar with respect to the other target groups?
Significant positive correlations were found between all pairs of target groups (Mantel r, 0.446 to 0.665; P = 0.001) (Fig. 3). Therefore, samples with more similar communities of one target tend to have more similar communities of the other targets; for example, samples with more similar bacterial communities typically have more similar fungal and algal communities as well, whereas samples with very different bacterial communities also generally have very different fungal and algal communities. Figure 3 shows Bray-Curtis distances calculated from a relative abundance of OTUs clustered at the 0.03 level, but the significant positive correlations between target groups hold at all OTU clustering levels between 0.00 and 0.20, as well as when Jaccard distances based on presence/absence data are used instead. Overall, the three targets examined here showed strong biotic coupling, both in their membership and in the relative abundance of their community members.
FIG 3.

Correlation of bacterial, fungal, and algal communities in Mn(II) removal beds. Scatter plots show pairwise Bray-Curtis distances for all samples, excluding SRC1 soil (15 samples in total, yielding 105 pairwise data points), with increasing distance indicating less similar communities. Distances were calculated from OTU relative abundance matrices based on a clustering threshold of 0.03. Correlation statistics for each pair of targets (bacteria, fungi, and algae) were calculated using Mantel tests with 999 permutations. Histograms on the diagonal show the distribution of pairwise Bray-Curtis distance values of each target group.
DISCUSSION
Microbial activity contributes greatly to the removal of Mn(II) from coal mine drainage (2), and understanding the communities involved could improve remediation efforts. We profiled the bacteria, archaea, fungi, and algae in four Mn(II) removal beds (MRBs) to determine (i) whether each bed develops a unique community or whether similar communities arise in different beds, (ii) whether differences are observed within each bed (from the influent to the effluent), and (iii) whether MRB communities are distinct from the surrounding CMD-free soil. Our four MRBs remove various proportions of their influent's dissolved Mn (see Table S1 in the supplemental material): nearly 100% in PBS and SRC1, 50% in DS2 (which, granted, has a higher influent concentration than the other MRBs), and 0% in DS1 (2). Of particular interest is whether microbial communities differ substantially between MRBs that remove the majority of influent Mn (PBS and SRC1) and those that do not (DS1 and DS2).
Of the four microbial groups profiled, only the fungi showed stark differences at the phylum level between the MRBs that remove the majority of influent Mn (PBS and SRC1) and those that do not (DS1 and DS2) (Fig. 2). The similarity of DS1 and DS2 MRB samples could be due to the geographic proximity of these two beds (roughly 250 m separates them), although if this were the only factor, their corresponding soil samples also would be expected to show similarities to each other, which is not the case (Fig. 2). Ascomycota sequences, belonging mainly to the classes Dothideomycetes and Sordariomycetes, were significantly more abundant in PBS and SRC1, whereas Basidiomycota sequences, almost exclusively in the class Agaricomycetes, heavily dominated the fungal profiles of DS1 and DS2. Both Ascomycota and Basidiomycota, and specifically the main classes identified in our four MRBs, contain known Mn(II)-oxidizing members. However, previous efforts to isolate Mn(II)-oxidizing fungi from these beds yielded only Ascomycota (5, 20), as did culturing efforts in other Mn(II)-rich environments, such as Ashumet Pond, Massachusetts (15), Mn nodules in Japanese rice fields (12), Mn oxide-coated stream bed pebbles in Japan (17), and another Mn attenuation system in the United Kingdom (19). Most of the isolates obtained in these culturing studies belonged to the Ascomycota classes Dothideomycetes and Sordariomycetes, the same two fungal classes that dominated the MRBs with near-complete Mn(II) removal in our study (PBS and SRC1). Furthermore, the Mn(II)-oxidizing Ascomycota isolates obtained in reference 20 from these MRBs were more abundant in the sequence data from SRC1 than from PBS, DS1, and DS2. Interestingly, nearby soils had a higher proportion of these isolates than three of the four MRBs, suggesting that the Mn(II)-oxidizing fungi that colonize MRBs are not specific to aquatic sediment environments and that the fungal communities in MRBs are seeded in part from nearby soil.
The Basidiomycota class Agaricomycetes, which dominated fungal profiles in DS1 and DS2 (Fig. 2), usually is found in terrestrial environments, although it also was abundant in a culture-independent survey of fungi in Mn oxide-rich sediments in Ashumet Pond, Massachusetts (15). Several species of wood-rot or litter-decaying Agaricomycetes can oxidize Mn(II), notably Phanerochaete chrysosporium (50), Stropharia rugosoannulata (51), and Pleurotus eryngii (52). However, no close relatives of these known Mn(II)-oxidizing Agaricomycetes were present in the four MRBs, with the exception of a single sequence in DS2 with 100% similarity to S. rugosoannulata. Therefore, the bulk of the Agaricomycetes sequences that dominate DS1 and DS2 do not belong to known Mn(II) oxidizers, although it is possible that the taxa present can oxidize Mn(II) but have remained resistant to cultivation. Previous culturing attempts failed to obtain Mn(II)-oxidizing isolates from this class (20).
Interestingly, the stark differences in fungal taxonomic profiles between MRBs that remove the majority of Mn(II) and those that do not were not mirrored in the other groups (Fig. 2). Bacteria are thought to be the main drivers of biological Mn(II) oxidation in many environments, but if that were the case in our MRBs, we would expect some differences in bacterial taxonomic profiles between MRBs that remove the majority of Mn(II) and those that do not, as well as within each MRB, correlating with dissolved Mn(II) concentrations. The similarity in bacterial communities across all four MRBs, in contrast to the drastic differences in fungal communities, suggests that the latter are important drivers of Mn removal in these MRBs. This supports the findings of Burgos et al. (5), who, in a series of MRB sediment incubation experiments with and without fungicides, showed that fungal activity accounted for over 80% of Mn(II) oxidation in the Fairview MRB in Pennsylvania. However, in later experiments, the same research group found that fungi were not dominant contributors to Mn(II) oxidation in sediments from that same MRB, as well as from seven others (2), suggesting that Mn(II) oxidation is a dynamic process affected by hydrological and other factors (although as these authors noted, their laboratory growth conditions may have inhibited fungal activity).
Taxonomic profiles alone cannot rule out a prominent role for bacterial Mn(II) oxidation in our four MRBs, since differences between the beds in the proportion of influent Mn(II) removed could be due to environmental conditions that favor or inhibit the activation of necessary metabolic pathways without changing taxonomic distributions. Proteobacteria were the most abundant bacterial phylum in the MRBs (Fig. 2). The same has been reported in most culture-independent surveys of Mn-rich environments, including Mn oxide-rich freshwater sediments in the United States (15, 53), Mn nodules in Japanese rice fields (54), ferromanganese deposits in caves (55), and in biofilters treating Fe-, Mn-, and ammonia-containing water (56, 57). The abundance of Proteobacteria is not unusual. This widespread, highly diverse phylum is dominant in many environments, notably soils (including the four control soil samples in this study, although at a significantly lower abundance than that in the MRBs). It also encompasses numerous confirmed examples of Mn(II) oxidation in the Alpha-, Beta-, Gamma-, and Deltaproteobacteria (10, 11, 14, 15, 24, 55). Indeed, many of the model Mn(II)-oxidizing bacteria used to elucidate mechanisms of oxidation belong to this phylum (23–25, 58). However, since the relative abundance of proteobacterial taxa did not differ significantly between MRBs, even at increasingly fine taxonomic resolution, and the relative abundance of any of the other bacterial phyla did not differ, the taxonomic profile of the bacterial communities cannot be correlated with differences in the proportion of Mn(II) removed by the four MRBs. Of course, since these are DNA-based profiles that include dead and dormant cells, it is possible that the active components of the bacterial communities show more pronounced differences between or within the MRBs that could be detected only with RNA-based profiling.
At first glance, algal taxonomic profiles appeared to differ between MRBs that remove the majority of dissolved Mn(II) (PBS and SRC1) and those that do not (DS1 and DS2) (Fig. 2), with more Stramenopiles sequences (diatoms and yellow-green algae) in DS1 and DS2 than in PBS and SRC1, which contained mostly Viridiplantae sequences (green algae and plants). Due to the high variability within each bed and the small number of samples per bed, these differences were not statistically significant, so we cannot draw any conclusions regarding the influence of algae on the proportion of Mn(II) removed by these systems. However, it is likely that they contribute to Mn removal in some capacity, either indirectly [by providing fixed carbon for Mn(II)-oxidizing fungi and bacteria] or by oxidizing Mn(II) directly. Algae, including green algae such as Klebsormidium, Chara, Ulothrix, and Chlamydomonas, as well as diatoms, often are observed to thrive in metal-contaminated environments (59, 60), and a limestone treatment pond with a mixed green algae and microbial mat removed far more dissolved Mn than limestone alone (61). Algae not only can accumulate Mn up to 90,000 mg/kg dry weight (62) but also can catalyze its oxidation directly (63–65). This is thought to occur through the creation of pH microenvironments, whereby dense populations of algal cells, through photosynthesis, increase local pH above 9.0, resulting in abiotic oxidation of Mn(II) by molecular oxygen (63). Furthermore, photosynthesis-linked pH modulation might not be the only mechanism of algal Mn(II) oxidation. Robbins et al. (64) hinted at this when, on glass slides submerged in a Mn-contaminated creek, they observed that some, but not all, diatoms were coated with Mn oxides, whereas all would be expected to produce Mn oxides if the mechanism were purely photosynthesis-linked pH modulation. Many algae are known to produce reactive oxygen species, notably superoxide, as a by-product of photosynthesis, as antibacterial agents (66), and in response to metal contamination (59). Some bacteria (25) and fungi (22) oxidize Mn(II) via superoxide production, and it is possible that some of the algae in our MRBs can do the same.
While the taxonomic profiles showed that only fungal communities differed significantly between MRBs, OTU-based analyses painted a different picture. When samples were clustered based on distance metrics (Bray-Curtis and Jaccard), clear patterns emerged (Fig. 1). First, distinctions were seen between soil and MRB samples, with MRBs from different parts of Pennsylvania (as far apart as 150 km) clustering more closely together than with their corresponding soil samples, suggesting that MRBs in disparate areas select for similar communities, and MRB communities are not simply a subset of those in their immediate surroundings. This pattern held for bacteria and algae; however, fungi showed no separation of soil and MRB samples; instead, soil samples were loosely clustered with those from their corresponding MRB, suggesting a different community development history and perhaps different dispersal mechanisms. Furthermore, while the patterns in bacterial and algal community structure clearly are influenced by one or more of the factors that distinguish MRBs from nearby soils (water-saturated versus drained, high metal load in MRBs, differences in carbon and nutrient availability, etc.), clearly these factors are less influential drivers of fungal community structure in these systems. Of importance might also be the use of ITS1 for fungal profiling compared with ribosomal subunits for the other groups. ITS1 is degraded after transcription and has high variability, including intraspecific variability that is more pronounced in some fungal lineages than in others (67). The greater scatter in the fungal NMDS plot could be a result of the fundamentally different function of and selection pressures operating on ITS1.
The second pattern observed in the NMDS plots was some loose clustering by treatment bed, which occurred with all groups (Fig. 1). In several instances, DS1 and DS2 samples showed some overlap, which is not surprising given their geographic proximity (roughly 250 m separates them). Perhaps more interesting, PBS and SRC1 often showed some overlap as well (for example, with bacteria and algae shown in Fig. 1). These MRBs are over 50 km apart. Their main similarity, in the context of this study, is that they remove nearly 100% of influent Mn(II), whereas the other two MRBs remove far smaller proportions (50% and 0%). This suggests that, despite the bacterial and algal taxonomic profiles being similar in MRBs that remove different proportions of influent Mn(II), subtle differences at the OTU level that are consistent across highly efficient beds could point to subgroupings of microorganisms with metabolic functions that are more conducive to Mn(II) removal. A wider survey of MRBs would be required to confirm this finding, and a more targeted investigation focusing on the specific OTUs in highly efficient MRBs could give insight into mechanisms of Mn(II) removal in mixed communities.
The sample clustering observed at the OTU level was not reflected in the taxonomic profiles, highlighting differences in the two approaches. Taxonomic profiling is coarse (especially when limited to phyla and classes) and relies on accurate reference databases, whereas OTU-based analyses rely solely on sequence data. It is interesting that in this study, while different OTUs appear to occur in each MRB [with more similar OTUs being detected in the MRBs with near-complete removal of Mn(II)], their proportion remains fairly constant across the main bacterial and algal taxonomic groups (but not fungal ones).
We showed that microbial communities in MRBs are far more diverse than suggested by culturing or by culture-independent profiling of a single group. Similar to findings of reference 15, known Mn(II) oxidizers, especially bacterial ones, accounted for a small proportion of the total community, suggesting that their activity is not coupled to their relative abundance or that many more organisms are capable of Mn(II) oxidation than have been cultured, including organisms, such as algae, that have not been directly associated with Mn(II) oxidation in these systems. Clear differences were observed between MRBs with near-complete removal of Mn(II) and those that remove smaller proportions of influent Mn(II). Future work should expand to include groups not covered in this study, notably heterotrophic eukaryotes, which also could be influencing Mn(II) oxidation, and examine more closely how microbial communities become established in new MRBs, with particular emphasis on differences between fungi and other community members. Furthermore, it is important to elucidate the mechanisms by which these organisms oxidize Mn(II), since this could inform remediation strategies. For example, since oxidation is linked to superoxide production, encouraging processes that produce superoxide, such as fungal cell differentiation, should result in greater Mn(II) removal. Finally, given that the groups examined here showed significant biotic coupling (suggesting a degree of interdependence), it is worth exploring whether seeding new systems with mixed communities is more effective than seeding with pure cultures or allowing communities to develop without seeding.
Supplementary Material
ACKNOWLEDGMENTS
This project was funded by Smithsonian Scholarly Studies and Next-Generation Sequencing grants to C.M.S., by a Smithsonian Postdoctoral Fellowship to D.L.C., and by the National Science Foundation, grant numbers EAR-1249489 (awarded to C.M.H.) and CBET-1336496 (awarded to C.M.H. and C.M.S.).
We thank Margaret Dunn and Cliff Denholm, Stream Restoration Inc., and Brent Means, Office of Surface Mining Reclamation and Enforcement (U.S. Department of the Interior), for assistance and access to sample sites.
We have no conflict of interest to declare.
Footnotes
Supplemental material for this article may be found at http://dx.doi.org/10.1128/AEM.03643-14.
REFERENCES
- 1.Cravotta CA., III 2008. Dissolved metals and associated constituents in abandoned coal-mine discharges, Pennsylvania, USA. Part 1: constituent quantities and correlations. Appl Geochem 23:166–202. doi: 10.1016/j.apgeochem.2007.10.011. [DOI] [Google Scholar]
- 2.Luan F, Santelli CM, Hansel CM, Burgos WD. 2012. Defining manganese(II) removal processes in passive coal mine drainage treatment systems through laboratory incubation experiments. Appl Geochem 27:1567–1578. doi: 10.1016/j.apgeochem.2012.03.010. [DOI] [Google Scholar]
- 3.Berghorn GH, Hunzeker GR. 2001. Passive treatment for remediating abandoned-mine drainage. Remediat J 11:111–127. doi: 10.1002/rem.1007. [DOI] [Google Scholar]
- 4.Johnson KL, Baker A, Manning DAC. 2005. Passive treatment of Mn-rich mine water: using fluorescence to observe microbiological activity. Geomicrobiol J 22:141–149. doi: 10.1080/01490450590945979. [DOI] [Google Scholar]
- 5.Burgos WD, Tan H, Santelli CM, Hansel CM. 2010. Importance of fungi in biological Mn(II) oxidation in limestone treatment beds, p 71–88. In Barnhisel R. (ed), National Meeting of the American Society of Mining and Reclamation. ASMR, Pittsburgh, PA. [Google Scholar]
- 6.Luther GW. 2010. The role of one- and two-electron transfer reactions in forming thermodynamically unstable intermediates as barriers in multi-electron redox reactions. Aquat Geochem 16:395–420. doi: 10.1007/s10498-009-9082-3. [DOI] [Google Scholar]
- 7.Madden AS, Hochella MF. 2005. A test of geochemical reactivity as a function of mineral size: manganese oxidation promoted by hematite nanoparticles. Geochim Cosmochim Acta 69:389–398. doi: 10.1016/j.gca.2004.06.035. [DOI] [Google Scholar]
- 8.Hansard SP, Easter HD, Voelker BM. 2011. Rapid reaction of nanomolar Mn(II) with superoxide radical in seawater and simulated freshwater. Environ Sci Technol 45:2811–2817. doi: 10.1021/es104014s. [DOI] [PubMed] [Google Scholar]
- 9.Learman DR, Wankel SD, Webb SM, Martinez N, Madden AS, Hansel CM. 2011. Coupled biotic–abiotic Mn(II) oxidation pathway mediates the formation and structural evolution of biogenic Mn oxides. Geochim Cosmochim Acta 75:6048–6063. doi: 10.1016/j.gca.2011.07.026. [DOI] [Google Scholar]
- 10.Templeton AS, Staudigel H, Tebo BM. 2005. Diverse Mn(II)-oxidizing bacteria isolated from submarine basalts at Loihi Seamount. Geomicrobiol J 22:127–139. doi: 10.1080/01490450590945951. [DOI] [Google Scholar]
- 11.Anderson CR, Dick GJ, Chu M-L, Cho J-C, Davis RE, Bräuer SL, Tebo BM. 2009. Aurantimonas manganoxydans, sp. nov. and Aurantimonas litoralis, sp. nov.: Mn(II) oxidizing representatives of a globally distributed clade of alpha-Proteobacteria from the order Rhizobiales. Geomicrobiol J 26:189–198. doi: 10.1080/01490450902724840. [DOI] [PMC free article] [PubMed] [Google Scholar]
- 12.Cahyani VR, Murase J, Ishibashi E, Asakawa S, Kimura M. 2009. Phylogenetic positions of Mn2+-oxidizing bacteria and fungi isolated from Mn nodules in rice field subsoils. Biol Fertil Soils 45:337–346. doi: 10.1007/s00374-008-0337-8. [DOI] [Google Scholar]
- 13.Ozaki T, Wang X, Ohnuki T. 2013. Manganese and arsenic oxidation performance of Bacterium-Yunotaki 86 (BY86) from Hokkaido, Japan, and the bacterium's phylogeny. Geomicrobiol J 30:559–565. doi: 10.1080/01490451.2012.726316. [DOI] [Google Scholar]
- 14.Yang W, Zhang Z, Zhang Z, Chen H, Liu J, Ali M, Liu F, Li L. 2013. Population structure of manganese-oxidizing bacteria in stratified soils and properties of manganese oxide aggregates under manganese-complex medium enrichment. PLoS One 8:e73778. doi: 10.1371/journal.pone.0073778. [DOI] [PMC free article] [PubMed] [Google Scholar]
- 15.Santelli CM, Chaput DL, Hansel CM. 2014. Microbial communities promoting Mn(II) oxidation in Ashumet Pond, a historically polluted freshwater pond undergoing remediation. Geomicrobiol J 31:605–616. doi: 10.1080/01490451.2013.875605. [DOI] [Google Scholar]
- 16.Thompson IA, Huber DM, Guest CA, Schulze DG. 2005. Fungal manganese oxidation in a reduced soil. Environ Microbiol 7:1480–1487. doi: 10.1111/j.1462-2920.2005.00842.x. [DOI] [PubMed] [Google Scholar]
- 17.Miyata N, Maruo K, Tani Y, Tsuno H, Seyama H, Soma M, Iwahori K. 2006. Production of biogenic manganese oxides by anamorphic ascomycete fungi isolated from streambed pebbles. Geomicrobiol J 23:63–73. doi: 10.1080/01490450500533809. [DOI] [Google Scholar]
- 18.Takano K, Itoh Y, Ogino T, Kurosawa K, Sasaki K. 2006. Phylogenetic analysis of manganese-oxidizing fungi isolated from manganese-rich aquatic environments in Hokkaido, Japan. Limnology 7:219–223. doi: 10.1007/s10201-006-0177-x. [DOI] [Google Scholar]
- 19.Mariner R, Johnson DB, Hallberg KB. 2008. Characterisation of an attenuation system for the remediation of Mn(II) contaminated waters. Hydrometallurgy 94:100–104. doi: 10.1016/j.hydromet.2008.05.024. [DOI] [Google Scholar]
- 20.Santelli CM, Pfister DH, Lazarus D, Sun L, Burgos WD, Hansel CM. 2010. Promotion of Mn(II) oxidation and remediation of coal mine drainage in passive treatment systems by diverse fungal and bacterial communities. Appl Environ Microbiol 76:4871–4875. doi: 10.1128/AEM.03029-09. [DOI] [PMC free article] [PubMed] [Google Scholar]
- 21.Tebo BM, Johnson HA, McCarthy JK, Templeton AS. 2005. Geomicrobiology of manganese(II) oxidation. Trends Microbiol 13:421–428. doi: 10.1016/j.tim.2005.07.009. [DOI] [PubMed] [Google Scholar]
- 22.Hansel CM, Zeiner CA, Santelli CM, Webb SM. 2012. Mn(II) oxidation by an ascomycete fungus is linked to superoxide production during asexual reproduction. Proc Natl Acad Sci U S A 109:12621–12625. doi: 10.1073/pnas.1203885109. [DOI] [PMC free article] [PubMed] [Google Scholar]
- 23.Dick GJ, Podell S, Johnson HA, Rivera-Espinoza Y, Bernier-Latmani R, McCarthy JK, Torpey JW, Clement BG, Gaasterland T, Tebo BM. 2008. Genomic insights into Mn(II) oxidation by the marine alphaproteobacterium Aurantimonas sp strain SI85-9A1. Appl Environ Microbiol 74:2646–2658. doi: 10.1128/AEM.01656-07. [DOI] [PMC free article] [PubMed] [Google Scholar]
- 24.Hansel CM, Francis CA. 2006. Coupled photochemical and enzymatic Mn(II) oxidation pathways of a planktonic Roseobacter-like bacterium. Appl Environ Microbiol 72:3543–3549. doi: 10.1128/AEM.72.5.3543-3549.2006. [DOI] [PMC free article] [PubMed] [Google Scholar]
- 25.Learman DR, Voelker BM, Vazquez-Rodriguez AI, Hansel CM. 2011. Formation of manganese oxides by bacterially generated superoxide. Nat Geosci 4:95–98. doi: 10.1038/ngeo1055. [DOI] [Google Scholar]
- 26.Miyata N, Tani Y, Sakata M, Iwahori K. 2007. Microbial manganese oxide formation and interaction with toxic metal ions. J Biosci Bioeng 104:1–8. doi: 10.1263/jbb.104.1. [DOI] [PubMed] [Google Scholar]
- 27.Soldatova AV, Butterfield C, Oyerinde OF, Tebo BM, Spiro TG. 2012. Multicopper oxidase involvement in both Mn(II) and Mn(III) oxidation during bacterial formation of MnO2. J Biol Inorg Chem 17:1151–1158. doi: 10.1007/s00775-012-0928-6. [DOI] [PMC free article] [PubMed] [Google Scholar]
- 28.Tebo BM, Bargar JR, Clement BG, Dick GJ, Murray KJ, Parker D, Verity R, Webb SM. 2004. Biogenic manganese oxides: properties and mechanisms of formation. Annu Rev Earth Planet Sci 32:287–328. doi: 10.1146/annurev.earth.32.101802.120213. [DOI] [Google Scholar]
- 29.Sun Y, Wolcott RD, Dowd SE. 2011. Tag-encoded FLX amplicon pyrosequencing for the elucidation of microbial and functional gene diversity in any environment. Methods Mol Biol 733:129–141. doi: 10.1007/978-1-61779-089-8_9. [DOI] [PubMed] [Google Scholar]
- 30.Frias-Lopez J, Zerkle AL, Bonheyo GT, Fouke BW. 2002. Partitioning of bacterial communities between seawater and healthy, black band diseased, and dead coral surfaces. Appl Environ Microbiol 68:2214–2228. doi: 10.1128/AEM.68.5.2214-2228.2002. [DOI] [PMC free article] [PubMed] [Google Scholar]
- 31.Lane DJ. 1991. 16S/23S rRNA sequencing, p 115–175. In Stackebrandt E, Goodfellow M (ed). Nucleic acid techniques in bacterial systematics. John Wiley & Sons, New York, NY. [Google Scholar]
- 32.Takai K, Horikoshi K. 2000. Rapid detection and quantification of members of the archaeal community by quantitative PCR using fluorogenic probes. Appl Environ Microbiol 66:5066–5072. doi: 10.1128/AEM.66.11.5066-5072.2000. [DOI] [PMC free article] [PubMed] [Google Scholar]
- 33.Gardes M, Bruns TD. 1993. ITS primers with enhanced specificity for basidiomycetes–application to the identification of mycorrhizae and rusts. Mol Ecol 2:113–118. doi: 10.1111/j.1365-294X.1993.tb00005.x. [DOI] [PubMed] [Google Scholar]
- 34.White TJ, Bruns T, Lee S, Taylor JW. 1990. Amplification and direct sequencing of fungal ribosomal RNA genes for phylogenetics, p 315–322. In Innis MA, Gelfand DH, Sninsky JJ, White TJ (ed), PCR protocols: a guide to methods and applications. Academic Press, Inc., New York, NY. [Google Scholar]
- 35.Sherwood AR, Presting GG. 2007. Universal primers amplify a 23S rDNA plastid marker in eukaryotic algae and cyanobacteria. J Phycol 43:605–608. doi: 10.1111/j.1529-8817.2007.00341.x. [DOI] [Google Scholar]
- 36.Cutler NA, Chaput DL, van der Gast CJ. 2014. Long-term changes in soil microbial communities during primary succession. Soil Biol Biochem 69:359–370. doi: 10.1016/j.soilbio.2013.11.022. [DOI] [Google Scholar]
- 37.Schloss PD, Westcott SL, Ryabin T, Hall JR, Hartmann M, Hollister EB, Lesniewski RA, Oakley BB, Parks DH, Robinson CJ, Sahl JW, Stres B, Thallinger GG, Van Horn DJ, Weber CF. 2009. Introducing mothur: open-source, platform-independent, community-supported software for describing and comparing microbial communities. Appl Environ Microbiol 75:7537–7541. doi: 10.1128/AEM.01541-09. [DOI] [PMC free article] [PubMed] [Google Scholar]
- 38.Schloss PD, Gevers D, Westcott SL. 2011. Reducing the effects of PCR amplification and sequencing artifacts on 16S rRNA-based studies. PLoS One 6:e27310. doi: 10.1371/journal.pone.0027310. [DOI] [PMC free article] [PubMed] [Google Scholar]
- 39.Quast C, Pruesse E, Yilmaz P, Gerken J, Schweer T, Yarza P, Peplies J, Glöckner FO. 2013. The SILVA ribosomal RNA gene database project: improved data processing and web-based tools. Nucleic Acids Res 41:D590–D596. doi: 10.1093/nar/gks1219. [DOI] [PMC free article] [PubMed] [Google Scholar]
- 40.Edgar RC, Haas BJ, Clemente JC, Quince C, Knight R. 2011. UCHIME improves sensitivity and speed of chimera detection. Bioinformatics 27:2194–2200. doi: 10.1093/bioinformatics/btr381. [DOI] [PMC free article] [PubMed] [Google Scholar]
- 41.Wang Q, Garrity GM, Tiedje JM, Cole JR. 2007. Naive Bayesian classifier for rapid assignment of rRNA sequences into the new bacterial taxonomy. Appl Environ Microbiol 73:5261–5267. doi: 10.1128/AEM.00062-07. [DOI] [PMC free article] [PubMed] [Google Scholar]
- 42.Bengtsson-Palme J, Ryberg M, Hartmann M, Branco S, Wang Z, Godhe A, De Wit P, Sánchez-García M, Ebersberger I, de Sousa F, Amend AS, Jumpponen A, Unterseher M, Kristiansson E, Abarenkov K, Bertrand YJK, Sanli K, Eriksson KM, Vik U, Veldre V, Nilsson RH. 2013. Improved software detection and extraction of ITS1 and ITS2 from ribosomal ITS sequences of fungi and other eukaryotes for analysis of environmental sequencing data. Methods Ecol Evol 4:914–919. doi: 10.1111/2041-210X.12073. [DOI] [Google Scholar]
- 43.Abarenkov K, Tedersoo L, Nilsson RH, Vellak K, Saar I, Veldre V, Parmasto E, Prous M, Aan A, Ots M, Kurina O, Ostonen I, Jogeva J, Halapuu S, Poldmaa K, Toots M, Truu J, Larsson K-H, Koljalg U, Henrik H. 2010. PlutoF–a web based workbench for ecological and taxonomic research, with an online implementation for fungal ITS sequences. Evol Bioinform Online 6:189–196. doi: 10.4137/EBO.S6271. [DOI] [Google Scholar]
- 44.Maurer BA, McGill BJ. 2011. Measurements of species diversity, p 55–65. In Magurran AE, McGill BJ (ed), Biological diversity: frontiers in measurement and assessment. Oxford University Press, Oxford, United Kingdom. [Google Scholar]
- 45.R Core Team. 2013. R: a language and environment for statistical computing. R Foundation for Statistical Computing, Vienna, Austria. [Google Scholar]
- 46.Oksanen J, Blanchet FG, Kindt R, Legendre P, Minchin PR, O'Hara RB, Simpson GL, Solymos P, Stevens HH, Wagner H. 2013. vegan: community ecology package. R package, version 2.0-8. [Google Scholar]
- 47.Jost L, Chao A, Chazdon RL. 2011. Compositional similarity and beta diversity, p 66–84. In Magurran AE, McGill BJ (ed), Biological diversity: frontiers in measurement and assessment. Oxford University Press, Oxford, United Kingdom. [Google Scholar]
- 48.Anderson MJ. 2001. A new method for non-parametric multivariate analysis of variance. Austral Ecol 26:32–46. doi: 10.1111/j.1442-9993.2001.01070.pp.x. [DOI] [Google Scholar]
- 49.Abarenkov K, Nilsson RH, Larsson K-H, Alexander IJ, Eberhardt U, Erland S, Høiland K, Kjøller R, Larsson E, Pennanen T, Sen R, Taylor AFS, Tedersoo L, Ursing BM, Vrålstad T, Liimatainen K, Peintner U, Kõljalg U. 2010. The UNITE database for molecular identification of fungi–recent updates and future perspectives. New Phytol 186:281–285. doi: 10.1111/j.1469-8137.2009.03160.x. [DOI] [PubMed] [Google Scholar]
- 50.Glenn JK, Akileswaran L, Gold MH. 1986. Mn(II) oxidation is the principal function of the extracellular Mn-peroxidase from Phanerochaete chrysosporium. Arch Biochem Biophys 251:688–696. [DOI] [PubMed] [Google Scholar]
- 51.Schlosser D, Höfer C. 2002. Laccase-catalyzed oxidation of Mn2+ in the presence of natural Mn3+ chelators as a novel source of extracellular H2O2 production and its impact on manganese peroxidase. Appl Environ Microbiol 68:3514–3521. doi: 10.1128/AEM.68.7.3514-3521.2002. [DOI] [PMC free article] [PubMed] [Google Scholar]
- 52.Ruiz-Dueñas FJ, Morales M, Pérez-Boada M, Choinowski T, Martínez MJ, Piontek K, Martínez AT. 2007. Manganese oxidation site in Pleurotus eryngii versatile peroxidase: a site-directed mutagenesis, kinetic, and crystallographic study. Biochemistry 46:66–77. doi: 10.1021/bi061542h. [DOI] [PubMed] [Google Scholar]
- 53.Stein LY, La Duc MT, Grundl TJ, Nealson KH. 2001. Bacterial and archaeal populations associated with freshwater ferromanganous micronodules and sediments. Environ Microbiol 3:10–18. doi: 10.1046/j.1462-2920.2001.00154.x. [DOI] [PubMed] [Google Scholar]
- 54.Cahyani VR, Murase J, Ishibashi E, Asakawa S, Kimura M. 2007. Bacterial communities in manganese nodules in rice field subsoils: estimation using PCR-DGGE and sequencing analyses. Soil Sci Plant Nutr 53:575–584. doi: 10.1111/j.1747-0765.2007.00176.x. [DOI] [Google Scholar]
- 55.Carmichael MJ, Carmichael SK, Santelli CM, Strom A, Bräuer SL. 2013. Mn(II)-oxidizing bacteria are abundant and environmentally relevant members of ferromanganese deposits in caves of the upper Tennessee River Basin. Geomicrobiol J 30:779–800. doi: 10.1080/01490451.2013.769651. [DOI] [Google Scholar]
- 56.Li X, Chu Z, Liu Y, Zhu M, Yang L, Zhang J. 2013. Molecular characterization of microbial populations in full-scale biofilters treating iron, manganese and ammonia containing groundwater in Harbin, China. Bioresour Technol 147:234–239. doi: 10.1016/j.biortech.2013.08.008. [DOI] [PubMed] [Google Scholar]
- 57.Yang L, Li X, Chu Z, Ren Y, Zhang J. 2014. Distribution and genetic diversity of the microorganisms in the biofilter for the simultaneous removal of arsenic, iron and manganese from simulated groundwater. Bioresour Technol 156:384–388. doi: 10.1016/j.biortech.2014.01.067. [DOI] [PubMed] [Google Scholar]
- 58.Geszvain K, Butterfield C, Davis RE, Madison AS, Lee S-W, Parker DL, Soldatova A, Spiro TG, Luther GW, Tebo BM. 2012. The molecular biogeochemistry of manganese(II) oxidation. Biochem Soc Trans 40:1244–1248. doi: 10.1042/BST20120229. [DOI] [PubMed] [Google Scholar]
- 59.Das BK, Roy A, Koschorreck M, Mandal SM, Wendt-Potthoff K, Bhattacharya J. 2009. Occurrence and role of algae and fungi in acid mine drainage environment with special reference to metals and sulfate immobilization. Water Res 43:883–894. doi: 10.1016/j.watres.2008.11.046. [DOI] [PubMed] [Google Scholar]
- 60.Prasanna R, Ratha SK, Rojas C, Bruns MA. 2011. Algal diversity in flowing waters at an acidic mine drainage “barrens” in central Pennsylvania, U S A. Folia Microbiol 56:491–496. doi: 10.1007/s12223-011-0073-6. [DOI] [PubMed] [Google Scholar]
- 61.Phillips P, Bender J, Simms R, Rodriguez-Eaton S, Britt C. 1995. Manganese removal from acid coal-mine drainage by a pond containing green algae and microbial mat. Water Sci Technol 31:161–170. [Google Scholar]
- 62.Kleinmann RLP. 1990. Acid mine water treatment using engineered wetlands. Mine Water Environ 9:269–276. [Google Scholar]
- 63.Richardson LL, Aguilar C, Nealson KH. 1988. Manganese oxidation in pH and O2 microenvironments produced by phytoplankton. Limnol Oceanogr 33:352–363. [DOI] [PubMed] [Google Scholar]
- 64.Robbins EI, Corley TL, Conklin MH. 1999. Manganese removal by the epilithic microbial consortium at Pinal Creek near Globe, Arizona, p 1–14. In Proc Tech Meet. U.S. Geological Survey Toxic Substances Hydrology Program, Charleston, SC. [Google Scholar]
- 65.Schöler A, Zaharieva I, Zimmermann S, Wiechen M, Manke A-M, Kurz P, Plieth C, Dau H. 2014. Biogenic manganese-calcium oxides on the cell walls of the algae Chara corallina: elemental composition, atomic structure, and water-oxidation catalysis. Eur J Inorg Chem 2014:780–790. doi: 10.1002/ejic.201300697. [DOI] [Google Scholar]
- 66.Marshall J, Hovenden M, Oda T, Hallegraeff GM. 2002. Photosynthesis does influence superoxide production in the ichthyotoxic alga Chattonella marina (Raphidophyceae). J Plankton Res 24:1231–1236. doi: 10.1093/plankt/24.11.1231. [DOI] [Google Scholar]
- 67.Nilsson RH, Kristiansson E, Ryberg M, Hallenberg N, Larsson K-H. 2008. Intraspecific ITS variability in the kingdom Fungi as expressed in the international sequence databases and its implications for molecular species identification. Evol Bioinform Online 4:193–201. [DOI] [PMC free article] [PubMed] [Google Scholar]
Associated Data
This section collects any data citations, data availability statements, or supplementary materials included in this article.