

Abstract
In the developing endosperm of bread wheat (Triticum aestivum), seed storage proteins are produced on the rough endoplasmic reticulum (ER) and transported to protein bodies, specialized vacuoles for the storage of protein. The functionally important gluten proteins of wheat are transported by two distinct routes to the protein bodies where they are stored: vesicles that bud directly off the ER and transport through the Golgi. However, little is known about the processing of glutenin and gliadin proteins during these steps or the possible impact on their properties. In plants, the RabD GTPases mediate ER-to-Golgi vesicle transport. Available sequence information for Rab GTPases in Arabidopsis, rice, Brachypodium and bread wheat was compiled and compared to identify wheat RabD orthologs. Partial genetic sequences were assembled using the first draft of the Chinese Spring wheat genome. A suitable candidate gene from the RabD clade (TaRabD2a) was chosen for down-regulation by RNA interference (RNAi), and an RNAi construct was used to transform wheat plants. All four available RabD genes were shown by qRT-PCR to be down-regulated in the transgenic developing endosperm. The transgenic grain was found to produce flour with significantly altered processing properties when measured by farinograph and extensograph. SE-HPLC found that a smaller proportion of HMW-GS and large proportion of LMW-GS are incorporated into the glutenin macropolymer in the transgenic dough. Lower protein content but a similar protein profile on SDS-PAGE was seen in the transgenic grain.
Keywords: Triticum aestivum, endosperm, Rab GTPase, trafficking, gluten, breadmaking
Introduction
Different Rab GTPases are involved in regulation fusion of transport vesicles with their different target membranes. In plants, certain types have expanded in number compared with yeast and mammalian systems, and in some classes, members may have diverged somewhat in function (Lunn et al., 2013; Lycett, 2008; Pereira-Leal and Seabra, 2001; Rutherford and Moore, 2002). The RabD clade is involved in ER-to-Golgi trafficking (Batoko et al., 2000; Cheung et al., 2002; Zheng et al., 2005), and in Arabidopsis, dominant negative mutant forms of RabD cause accumulation of secreted proteins and Golgi-resident proteins in an ER-like reticulate compartment (Batoko et al., 2000). However, in leaf protoplasts of other plant species, dominant negative RabD mutant proteins do not stop accumulation of storage proteins in protein bodies (Park et al., 2004), suggesting that RabD does not control all possible routes to the protein bodies.
The major wheat gluten proteins comprise two classes of prolamins, the monomeric gliadins and the glutenins that have interchain disulphide bonds that enable a complex polymeric structure to form (Kreis et al., 1985). The glutenins are classified into high molecular weight glutenin subunits (HMW-GS) and low molecular weight ones (LMW-GS), whereas the gliadins are classified by acidic polyacrylamide gel fractionation into α, β, γ and ω subunits (Woychik et al., 1961). Although the situation is complex, it seems that the elasticity of dough is conferred mainly by the glutenins and the extensibility mainly by the gliadins (Shewry et al., 1995). Good breadmaking wheat is characterized by a high protein content, but the type of protein is also important.
Gluten proteins are synthesized on the rough endoplasmic reticulum (RER) where proteins may be folded, disulphide-bonded and hydrogen-bonded. This can cause them to precipitate to form hydrated protein particles (Tosi et al., 2009). Whether different proteins are trafficked at different times and whether they go by different routes from the ER to the protein bodies is still uncertain. Rubin et al. (1992) proposed that one type of protein body, containing large insoluble HMW protein aggregates, buds directly from the ER, whereas less dense bodies form from protein trafficked in transport vesicles via the Golgi apparatus. An attempt to confirm this by the use of specific antibodies for α, β, γ and ω gliadins, and HMW and LMW glutenin subunits failed to showed any difference in the protein content of storage vesicles (Loussert et al., 2008), but protein sorting into different protein bodies was shown by Tosi et al. (2009) using a very specific antibody for a LMW glutenin subunit. Golgi trafficking is favoured during the early grain-filling stage, whereas aggregation in the ER occurs at later stages and Golgi-stacked cisternae are no longer visible after 12 days postanthesis (dpa) (Levanony et al., 1992; Loussert et al., 2008; Tosi et al., 2009).
Biotechnological attempts to improve gluten quality have mainly focused on expression of specific proteins, especially the HMW glutenins (Leon et al., 2009, 2010; Rakszegi et al., 2008; Tatham et al., 1990). However, the use of a dominant negative mutant tobacco RabD transgene improved gluten strength and increased disulphide bonding in tetraploid durum wheat (Di Luccia et al., 2005). In this study, we have used RNAi to knock down the expression of RabD GTPase genes in the hexaploid breadmaking wheat variety Cadenza and have analysed the effect on dough quality.
Results
Bioinformatics
Phenetic analyses were carried out using Rab protein and nucleotide sequence data from Arabidopsis thaliana, Brachypodium distachyon, rice, wheat and tobacco. Selected sequences were aligned, and a phenetic tree was generated to discern relationships between all RabD proteins from the four organisms (Figure1).
Figure 1.

Phenogram with Rab D protein sequences of wheat, Brachypodium, rice, Arabidopsis and tobacco. Rab D2a homologs are highlighted in blue. Alignment and phenetic tree file were generated using MAFFT version 6 online (Katoh and Toh, 2010). Tree is neighbour-joining with 1000 bootstrap replicates, shown on branches as percentage confidence values.
A cladogram comparing all Rab proteins identified (Figure2) proved helpful in the more specific identification of Rabs in Brachypodium and wheat. The Rab protein family is conserved within clades rather than within species, demonstrating their equivalent function in the two different plants.
Figure 2.

Circular phenogram containing 175 Rab protein sequences from Arabidopsis, rice, Brachypodium and wheat. Rab clades indicated on the outside. Tree is neighbour-joining with 1000 bootstrap replicates, shown on branches as percentage confidence values. Branches corresponding to partitions reproduced in <50% bootstrap replicates are collapsed.
Production, selection and screening of transgenic wheat lines
For the production of transgenic plants, we chose the variety Cadenza, which is a facultative winter variety with moderate breadmaking quality, rated 6 on a 1–9 scale where 9 is highest quality (Rakszegi et al., 2008). Wheat plants were transformed by biolistics with an RNAi construct cloned into the pHMW-Adh-Nos vector (Nemeth et al., 2010; Figure S1) to give endosperm-specific expression. This construct targeted a 270-nucleotide section of the Ta.54382 (RabD2a) coding sequence that included a 23nt match with Ta.54881 (RabD2b). All 29 T0 plants, designated L1 to L29, were screened for transgene presence using PCR. Based on PCR results, 16 T0 plants were selected, each of which was an independent transformation event. From these 16 selected T0 plants, 24 seeds from each plant were initially sown, of which 12 from each plant were grown on to maturity. The designation for each of these mature T1 plants consists of the name of the parent plant followed by .1 to .12. Probable zygosity of all 192 T1 plants was determined by PCR of T2 seedlings for transgene presence. T2 grains from lines that had sufficient grain weight for rheological testing were analysed for size and shape, protein content, moisture content and dough-mixing properties, along with controls. A homozygous transgenic line (L10.5) that displayed a large difference in mixing properties yet similar protein and moisture content compared with the controls was selected to be grown alongside a control line (L24.2).
Expression of RabD genes in transgenic lines
To establish that the target RabD gene (Ta.54382) had been successfully knocked down and to check whether other RabD genes with close sequence similarity were also affected, a quantitative real-time PCR was performed looking at the expression of four RabD genes in the endosperm of T3 lines L10.5 (knock-down) and L24.2 (control) at 14 and 21 dpa.
Three other genes—Ta.2291, Ta.2776 and Ta.54227—were also included as potential normalization genes based on a study identifying reference genes in wheat (Paolacci et al., 2009). However, expression of Ta.2291 appeared to be 79% higher at 14 dpa and 120% higher at 21 dpa in the transgenic line compared with the control and was therefore not used as a normalization gene in this study. qRT-PCR data of the RabD genes were normalized using the Ta.54227 gene (for primers see Tables 1 and 2). Calibration curves were set up for each primer pair using serial dilutions of a sample containing a mixture of all cDNA samples.
Table 1.
Primers used in qPCR
| Unigene | Primer F name | Primer F sequence | Primer R name | Primer R sequence |
|---|---|---|---|---|
| Ta.35418 | Ta.35418-RT1-F | TCC GTT TCT CCG ACG ATT CG | Ta.35418-RT1-R | TCC TGC TGT GTC CCA AAT CTG |
| Ta.47209 | Ta.47209-RT4-F | AGG TCG TCG ATA CAG AGG AG | Ta.47209-RT4-R | GGC TCG CCA TCT TGT TCT TG |
| Ta.54832 | Ta.54832-RT3-F | ATC GGA GAC TCA GGT GTT GG | Ta.54832-RT3-R | GTT CTG AAG CGT TCT TGC CC |
| Ta.54881 | Ta.54881-RT3-F | AAG TCT TGC CTG CTG CTG AG | Ta.54881-RT2-R | TCG CTC TTG TCC AGC AGT ATC |
| Ta.2291 | Ta.2291-P1-F | GCT CTC CAA CAA CAT TGC CAA C | Ta.2291-P1-R | GCT TCT GCC TGT CAC ATA CGC |
| Ta.2776 | Ta.2776-P1-F | CGA TTC AGA GCA GCG TAT TGT TG | Ta.2776-P1-R | AGT TGG TCG GGT CTC TTC TAA ATG |
| Ta.54227 | Ta.54227-P1-F | CAA ATA CGC CAT CAG GGA GAA CAT C | Ta.54227-P1-R | CGC TGC CGA AAC CAC GAG AC |
Sequences are 5′-3′.
Table 2.
Fragments amplified by PCR
| Unigene | Putative Rab name | cDNA product/bp | gDNA product/bp |
|---|---|---|---|
| Ta.35418 | RabD1a | 122 | >122 |
| Ta.47209 | RabD1b | 141 | 547/866 |
| Ta.54832 | RabD2a | 176 | 1176 |
| Ta.54881 | RabD2b | 147 | 1517 |
All four RabD genes were found to some extent to have lower transcript levels at 14 dpa in the transgenic line compared with the control (Figure3). The RabD1 genes Ta.35418 and Ta.47209 had 49% and 22% reductions in transcript levels, respectively. The expression of RabD2a target gene Ta.54382 and its closest relative gene Ta.54881 showed a 60% and 50% reduction, respectively, compared with the control. At 21 dpa, the transcript levels of RabD2 genes Ta.54382 and Ta.54881 again showed similar reductions in the transgenic line compared with the control line of 58% and 60%, respectively. However, at 21 dpa, whereas Ta.47209 transcript levels were 51% lower in the RNAi line than the control, there was no significant difference in the Ta.35418 transcript levels in the two lines. The transgene clearly had a large effect on expression of RabD genes in the developing endosperm, with RabD2 genes down-regulated by 50%–60% at both 14 and 21 dpa.
Figure 3.

Expression of RabD genes at 14 and 21 days postanthesis in the developing endosperm of T3 wheat. Blue bars: L10.5 (GM), green bars: L24.2 (control). Expression normalized with Ta.54227 gene (cell division control). Error bars indicate standard error. RabD1a = Ta.35418; RabD1b = Ta.47209; RabD2a = Ta.54382; RabD2b = Ta.54881.
Size and shape analysis of transgenic grain
To investigate potential effects of the transgene on grain dimensions and proportions, an analysis of the size and shape of the T2 grain was performed. Using DigiEye apparatus, photographs of grain belonging to 41 lines were taken, including six lines from the L24 bar-only control parent. The photographs were analysed with ImageJ software to give values for area, perimeter, length, width and circularity of each grain image. The number of grains analysed for each line ranged from 76 to 703 but was mostly in the range 150–200. The mean of each of the values was determined for each line. While L05.6 apparently had the highest mean perimeter and width, it had the lowest number of grains analysed (76); therefore, its mean values are the least reliable (Figure S2). The control lines tend towards the mid range in most of the properties, with a slight leaning towards the higher range in area and the lower range in perimeter, and with a wide spread in length. This implies that the transgene has little effect on these grain properties. However, the control lines appeared to have greater circularity than most of the other lines, which would suggest that the transgene reduces grain circularity (i.e. causes a more elongated grain shape).
To determine whether differences seen in the T2 generation were also present between lines of T3 grain, a similar analysis was performed on T3 grain from the selected T2 knock-down line L10.5 and a T2 control line L24.2. The data set for L10.5 was produced through analysis of 1329 grains and that for L24.2 from 984 grains. There is a slightly greater perimeter and smaller area in the grains of the T3 knock-down line compared with the control line (Figure S3). Additionally, the knock-down grains are slightly longer and thinner. These combined small differences result in a significant reduction in circularity of the knock-down line compared with the control. This finding agrees with the results from the previous generation, which further suggests that the changes seen are caused by the transgene.
Protein content of grain
After milling, protein content of the T2 flour was measured to compare the total levels of protein in the 20 selected lines. The mean protein content of the control T2 lines on a dry weight basis was 16.38%, while that of the T2 lines found to contain the transgene was 14.83% (Figure S4). This drop in mean protein content of 1.55% in the transgenic lines was despite the anomalously high protein level of transgenic line L03.11.
There was also a 1.37% reduction in total protein in the T3 transgenic line L10.5 compared with the control line L24.2 (Figure4a). This finding concurs with the differences in protein content of T2 transgenic lines compared with the T2 controls and specifically the difference between T2 lines L10.5 and L24.2, which indicates the difference is a result of the transgene. No significant difference in starch content was found between the T3 knock-down line and control line (Figure4b).
Figure 4.

Protein and starch content of flour from knockdown and control T3 lines as a percentage of dry weight. (a): Protein content of T3 lines on dry weight basis; (b): starch content of T3 lines. The blue bars represent T3 knockdown line L10.5, the green bars represent T3 bar-only control line L24.2. Error bars indicate predicted error of measuring techniques.
SDS-PAGE analysis of mature wheat seed protein
To better understand protein deposition in the transgenic grain, SDS-PAGE experiments were carried out on mature seeds of T0 plants (Figure S5) and the mature seeds of 30 lines selected by PCR and grain weight (Figure S6). Controls used included grain from bar-only and gold-only T0 plants and from a bar-only T1 plant. Densitometry was performed by the Cereals and Milling Department at Campden BRI on 5 of the gels, each comparing 2–3 transgenic lines with control line L24.12 in triplicate. Only very small differences were found between the intensity of the bands in transgenic lines compared with the controls (Figure5). This suggests that the transgene has little, if any, effect on the ratio of different seed storage proteins.
Figure 5.
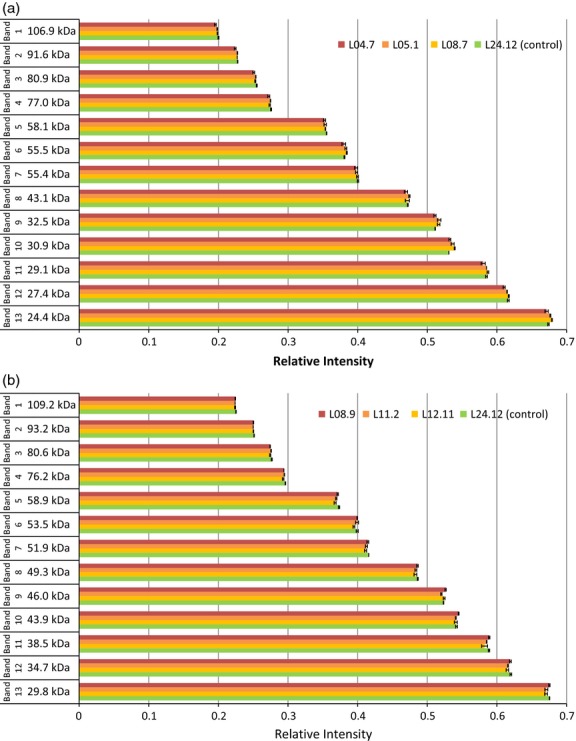
Examples of densitometry analysis of T2 SDS-PAGE. (a) Densitometry analysis of Figure S5f and (b) densitometry analysis of Figure S5g. The molecular weights of 13 bands are indicated on the left in kDa. Error bars indicate standard error.
Dough rheology
The main factor in deciding which homozygous T2 lines to grow on in the next generation was a study of the processing properties of the dough. Twenty lines were chosen to be milled, based on transgene PCR confirmation and grain weight. Milling was carried out in a laboratory scale Quadrumat mill. Coarse semolina and bran particles were subjected to two passes through the milling process. The resulting flour samples were tested for moisture and protein content and mixed into dough using a Reomixer apparatus. The Reomixer produced traces of resistance to mixing over the course of 10 min, measured in arbitrary units of torque from 0 to 10. The important features of the trace are peak torque, dough development time (time at peak torque), breakdown amount/angle (reduction in dough strength after peak torque) and trace width.
The high protein line L25.1 showed a high peak torque of 9 but a thin trace and short development time of 130 s (Figure6a). On the other hand, homozygous T2 lines L10.5, L12.11 and L17.12 had substantially lower peak torques of around 7 but somewhat longer development times (150–190 s; Figure6b–d). Trace width varied between them – L17.12 had the widest trace (similar to the controls) and the trace of the other two lines appeared to gradually narrow after peak torque. The peak torque of the four control lines was in the range 8.1–8.4 and occurred after 195–225 s. Trace width was greater than most of the transgenic lines.
Figure 6.

Six examples of torque traces during mixing of dough made with flour from T2 lines. (a) High protein line L25.1; (b) homozygous line L10.5; (c) homozygous line L12.11; (d) homozygous line L17.12; (e) control line L24.2; (f) control line L24.10. Black line indicates middle of trace, grey lines indicate edges of trace, and blue line indicates trace width. Torque values are relative.
From the traces of the twenty lines, variables were fed into two dough quality indicators—PC1 and PC2, as defined by Anderson (2004). PC1 increases as peak torque and dough development time decrease; therefore, weak biscuit-like flours have a higher PC1 and strong bread-like flours give a lower PC1. PC2 is determined by breakdown—greater breakdown gives a higher PC2 value—so a more stable dough will have a lower PC2. The PC values were calculated for each line and plotted on a quality map (Figure7).
Figure 7.

Quality map of T2 flour reomixer data. Green points: bar-only control lines; orange points: appear hemizygous; blue points: appear homozygous; purple points: method control; red point: appears null segregant; and grey point: zygosity unknown. Ellipses are calculated from a group of coordinates based on genotype (control, hemizygous or homozygous) at ±2.45 standard deviation from the mean. The high protein line L03.11 was not included in the ellipse calculations
Excluding the anomalous high protein line L03.11, transgenic T2 lines had higher PC1 values and lower PC2 values than the controls, and homozygous lines more so than hemizygous lines. A null segregant included in the experiment showed similar PC1 to the controls but somewhat decreased PC2, although only one hemizygous line had a PC2 value between the null segregant and the control lines. These results strongly suggest that presence of the transgene significantly altered the processing properties of the dough.
The small-scale rheology results from the T2 generation showed substantial changes in the processing characteristics of the dough of transgenic lines. To demonstrate the specific changes in gluten quality on a larger scale, farinograph and extensograph tests were carried out on T3 dough. While similar to the Reomixer test performed on T2 flour, the farinograph is a more conventional method of determining dough processing properties.
In the farinograph traces, there are clear differences between the T3 knock-down line L10.5 and the T3 control line L24.2 (Table 4, Figure8). The dough development time (time until peak resistance) was noticeably shorter in the knock-down line and the dough started to break down more quickly after peak resistance. Additionally, the width of the trace in the knock-down line was smaller than in the control throughout the mixing, and the resistance dropped to a lower level compared with the control. The specific measurements made by the farinograph back up these observations. The knock-down line had a 43% reduction in development time, 40% reduction in stability (time during which the top edge of the trace is above the centre of the peak resistance) and 25% increase in degree of softening (difference in resistance between peak resistance and 12 min after peak resistance) compared with the control line.
Table 4.
Farinograph and extensograph results
| Control line L24.2 | Transgenic line L10.5 | |
|---|---|---|
| Farinograph features | ||
| Development time (min)* | 3.5 | 2.0 |
| Stability (min)† | 2.5 | 1.5 |
| Degree of softening (BU)‡ | 200 | 250 |
| Extensograph features | ||
| Resistance (BU)§ | 210 | 120 |
| Extensibility (cm)¶ | 23.5 | 16.0 |
Development time refers to time until peak resistance.
Stability is the time during which the top edge of the farinograph trace is above the centre of the peak resistance.
Degree of softening is the difference in resistance between peak resistance and 12 min after peak resistance in Brabender units (BU).
The extensograph resistance value refers to maximum resistance in Brabender units (BU).
Extensibility refers to the distance stretched before breaking.
Figure 8.

Farinograph traces of dough made with flour from T3 lines. (a) T3 knock-down line L10.5 (development time 2 min, stability 1.5 min, degree of softening 250BU); (b) T3 bar-only control line L24.2 (development time 3.5 min, stability 2.5 min, degree of softening 200BU). The farinograph measures and records the resistance of dough to mixing as it is formed from flour and water, is developed and is broken down.
The extensograph traces and corresponding values show that dough made from the T3 knock-down line was weaker and less extensible than the control line (Table 4, Figure9). This is reflected by the resistance and extensibility figures, which were, respectively, 43% lower and 32% lower in the knock-down line compared with the control.
Figure 9.

Extensograph traces of dough made with flour from T3 lines. (a) T3 knock-down line L10.5 (resistance 120BU, extensibility 16 cm); (b) T3 bar-only control line L24.2 (resistance 210BU, extensibility 23.5 cm). The dough mixed by the farinograph is moulded on the extensograph into a standard shape and rested for 45 min before being stretched to breaking point on the extensograph and a curve drawn recording the extensibility of the dough and its resistance to stretching. The dough is immediately remoulded and, after a further rest period, is re-stretched.
SE-HPLC analysis of gluten macropolymer
As the difference in protein content was relatively small compared with the alteration of dough rheology in the T2 generation and the relative levels of gluten subunits were very similar (as shown by SDS-PAGE results), it was likely that other factors were contributing to the processing properties of the dough. To investigate the characteristics of the large disulphide-linked aggregates formed by polymeric subunits in the glutenin macropolymer that gives dough its elastic properties, a size exclusion high-performance liquid chromatography (SE-HPLC) experiment was carried out using T3 flour. The largest polymeric gluten proteins, high molecular weight glutenin polymers, elute as a peak between 9m and 10m10s (fraction F1); the smaller polymeric gluten proteins, low molecular weight glutenin polymers, elute between 10m11s and 13m40s (fraction F2); the monomeric gliadin proteins elute between 13m41s and 14m45s and between 14m46s and 16m50s (fractions F3 and F4, respectively); and the globulin/albumin fraction elutes between 16m51s and 19m (fraction F5). Two replicates of each T3 line were run untreated (i.e. without sonication) and with sonication during extraction with SDS solution. Sonication conditions were selected to maximize the solubilization of the polymeric proteins, while minimizing the breakdown of the polymers and disruption of the native protein structures within the flour (Morel et al., 2000).
The SE-HPLC profiles of the untreated (not sonicated) samples show that a greater proportion of polymeric high molecular weight glutenin polymer and low molecular weight glutenin polymer proteins, in fractions F1 and F2, respectively, had been extracted in the T3 knock-down line L10.5 compared with the T3 control line L24.2 (Table 5, Figure10a). This suggests that the modified knock-down line featured a gluten macropolymer complex that was easily solubilized and hence was weaker than the control line. Examination of the sonicated samples showed that the relative size distribution of the polymeric proteins within the total extractable gluten protein fraction was different between the knock-down lines and the control lines (Table 5, Figure10b). Here, the knock-down line shows smaller peaks eluting in F1 and between 10m11s and 11m20s in F2 compared with the control line, indicating that it contained a lower proportion of the higher molecular weight polymeric gluten material. The presence of more, smaller low molecular weight glutenin polymer polymeric protein in the knock-down line, eluting between 11m21 and 13m40s in F2, suggests that it had been only weakly bound within the gluten macropolymer matrix, compared with the control line.
Table 5.
SE-HPLC fractions
| Line | Sonicated | SE-HPLC fraction* | ||||||||
|---|---|---|---|---|---|---|---|---|---|---|
| F1 | F2 | F3 | F4 | F5 | F1/F2 | F3+F4/F1 | (F3+F4)/(F1+F2) | AT† | ||
| Transgenic L10.5 | Yes | 11.9 | 23.0 | 8.4 | 41.1 | 15.5 | 0.52 | 4.14 | 1.42 | 31.5 |
| Control L24.2 | Yes | 12.9 | 23.0 | 8.0 | 41.3 | 14.8 | 0.56 | 3.83 | 1.37 | 30.9 |
| Transgenic L10.5 | No | 8.7 | 18.8 | 8.9 | 45.9 | 17.7 | 0.46 | 6.30 | 1.99 | 27.7 |
| Control L24.2 | No | 7.5 | 17.3 | 8.9 | 48.5 | 17.7 | 0.43 | 7.67 | 2.31 | 25.8 |
F1–F5 values represent the area under the curve for each of the fractions defined by the Profilblé method that were separated by SE-HPLC. These fractions relate to different protein subunits extracted from the gluten macropolymer.
Calculations of the fractions and the total area under the curve (AT) are also presented.
Figure 10.

SE-HPLC traces of protein from T3 flour samples. (a) Untreated flour sample; (b) sonicated flour sample. The two replicates of T3 line L10.5 are in light and dark blue, and the two replicates of T3 bar-only control line L24.2 are in light and dark green. Proteins with a higher molecular weight migrate through the column faster and are on the left of the plot while smaller proteins take longer to migrate through the column and are on the right. The purpose of the sonication was to promote solubilization of the glutenin macropolymer. Proteins present in the untreated samples consist of monomers, oligomers and glutenin subunits, which were only weakly bound to the glutenin macropolymer. The sonicated samples should contain the same proteins as the equivalent untreated samples plus glutenin subunits that have been released from the macropolymer.
Discussion
Transcript levels of all four wheat RabD genes studied were reduced in the transgenic line at 14 dpa, and all but Ta.35418 (RabD1) were knocked down at 21 dpa. The transgenic effect is a result of a pHMW-Adh-Nos RNAi vector containing a 270-bp sequence taken from a single Rab gene, Ta.54382 (RabD2a) with a 21nt match with Ta.54881 (RabD2b). A recent study by Wang et al. (2012) found that overexpression of a YFP-associated mutant RabD2b gene in Arabidopsis led to co-suppression of the native RabD2b gene along with down-regulation of RabD1 and RabD2c genes, although RabD2a appeared unaffected. A similar down-regulation mechanism might help account for the expression pattern seen in the developing T3 seeds, where aside from the target gene, three other genes of the same subfamily showed reduced transcript levels. Alternatively, the fact that this strategy appeared to affect a number of similar genes regardless of whether or not there was a perfect 21nt match between them could be due to cleavage of mRNA molecules with sequences that are highly conserved with the siRNA incorporated into RISC, in addition to those that are fully identical as suggested by a number of recent studies (Birmingham et al., 2006; Fedorov et al., 2006; Haley and Zamore, 2004; Sigoillot et al., 2012).
A potential reference gene included in the qRT-PCR experiment, Ta.2291 (Arf2), which had previously been described as a suitable reference gene for qPCR in wheat (Paolacci et al., 2009), seemed to be unsuitable as a reference gene and in fact appeared to be significantly up-regulated in the transgenic line compared with the control at both 14 dpa and 21 dpa. This is an interesting result as Arf (ADP ribosylation factor) proteins are small GTPases involved in vesicle trafficking and are part of the same Ras superfamily as Rab GTPases (Wennerberg et al., 2005). It would appear that reduced RabD levels affected some equilibrium or feedback mechanism in the vesicle transport system, leading to increased expression of at least one Arf gene, perhaps to compensate for reduced ER-to-Golgi vesicle traffic.
The T3 rheology results clearly indicate a reduction in dough strength and extensibility in the knock-down line compared with the control. It is likely that altered intermolecular bonding in the glutenin macropolymer contributed to this effect, combined with a drop in total protein content. As it has been confirmed that the RabD genes are knocked down in the developing endosperm in the T3 transgenic line relative to the control line, it is reasonable to conclude that the expression of one or more of these genes is instrumental in gluten quality.
The SE-HPLC findings provide evidence that the RabD knock-down transgene has markedly affected interactions or bonding between glutenin subunits in the gluten macropolymer of dough. Bonding strength appears most reduced in high molecular weight glutenin polymer and some of the larger low molecular weight glutenin polymers. As these subunits are probably the most important in giving gluten its elastic properties (Anjum et al., 2007), the transgenic dough would be expected to have weaker gluten strength when processed. This correlates with the results of the rheology experiments, in which the knock-down lines exhibited considerable reductions in gluten strength and extensibility compared with controls. These changes are within the range of quality criteria for commercial cultivars. The reduction in gluten strength represents a transformation from bread processing suitability to characteristics which are more similar to biscuit processing suitability. However, the reduction in extensibility is likely to limit the suitability of this sample to specialist products other than bread or biscuit processing.
A number of studies on glycosylation of gluten proteins have yielded results indicating that a significant proportion of wheat storage proteins are glycosylated (Gujska and Khan, 1999; Lauriere et al., 1996; Tilley, 1997; Tilley et al., 1993). One study found that gliadins and glutenins were both glycosylated, and aggregated LMW-GS showed N-glycans with xylose, thought to indicate processing in the Golgi (Lauriere et al., 1996). Meanwhile, many other studies describe finding little or no glycosylation of HMW-GS and α-gliadins using mostly mass spectrometric approaches such as GC-MS, RP-HPLC/ESI-MS and MALDI-TOF-MS (Bollecker et al., 1998; Cunsolo et al., 2002, 2003, 2004; Foti et al., 2000; Roels and Delcour, 1996; Turner et al., 2002; Zhang et al., 2008). Additionally, some of these studies also discovered false-positive results when using other techniques including periodate-digoxigenin glycan detection assay and acid PAGE (Bollecker et al., 1998; Roels and Delcour, 1996). While evidence has built up that HMW-GS are probably not commonly glycosylated, LMW-GS and gliadins are less well studied, and there is still uncertainty whether they undergo glycosylation or not (Li et al., 2008). If any LMW-GS or gliadins are glycosylated, then it is likely that reducing ER-to-Golgi vesicle traffic would have a profound effect on this process. It is possible that a change in prolamin glycosylation could be at least partly responsible for differences seen in the transgenic wheat grain, although it is unclear whether or not this is the case.
SE-HPLC and rheology results show a tangible difference in dough quality between the transgenic and control lines. However, SDS-PAGE results suggest that the relative proportions of the different gluten subunits have not been affected. A significant contributing factor to this may be the likelihood that fewer gluten proteins in the transgenic lines than in the control lines go through important post-translational modifications that occur in the Golgi, due to inhibited ER-to-Golgi trafficking. It is likely that post-translational modifications have occurred in the Golgi that affect bonding ability of gluten proteins. These modifications could be in the form of disulphide bonding, hydrogen bonding, glycosylation or folding into a structure able to produce the loop and chain arrangement thought to give gluten its elasticity in dough (Belton, 1999). Protein disulphide isomerase (PDI) is located in the ER and protein bodies, and although this glycoprotein is thought to catalyse intermolecular covalent bonding between glutenin subunits, it is not known whether it has a role in folding of the subunits (Shimoni et al., 1995).
There is a general consensus that wheat prolamins are transported to the protein storage vacuole by two different pathways: Golgi dependent and Golgi independent (Tosi, 2012). However, there is disagreement as to whether or not different prolamins are transported through the two routes differentially, and if so, what causes the difference (Levanony et al., 1992; Loussert et al., 2008; Rubin et al., 1992; Tosi et al., 2009). Based on SE-HPLC results of this study, the reduction of RabD expression in wheat endosperm appears to reduce the bonding ability of HMW-GS and larger LMW-GS while smaller LMW-GS are less affected. This may point towards different glutenin subunits favouring different trafficking routes or alternatively that smaller glutenins are not as dependent on processing in the Golgi to retain their ability to bond in the glutenin macropolymer. However, if there is a difference in the ratio of proteins trafficked via the Golgi compared with ER aggregation, it is not apparent in the SDS-PAGE results, which do not show any differences in subunit proportions present in the mature seed between the knock-down and control lines. It is possible that proteins blocked by one route could, subsequently, be trafficked by the other route.
The knowledge gained from this study regarding the sequence and function of Rab GTPases in the endosperm of hexaploid wheat could be further exploited to better understand, and possibly improve, the technological properties of flour. Based on the results of this work, it would appear that RabD expression is linked to dough processing quality in bread wheat, at least in that gluten quality appears reduced when RabD expression is reduced. Conversely, it may therefore be inferred that an increased level of RabD expression might improve gluten quality. However, overexpression of native RabD genes has met with a lack of phenotype in studies on durum wheat and Arabidopsis (Di Luccia et al., 2005; Wang et al., 2012). When no phenotype was found in transgenic Arabidopsis overexpressing RAC/ROP small GTPases, the authors of the study suggested that interactors including GAPs and GDIs could be responsible for keeping GTPase activity stable despite a greater quantity of protein present (Brembu et al., 2005). It is reasonable to conclude that the wide range of Rab interaction partners could prove problematic to direct efforts to up-regulate vesicle trafficking from ER to Golgi by genetic modification.
Most attempts to alter breadmaking quality in bread wheat using biotechnology have targeted the gluten proteins themselves, particularly the HMW glutenin subunits. This study represents a novel approach to this area of work by altering the transport of these important proteins in the endosperm. The resulting effects on grain shape, protein content, bonding in the glutenin macropolymer and dough rheology reported here expand the understanding of factors that contribute towards gluten quality in bread wheat and could be of interest to breeders looking for loci-controlling quality.
Experimental procedures
Laboratory chemicals and reagents
Chemicals and reagents were supplied by Fisher Scientific (Fisher Scientific UK Ltd, Loughborough, UK) or Sigma-Aldrich (Sigma-Aldrich Corporation, St. Louis, MO) unless otherwise stated.
Primers and DNA
Primers were obtained from Eurofins MWG Operon (Ebersberg, Germany). The dNTPs used in PCR were obtained from Promega (Promega UK Ltd, Southampton, UK). Primers and dNTPs were diluted as in the manufacturer's instructions and stored at −20 °C.
Polymerase chain reaction (PCR)
PCR was originally described by Saiki et al. (1988). PCRs were performed using an Eppendorf Mastercycler PCR machine. Each reaction tube contained a total reaction mixture of 20 μL composed of 12.8 μL H2O, 2 μL 10× PCR buffer, 0.6 μL 50 mm MgCl2, 1.6 μL 2.5 mm dNTPs, 0.4 μL forwards primer, 0.4 μL reverse primer, 2 μL DNA template and 0.2 μL Taq polymerase. PCR buffer and MgCl2 solutions were supplied by Bioline (Bioline Reagents Ltd., London, UK). Unless otherwise stated, the DNA template used in PCR was from a sample of wheat DNA extracted from leaf tissue of Cadenza variety wheat. The general PCR programme used was 94 °C for 5 min, followed by a denaturing, annealing and amplification cycle (repeated 35 times) of 94, 60 (for nongradient PCR) and 72 °C. Once complete, this repeated cycle was followed by 72 °C for 10 min prior to removal of tubes from machine and storage at 4 °C.
Agarose gel
Electrophoresis gels were 2% molecular biology grade agarose (Bio-Rad Laboratories Inc., Hercules, CA), made up with 0.5× TBE buffer (45 mm Tris base, 45 mm boric acid, 1 mm EDTA). 0.01% v/v 10 mg/mL ethidium bromide was mixed into the buffer once the agarose had been dissolved by heating in a microwave oven and the liquid had begun to cool. Gels were left to solidify in a microgel former with appropriate combs before being placed in a microgel bath and submerged in 0.5× TBE buffer. Next, 2 μL of loading buffer (0.25% w/v xylene cyanol, 0.25% w/v bromophenol blue, 30% v/v glycerol) was added to 10 μL of PCR product in each of the experiment wells (mixed before loading), and 5 μL of DNA ladder was added to each marker well. Once PCR products and marker had been loaded, gels were run at 10 V/cm and then photographed under ultraviolet light.
Plasmid miniprep
Plasmid was recovered from transformed Escherichia coli culture using a Fermentas GeneJET™ plasmid miniprep kit (Fermentas GmbH, St. Leon-Rot, Germany) following the manufacturer's instructions.
E. coli transformation and culture
Competent DH5-α E. coli cells were transformed with pHMW-Adh-Nos vector using the method described by Sambrook et al. (1989).
Spectrophotometric analysis of nucleic acids
A NanoDrop 1000 machine (NanoDrop products, Wilmington, DE) was used to quantify DNA and RNA samples using the manufacturer's instructions.
DNA sequencing
DNA samples were sequenced by Eurofins MWG Operon. DNA samples were prepared for sequencing by following the instructions provided.
Total RNA extraction from developing wheat endosperm
Total RNA was extracted from wheat endosperm tissue using the method described by Chang et al. (1993).
cDNA synthesis using random hexamer primers
Random hexamer primers were used to synthesize cDNA from total RNA using the method described by Parr et al. (1992). Random hexamer primers, RT enzyme, buffer, RNasin RNase inhibitor and dNTPs were supplied by Promega.
Quantitative reverse transcriptase polymerase chain reaction (qRT-PCR)
Real-time quantitative PCR was first described by Heid et al. (1996). qPCR was carried out using 384-well plates in a Roche LightCycler 480 qPCR machine. SYBR Green I master mix was used, and manufacturer's instructions followed for plate preparation. Programme was 95 °C for 5 min; 45 cycles of 95 °C for 10 s, 60 °C for 15 s and 72 °C for 15 s; 95 °C for 5 s, 65 °C for 1 min, slow ramp to 97 and 40 °C for 10 s.
Phenetic analysis
Phenetic analyses were carried out using Rab coding sequence (CDS) data that had been obtained by BLAST or string searches of the NCBI nucleotide and EST databases, as well as Rab protein sequences that had been obtained by following links from corresponding entries in the NCBI nucleotide database or by translating from a CDS that had been assembled from ESTs. The plant species included were Arabidopsis thaliana, Oryza sativa, Brachypodium distachyon, Triticum aestivum and Nicotiana tabacum. Alignments and phenetic tree files for rectangular trees were generated using MAFFT version 6 online (Katoh and Toh, 2010). Alignments and phenograms for circular trees were produced in MEGA 5 (Tamura et al., 2011). All trees were neighbour-joining with 1000 bootstrap replicates, shown on branches as percentage confidence values (Felsenstein, 1985; Saitou and Nei, 1987). Branches corresponding to partitions reproduced in <50% bootstrap replicates were collapsed. The trees were drawn to scale, with branch lengths in the same units as those of the evolutionary distances used to infer the phenetic tree. The evolutionary distances were computed using the Poisson correction method and are in the units of the number of amino acid substitutions per site.
Cloning of RNAi construct
Bovine serum albumin, calf intestinal alkaline phosphatase, T4 DNA ligase enzyme and BamHI and BglII restriction enzymes were acquired from Promega. A 270-bp section of the CDS of wheat RabD2a gene Ta.54382 was obtained by PCR using primers with BamHI and BglII restriction sites added to their 5′ ends (Table 3, Figure S7). The PCR product was purified and cloned into the vector pHMW-Adh-Nos (Nemeth et al., 2010; Figure S1). Digestion and ligation of insert and vector were performed using the supplier's instructions. Negative controls used were no enzyme digest (for both insert and vector digests), no enzyme ligation, no vector ligation and no insert ligation. Competent DH5-α E. coli cells were used for transformation. E. coli cells were grown in LB+ampicillin medium (Per plate: 10 mL sterile LB medium mixed with 10 μL 100 mg/mL ampicillin).
Table 3.
Primers designed to anneal to the target sequence in PCR
| Primer name | Sequence 5′-3′ |
|---|---|
| −site primer F | GTTGGCAAGTCATGCCTTC |
| −site primer R | GCGATCAATCTCGTTCAACC |
| +site primer F | CTTAA GGATCC GTTGGCAAGTCATGC |
| +site primer R | GGCCA AGATCT GCGATCAATCTCGTT |
The parts of the +site primers that match the gene (underlined) are preceded by a restriction site (bold), plus extra nucleotides to ensure efficient restriction (italics). +site primer F contains a BamHI site, and +site primer R contains a BglII site.
Wheat transformation and plant growth conditions
Biolistic transformation of wheat (Triticum aestivum var. Cadenza) embryos and regeneration of T0 plants were carried out as in Jones and Sparks (2009). Transgenic lines and control plants were grown in the same glasshouse compartments, which were certified for contained-use GMOs. For production of plants, T0 seedlings or seeds were potted in soil and grown in the glasshouse with 18–20 °C day and 14–16 °C night temperatures with a 16-h photoperiod provided by natural light supplemented with banks of Son-T 400 W sodium lamps (Osram Limited, Langley, UK) giving 400–1,000 μmol/m2/s PAR. Soil composition contained 75% fine-grade peat, 12% screened sterilized loam, 10% 6-mm screened lime-free grit, 3% medium vermiculite, 2 kg osmocote plus/m3 (slow-release fertilizer, 15N/11P/13K plus micronutrients) and 0.5 kg PG mix/m3 (14N/16P/18K granular fertilizer plus micronutrients; Petersfield Products, Leicestershire, UK).
Sodium dodecyl sulphate polyacrylamide gel electrophoresis (SDS-PAGE) of T2 seeds
Three mature seeds from each line to be tested were placed in separate folded pieces of paper and crushed using a pestle. One line per gel was a control line. A 10 mg sample from each crushed seed was weighed out into a 1.5-mL microcentrifuge tube, and a modified version of the gel manufacturer's instructions was followed. Gels were preformed 15-well Bis-Tris 10% acrylamide gels (Invitrogen, Life Technologies Ltd, Paisley, UK), buffer was MOPS SDS running buffer (Invitrogen), gel equipment was a mini dual vertical electrophoresis system (Sigma-Aldrich), and stain was colloidal Coomassie blue stain (Sigma-Aldrich). Phoretix 1D software by Totallab was used for densitometry analysis at Campden BRI.
Grain size and shape analysis
Mature wheat grains were analysed for grain size and shape using DigiEye apparatus (VeriVide Limited, Enderby, Leicester, LE19 4SG, UK).
Measurement of flour protein content
Protein content was determined by Dumas combustion in an oxygen-rich environment at high temperatures. Protein is calculated using a factor of 5.7 from total nitrogen determination. Combustion was carried out in a Leco FP528 at Campden BRI.
Size exclusion high-performance light chromatography (SE-HPLC)
SE-HPLC was carried out on flour samples using the Profilblé method developed jointly by ARVALIS—Institut du vegetal (France) and l'Institut National de la Recherche Agronomique (INRA; Morel et al., 2000).
Dough rheology
Brabender farinograph, extensograph and Reomixer tests were carried out using the manufacturer's instructions. Reomixer traces were converted to PCA components according to the method of Anderson (2004). This uses equations determined at Campden BRI. The smoothed standard-dough traces are converted into two numbers (principal component scores) that are used to plot the position on a quality map, which summarizes the trace characteristics of varying dough development, peak time, peak height and differing breakdown.
Acknowledgments
We thank Fiona Gilzean, Anthony Griffin, Melloney St Leger, Amanda Riley, Caroline Sparks, Linda Staniforth, Ruth Cornock, Doug Smith, Leigh Wyatt and members of the Cereals and Milling Department at Campden BRI for expert technical assistance. We also thank Csilla Nemeth for permission to use her drawing of the pHMW-Adh-Nos vector. A. M. Tyler was funded by the Biotechnology and Biological Sciences Research Council (UK) and Campden BRI Ltd. through BBSRC Industrial CASE Partnership Studentship no. BB/G529191/1. Rothamsted Research receives strategic funding from BBSRC. All authors contributed to and agreed on the manuscript.
Supporting information
Additional Supporting information may be found in the online version of this article:
Figure S1 Vector map of pHMW-Adh-Nos (Nemeth et al., 2010).
Figure S2 Size and shape analysis of grain from T2 lines.
Figure S3 Mean size and shape values of grain from T3 lines from a 2D perspective.
Figure S4 Protein content of flour from 20 shortlisted T2 lines as a percentage of dry weight.
Figure S5 SDS-PAGE of mature T1 seeds.
Figure S6 SDS-PAGE of mature T2 seeds.
Figure S7 The Ta.54382 (wheat RabD2a) coding sequence showing selected target region
References
- Anderson C. 2004. Characterising wheat flour protein quality from reomixer traces. HGCA project report 324. http://www.hgca.com/cms_publications.output/2/2/Publications/Finalprojectreports/CharacterisingWheatFlourProteinQualityfromREOMIXERTraces.mspx?fn=show&pubcon=315.
- Anjum FM, Khan MR, Din A, Saeed M, Pasha I, Arshad MU. Wheat gluten: high molecular weight glutenin subunits – structure, genetics, and relation to dough elasticity. J. Food Sci. 2007;72:R56–R63. doi: 10.1111/j.1750-3841.2007.00292.x. [DOI] [PubMed] [Google Scholar]
- Batoko H, Zheng HQ, Hawes C, Moore I. A Rab1 GTPase is required for transport between the endoplasmic reticulum and Golgi apparatus and for normal Golgi movement in plants. Plant Cell. 2000;12:2201–2217. doi: 10.1105/tpc.12.11.2201. [DOI] [PMC free article] [PubMed] [Google Scholar]
- Belton PS. On the elasticity of wheat gluten. J. Cereal Sci. 1999;29:103–107. [Google Scholar]
- Birmingham A, Anderson EM, Reynolds A, Ilsley-Tyree D, Leake D, Fedorov Y, Baskerville S, Maksimova E, Robinson K, Karpilow J, Marshall WS, Khvorova A. 3′ UTR seed matches, but not overall identity, are associated with RNAi off-targets. Nat. Methods. 2006;3:199–204. doi: 10.1038/nmeth854. [DOI] [PubMed] [Google Scholar]
- Bollecker SSJ, Kaiser KP, Kohler P, Wieser H, Schofield JD. Re-examination of the glycosylation of high Mr subunits of wheat glutenin. J. Agric. Food Chem. 1998;46:4814–4823. [Google Scholar]
- Brembu T, Winge P, Bones AM. The small GTPase AtRAC2/ROP7 is specifically expressed during late stages of xylem differentiation in Arabidopsis. J. Exp. Bot. 2005;56:2465–2476. doi: 10.1093/jxb/eri239. [DOI] [PubMed] [Google Scholar]
- Chang S, Puryear J, Cairney J. A simple and efficient method for isolating RNA from pine trees. Plant Mol. Biol. Rep. 1993;11:113–116. [Google Scholar]
- Cheung AY, Chen CYH, Glaven RH, de Graaf BHJ, Vidali L, Hepler PK, Wu HM. Rab2 GTPase regulates vesicle trafficking between the endoplasmic reticulum and the Golgi bodies and is important to pollen tube growth. Plant Cell. 2002;14:945–962. doi: 10.1105/tpc.000836. [DOI] [PMC free article] [PubMed] [Google Scholar]
- Cunsolo V, Foti S, Saletti R, Gilbert S, Tatham AS, Shewry PR. Investigation and correction of the gene-derived sequence of glutenin subunit 1Dx2 by matrix-assisted laser desorption/ionisation mass spectrometry. Rapid Commun. Mass Spectrom. 2002;16:1911–1918. doi: 10.1002/rcm.807. [DOI] [PubMed] [Google Scholar]
- Cunsolo V, Foti S, Saletti R, Gilbert S, Tatham AS, Shewry PR. Structural studies of glutenin subunits 1Dy10 and 1Dy12 by matrix-assisted laser desorption/ionisation mass spectrometry and high-performance liquid chromatography/electrospray ionisation mass spectrometry. Rapid Commun. Mass Spectrom. 2003;17:442–454. doi: 10.1002/rcm.938. [DOI] [PubMed] [Google Scholar]
- Cunsolo V, Foti S, Saletti R, Gilbert S, Tatham AS, Shewry PR. Structural studies of the allelic wheat glutenin subunits 1Bx7 and 1Bx20 by matrix-assisted laser desorption/ionization mass spectrometry and high-performance liquid chromatography/electrospray ionization mass spectrometry. J. Mass Spectrom. 2004;39:66–78. doi: 10.1002/jms.558. [DOI] [PubMed] [Google Scholar]
- Di Luccia A, Lamacchia C, Fares C, Padalin L, Mamone G, La Gatta B, Gambacorta G, Faccia M, Di Fonzo N, La Notte E. A proteomic approach to study protein variation in GM durum wheat in relation to technological properties of semolina. Ann. Chim. 2005;95:405–414. doi: 10.1002/adic.200590047. [DOI] [PubMed] [Google Scholar]
- Fedorov Y, Anderson EM, Birmingham A, Reynolds A, Karpilow J, Robinson K, Leake D, Marshall WS, Khvorova A. Off-target effects by siRNA can induce toxic phenotype. RNA. 2006;12:1188–1196. doi: 10.1261/rna.28106. [DOI] [PMC free article] [PubMed] [Google Scholar]
- Felsenstein J. Confidence-limits on phylogenies – an approach using the bootstrap. Evolution. 1985;39:783–791. doi: 10.1111/j.1558-5646.1985.tb00420.x. [DOI] [PubMed] [Google Scholar]
- Foti S, Maccarrone G, Saletti R, Roepstorff P, Gilbert S, Tatham AS, Shewry PR. Verification of the cDNA deduced sequence of glutenin subunit 1Dx5 and an M-r 58 000 repetitive peptide by matrix-assisted laser desorption/ionisation mass spectrometry (MALDI-MS) J. Cereal Sci. 2000;31:173–183. [Google Scholar]
- Gujska E, Khan K. Characterization of the carbohydrates of nonreduced glutenin fractionated by multistacking SDS-PAGE from two hard red spring wheat flours. Cereal Chem. 1999;76:198–203. [Google Scholar]
- Haley B, Zamore PD. Kinetic analysis of the RNAi enzyme complex. Nat. Struct. Mol. Biol. 2004;11:599–606. doi: 10.1038/nsmb780. [DOI] [PubMed] [Google Scholar]
- Heid CA, Stevens J, Livak KJ, Williams PM. Real time quantitative PCR. Genome Res. 1996;6:986–994. doi: 10.1101/gr.6.10.986. [DOI] [PubMed] [Google Scholar]
- Jones HD, Sparks CA. Transgenic wheat, barley and oats: production and characterization. In: Jones HD, Shewry PR, editors. Methods in Molecular Biology. Totowa, NJ: Humana Press Inc; 2009. pp. 71–92. [DOI] [PubMed] [Google Scholar]
- Katoh K, Toh H. Parallelization of the MAFFT multiple sequence alignment program. Bioinformatics. 2010;26:1899–1900. doi: 10.1093/bioinformatics/btq224. [DOI] [PMC free article] [PubMed] [Google Scholar]
- Kreis M, Forde BG, Rahman S, Miflin BJ, Shewry PR. Molecular evolution of the seed storage proteins of barley, rye and wheat. J. Mol. Biol. 1985;183:499–502. doi: 10.1016/0022-2836(85)90017-8. [DOI] [PubMed] [Google Scholar]
- Lauriere M, Bouchez I, Doyen C, Eynard L. Identification of glycosylated forms of wheat storage proteins using two-dimensional electrophoresis and blotting. Electrophoresis. 1996;17:497–501. doi: 10.1002/elps.1150170312. [DOI] [PubMed] [Google Scholar]
- Leon E, Marin S, Gimenez MJ, Piston F, Rodriguez-Quijano M, Shewry PR, Barro F. Mixing properties and dough functionality of transgenic lines of a commercial wheat cultivar expressing the 1Ax1, 1Dx5 and 1Dy10 HMW glutenin subunit genes. J. Cereal Sci. 2009;49:148–156. [Google Scholar]
- Leon E, Piston F, Aouni R, Shewry PR, Rosell CM, Martin A, Barro F. Pasting properties of transgenic lines of a commercial bread wheat expressing combinations of HMW glutenin subunit genes. J. Cereal Sci. 2010;51:344–349. [Google Scholar]
- Levanony H, Rubin R, Altschuler Y, Galili G. Evidence for a novel route of wheat storage proteins to vacuoles. J. Cell Biol. 1992;119:1117–1128. doi: 10.1083/jcb.119.5.1117. [DOI] [PMC free article] [PubMed] [Google Scholar]
- Li XH, Wang AL, Xiao YH, Yan YM, He ZH, Appels R, Ma WJ, Hsam SLK, Zeller FJ. Cloning and characterization of a novel low molecular weight glutenin subunit gene at the Glu-A3 locus from wild emmer wheat (Triticum turgidum L. var. dicoccoides) Euphytica. 2008;159:181–190. [Google Scholar]
- Loussert C, Popineau Y, Mangavel C. Protein bodies ontogeny and localization of prolamin components in the developing endosperm of wheat caryopses. J. Cereal Sci. 2008;47:445–456. [Google Scholar]
- Lunn D, Gaddipati SR, Tucker GA, Lycett GW. Null mutants of individual RABA genes impact the proportion of different cell wall components in stem tissue of Arabidopsis thaliana. PLoS ONE. 2013;8:e75724. doi: 10.1371/journal.pone.0075724. [DOI] [PMC free article] [PubMed] [Google Scholar]
- Lycett G. The role of Rab GTPases in cell wall metabolism. J. Exp. Bot. 2008;59:4061–4074. doi: 10.1093/jxb/ern255. [DOI] [PubMed] [Google Scholar]
- Morel MH, Dehlon P, Autran JC, Leygue JP, Bar-L'Helgouac'h C. Effects of temperature, sonication time, and power settings on size distribution and extractability of total wheat flour proteins as determined by size-exclusion high-performance liquid chromatography. Cereal Chem. 2000;77:685–691. [Google Scholar]
- Nemeth C, Freeman J, Jones HD, Sparks C, Pellny TK, Wilkinson MD, Dunwell J, Anderson AAM, Åman P, Guillon F, Saulnier L, Mitchell RAC, Shewry PR. Down-regulation of the CSLF6 gene results in decreased (1,3;1,4)-beta-d-glucan in endosperm of wheat. Plant Physiol. 2010;152:1209–1218. doi: 10.1104/pp.109.151712. [DOI] [PMC free article] [PubMed] [Google Scholar]
- Paolacci AR, Tanzarella OA, Porceddu E, Ciaffi M. Identification and validation of reference genes for quantitative RT-PCR normalization in wheat. BMC Mol. Biol. 2009;10:11. doi: 10.1186/1471-2199-10-11. [DOI] [PMC free article] [PubMed] [Google Scholar]
- Park M, Kim SJ, Vitale A, Hwang I. Identification of the protein storage vacuole and protein targeting to the vacuole in leaf cells of three plant species. Plant Physiol. 2004;134:625–639. doi: 10.1104/pp.103.030635. [DOI] [PMC free article] [PubMed] [Google Scholar]
- Parr T, Bardsley RG, Gilmour RS, Buttery PJ. Changes in calpain and calpastatin messenger-RNA induced by beta-adrenergic stimulation of bovine skeletal-muscle. Eur. J. Biochem. 1992;208:333–339. doi: 10.1111/j.1432-1033.1992.tb17191.x. [DOI] [PubMed] [Google Scholar]
- Pereira-Leal JB, Seabra MC. Evolution of the Rab family of small GTP-binding proteins. J. Mol. Biol. 2001;313:889–901. doi: 10.1006/jmbi.2001.5072. [DOI] [PubMed] [Google Scholar]
- Rakszegi M, Pastori G, Jones HD, Bekes F, Butow B, Lang L, Bedo Z, Shewry PR. Technological quality of field grown transgenic lines of commercial wheat cultivars expressing the 1Ax1 HMW glutenin subunit gene. J. Cereal Sci. 2008;47:310–321. [Google Scholar]
- Roels SP, Delcour JA. Evidence for the non-glycoprotein nature of high molecular weight glutenin subunits of wheat. J. Cereal Sci. 1996;24:227–239. [Google Scholar]
- Rubin R, Levanony H, Galili G. Evidence for the presence of 2 different types of protein bodies in wheat endosperm. Plant Physiol. 1992;99:718–724. doi: 10.1104/pp.99.2.718. [DOI] [PMC free article] [PubMed] [Google Scholar]
- Rutherford S, Moore I. The Arabidopsis Rab GTPase family: another enigma variation. Curr. Opin. Plant Biol. 2002;5:518–528. doi: 10.1016/s1369-5266(02)00307-2. [DOI] [PubMed] [Google Scholar]
- Saiki RK, Gelfand DH, Stoffel S, Scharf SJ, Higuchi R, Horn GT, Mullis KB, Erlich HA. Primer-directed enzymatic amplification of DNA with a thermostable DNA-polymerase. Science. 1988;239:487–491. doi: 10.1126/science.2448875. [DOI] [PubMed] [Google Scholar]
- Saitou N, Nei M. The Neighbor-Joining method - a new method for reconstructing phylogenetic trees. Mol. Biol. Evol. 1987;4:406–425. doi: 10.1093/oxfordjournals.molbev.a040454. [DOI] [PubMed] [Google Scholar]
- Sambrook J, Fritsch EF, Maniatis T. Transformation of plasmids/cosmids into E. coli. In: Sambrook J, Fritsch EF, Maniatis T, editors. Molecular Cloning: A Laboratory Manual. Long Island, NY: Cold Spring Harbor Laboratory Press; 1989. p. 74. [Google Scholar]
- Shewry PR, Tatham AS, Barro F, Barcelo P, Lazzeri P. Biotechnology of breadmaking – unraveling and manipulating the multi-protein gluten complex. Bio-Technology. 1995;13:1185–1190. doi: 10.1038/nbt1195-1185. [DOI] [PubMed] [Google Scholar]
- Shimoni Y, Zhu XZ, Levanony H, Segal G, Galili G. Purification, characterization, and intracellular-localization of glycosylated protein disulfide-isomerase from wheat grains. Plant Physiol. 1995;108:327–335. doi: 10.1104/pp.108.1.327. [DOI] [PMC free article] [PubMed] [Google Scholar]
- Sigoillot FD, Lyman S, Huckins JF, Adamson B, Chung E, Quattrochi B, King RW. A bioinformatics method identifies prominent off-targeted transcripts in RNAi screens. Nat. Methods. 2012;9:363–U366. doi: 10.1038/nmeth.1898. [DOI] [PMC free article] [PubMed] [Google Scholar]
- Tamura K, Peterson D, Peterson N, Stecher G, Nei M, Kumar S. MEGA5: molecular evolutionary genetics analysis using maximum likelihood, evolutionary distance, and maximum parsimony methods. Mol. Biol. Evol. 2011;28:2731–2739. doi: 10.1093/molbev/msr121. [DOI] [PMC free article] [PubMed] [Google Scholar]
- Tatham AS, Drake AF, Shewry PR. Conformational studies of synthetic peptides corresponding to the repetitive regions of the high-molecular-weight (HMW) glutenin subunits of wheat. J. Cereal Sci. 1990;11:189–200. [Google Scholar]
- Tilley KA. Detection of O-glycosidically linked mannose within the structure of a highly purified glutenin subunit isolated from Chinese Spring wheat. Cereal Chem. 1997;74:371–374. [Google Scholar]
- Tilley KA, Lookhart GL, Hoseney RC, Mawhinney TP. Evidence for glycosylation of the high-molecular-weight glutenin subunit-2, subunit-7, subunit-8, and subunit-12 from chinese spring and tam-105 wheats. Cereal Chem. 1993;70:602–606. [Google Scholar]
- Tosi P. Trafficking and deposition of prolamins in wheat. J. Cereal Sci. 2012;56:81–90. [Google Scholar]
- Tosi P, Parker M, Gritsch CS, Carzaniga R, Martin B, Shewry PR. Trafficking of storage proteins in developing grain of wheat. J. Exp. Bot. 2009;60:979–991. doi: 10.1093/jxb/ern346. [DOI] [PMC free article] [PubMed] [Google Scholar]
- Turner JB, Garner GV, Gordon DB, Brookes SJ, Smith CA. Are alpha-gliadins glycosylated? Protein Pept. Lett. 2002;9:23–29. doi: 10.2174/0929866023408995. [DOI] [PubMed] [Google Scholar]
- Wang F, Liu C, Wei C, Cui YH, Zheng Q, Zhang JM, Wu JS, Liu KD. AtRabD2b, a functional ortholog of the yeast Ypt1, controls various growth and developmental processes in Arabidopsis. Plant Mol. Biol. Rep. 2012;30:275–285. [Google Scholar]
- Wennerberg K, Rossman KL, Der CJ. The Ras superfamily at a glance. J. Cell Sci. 2005;118:843–846. doi: 10.1242/jcs.01660. [DOI] [PubMed] [Google Scholar]
- Woychik JH, Dimler RJ, Boundy JA. Starch gel electrophoresis of wheat gluten proteins with concentrated urea. Arch. Biochem. Biophys. 1961;94:477. doi: 10.1016/0003-9861(61)90075-3. [DOI] [PubMed] [Google Scholar]
- Zhang Q, Dong YM, An XL, Wang AL, Zhang YZ, Li XH, Gao LY, Xia XC, He ZH, Yan YM. Characterization of HMW glutenin subunits in common wheat and related species by matrix-assisted laser desorption/ionization time-of-flight mass spectrometry (MALDI-TOF-MS) J. Cereal Sci. 2008;47:252–261. [Google Scholar]
- Zheng HQ, Camacho L, Wee E, Henri BA, Legen J, Leaver CJ, Malho R, Hussey PJ, Moore I. A Rab-E GTPase mutant acts downstream of the Rab-D subclass in biosynthetic membrane traffic to the plasma membrane in tobacco leaf epidermis. Plant Cell. 2005;17:2020–2036. doi: 10.1105/tpc.105.031112. [DOI] [PMC free article] [PubMed] [Google Scholar]
Associated Data
This section collects any data citations, data availability statements, or supplementary materials included in this article.
Supplementary Materials
Figure S1 Vector map of pHMW-Adh-Nos (Nemeth et al., 2010).
Figure S2 Size and shape analysis of grain from T2 lines.
Figure S3 Mean size and shape values of grain from T3 lines from a 2D perspective.
Figure S4 Protein content of flour from 20 shortlisted T2 lines as a percentage of dry weight.
Figure S5 SDS-PAGE of mature T1 seeds.
Figure S6 SDS-PAGE of mature T2 seeds.
Figure S7 The Ta.54382 (wheat RabD2a) coding sequence showing selected target region