Abstract
Plant diseases represent a growing threat to the global food supply. The factors contributing to pathogen transmission from plant to plant remain poorly understood. Statistical correlations between rainfalls and plant disease outbreaks were reported; however, the detailed mechanisms linking the two were relegated to a black box. In this combined experimental and theoretical study, we focus on the impact dynamics of raindrops on infected leaves, one drop at a time. We find that the deposition range of most of the pathogen-bearing droplets is constrained by a hydrodynamical condition and we quantify the effect of leaf size and compliance on such constraint. Moreover, we identify and characterize two dominant fluid fragmentation scenarios as responsible for the dispersal of most pathogen-bearing droplets emitted from infected leaves: (i) the crescent-moon ejection is driven by the direct interaction between the impacting raindrop and the contaminated sessile drop and (ii) the inertial detachment is driven by the motion imparted to the leaf by the raindrop, leading to catapult-like droplet ejections. We find that at first, decreasing leaf size or increasing compliance reduces the range of pathogen-bearing droplets and the subsequent epidemic onset efficiency. However, this conclusion only applies for the crescent moon ejection. Above a certain compliance threshold a more effective mechanism of contaminated fluid ejection, the inertial detachment, emerges. This compliance threshold is determined by the ratio between the leaf velocity and the characteristic velocity of fluid fragmentation. The inertial detachment mechanism enhances the range of deposition of the larger contaminated droplets and suggests a change in epidemic onset pattern and a more efficient potential of infection of neighbouring plants. Dimensionless parameters and scaling laws are provided to rationalize our observations. Our results link for the first time the mechanical properties of foliage with the onset dynamics of foliar epidemics through the lens of fluid fragmentation. We discuss how the reported findings can inform the design of mitigation strategies acting at the early stage of a foliar disease outbreak.
Keywords: foliar disease, epidemiology, liquid fragmentation, droplets, surface tension, leaf mechanics
1. Introduction
Plant diseases aggravate the conditions of the billion malnourished individuals worldwide [1] and cause up to 60% of annual wheat loss [2,3]. In the near future, one-third of all wheat crops could be lost to re-emerging strains of rust [4–7]. In the USA, plant pathogens regularly cost more than $220 billion annually [8]. Despite the great variety of plant morphologies, rainfall was identified as a common precursor of foliar disease outbreaks. Indeed, moist conditions allow for mucilage dissolution and formation of pathogen-loaded fluid on leaves. When trapped in sticky mucilage, spores- and bacteria-inducing foliar diseases are dispersed by rainfalls [9,10]. For example, following rainfalls, new lesions at the bottom of wheat leaves were observed to appear and precede outbreaks of Septoria tritici, Septoria nodorum, yellow rust and tan spot [3,11,12]. In a laboratory setting, simulated rain led to the contamination of the surroundings of an infected plant [13]. The mechanisms determining such contamination, in particular, the range and pattern of dispersal of the pathogens remain unknown.
In recent studies of the fluid dynamics of human disease transmission, it was found that the pathogen footprint of an infected host is shaped by the size distribution of the pathogen-bearing droplets it ejects. This is, for example, the case during violent expirations such as sneezes [14]. Indeed, the size of the ejected pathogen-bearing droplets can determine their pathogen load and their range of deposition. Small droplets would contain less pathogens (figure 1). In particular, in the context of foliar diseases, droplets smaller than 100 µm do not contribute to the dispersal of spores the size of which is about 100 µm [12,15–18]. However, they can disperse bacteria and viruses, which are significantly smaller. Nevertheless, each of these individual small droplets is suspected to contain less pathogens than larger droplets. They are thus thought to be comparatively less threatening to neighbouring leaves on which they land. Nevertheless, if they are not down-drafted by other raindrops, small droplets can be advected easily by ambient wind and spread over large distances [10]. Upon escape, if they are successful at infiltrating and infecting a new susceptible leaf in a healthy field, they can trigger a new epidemic. However, following the infection of the first host, it is both the dynamics of self-contamination, from one leaf to the next within one plant, and the dynamics of transmission from one plant to its neighbour, that determine the success of the epidemic onset. Large droplets are key players at this onset stage as they can deposit locally a high number of pathogens on the target healthy leaf, making it easier to bridge its natural defence mechanisms and trigger infection [19]. In this study, we focus on the dynamics of generation of such large droplets by raindrop impacts on leaves [12,15,18] (figure 1).
Figure 1.
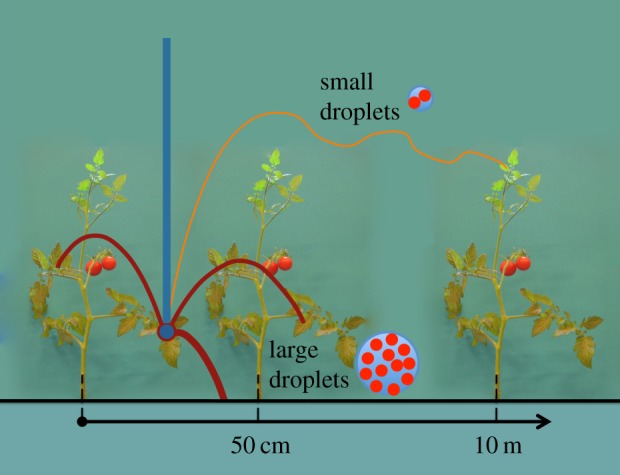
Outcomes from the impact of a raindrop (blue/thick) on a plant leaf. Large ejected droplets (maroon/dashed) containing higher pathogen loads would impact neighbouring plants; directly dictating the epidemic spread in the field, while small droplets, containing less pathogens (orange/dotted) would potentially be carried by wind to be introduced to neighbouring or more remote fields. (Online version in colour.)
Rain intensity, defined as the volume of rainwater per unit of time and unit of area, has been commonly suggested as an epidemic predictor based on its statistical correlations with foliar disease outbreaks [12,20–22]. Hoberg [23] summarizes the key experimental set-ups reported in the literature to investigate rain-induced dispersal. In this context, the main scenario proposed to explain the link between rain intensity and dispersal is the splash-on-film, where raindrops are conjectured to impact thin films of contaminated fluid coating infected leaves. The role of rain intensity in relation to transport of foliar pathogens has been an important endeavour [12,20–22,24–32]. However, the discrepancies observed when attempting to rationalize the role of rain intensity on foliar pathogen dispersal remain unresolved [33–35]. Rain intensity being an average quantity, a given value of rain intensity can be generated by multiple drop size distributions. Although prior studies have focused on linking the contamination distance with rain intensity, the fluid dynamics occurring at the leaf level during raindrop impacts on contaminated suspensions remains a black-box [28]. The study by Yang et al. [36] is one of the only papers distinctly displaying a direct visual observation of droplet impact on infected strawberry leaves. However, from their pictures it remains difficult to elucidate the fluid dynamics occurring during the impact. Moreover, in such splash dynamics, the size of the impacting raindrop is critical in determining the size distribution of the daughter-contaminated droplets ejected [37].
In §2.1, we first briefly revisit the conjectured splash-on-film scenario, so far assumed to be the dominant means of droplet emission during rainfalls. We use state-of-the-art high-speed videography to reveal the detailed fluid dynamics occurring upon raindrop impact on a range of plants in the context of rain-induced pathogen dispersal. This is first done using a simulated rainfall, with several successive raindrop impacts on various leaves. We find that common plant foliage more often supports distinct sessile drops rather than fluid films. In §2.2, we report that the most common and efficient ejection scenarios are those resulting from the impact of a raindrop on a leaf which is supporting potentially infected sessile drops. We identify two dominant scenarios of contaminated droplet ejection: the crescent-moon ejection and the inertial detachment. The crescent-moon ejection corresponds to a direct contact between the impacting drop and the sessile-contaminated drop. The inertial detachment ejection corresponds to the indirect interaction between the impacting drop and the sessile-contaminated drop, which is mediated by leaf motion. Subsequently, the focus of our study becomes that of the impact dynamics of one raindrop next to or onto one sessile drop. In §3, we report the sizes and speeds of the contaminated droplets emitted from these impacts for each ejection scenario. We report and quantify the clear distinction between the two scenarios in the distribution of contaminated fluid. In §4, dimensionless parameters, scaling laws and a theoretical model of leaf compliance are provided to rationalize our observations. We find that, at first, decreasing leaf size or increasing foliage compliance reduces the range of pathogen-bearing droplets and consequently the epidemic onset efficiency. However, this is true only for the crescent-moon ejection mechanism driven by the direct interaction between the impacting raindrop and the contaminated sessile drop. Finally, in §5, we discuss the implications of these results. Note that throughout the paper, dyed water is used as the analogue of contaminated fluid.
2. Phenomenology of raindrop impact on leaf
2.1. Film versus sessile drop
As discussed in §1, although commonly conjectured, the scenario of raindrops impacting and splashing on thin contaminated films coating plant leaves was not previously visually reported [9,30]. Using high-speed videography (1000 frame s−1) we tested this scenario by comparing impacts of raindrop analogues on a liquid film (figure 2a) with impacts on a series of wet real leaves (figure 2b–d). In both liquid film and wet leaf configurations, a liquid sheet is formed then fragmented into several ejected droplets. Nevertheless, both configurations have markedly different outcomes. On a film, the liquid sheet is more or less vertical and axisymmetric about a vertical axis, and so is the droplet ejection (figure 2a). On real plants, the liquid sheet is observed to be asymmetric, which typically gives a strong horizontal velocity to the ejected droplets (figure 2b,d). Moreover, additional ejection scenarios are present on real plants that do not involve the fragmentation of a sheet (figure 2c,d).
Figure 2.
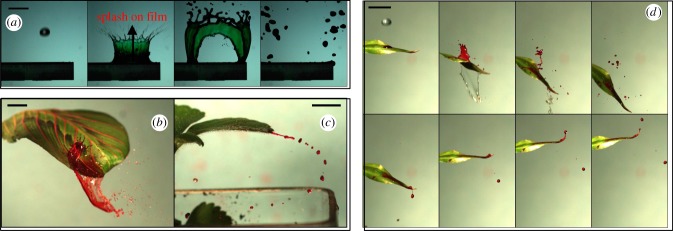
Ejection of contaminated droplets (highlighted in red) triggered by the impact of a raindrop (diameter 2.5 mm, velocity 6 m s−1) on (a) a green liquid film (here in a 1 mm depth pool at the upper surface of the cantilever beam) at −2.5, 2.5, 17.5 and 62.5 ms after impact; (b) a prayer plant leaf at 6 ms after impact; (c) a strawberry leaf at 55 ms after impact; (d) a lucky bamboo leaf at −2, 4, 8, 16, 52, 61, 69 and 74 ms after impact. In (b–d), a sessile drop containing pathogen analogue (red dye) is initially placed close to the impact point. Scale bars, 1 cm. See electronic supplementary material, movies S1–S4.
The difference between the conjectured and the observed scenarios originates from the wetting properties of plant leaves. Contact angles were found to vary between 60° and 120° on 13 common plant leaves [38]. So the leaves are not totally hydrophilic and the formation of a water film on the leaf surface is not energetically favourable. This partial wetting behaviour is thought to minimize disturbance to plant breathing and structural stability. Moreover, it reduces detrimental colonization of the leaf surface [39]. Contact angle hysteresis up to 30° has been observed, which is consistent with other recent measurements on common plants (e.g. [40]). The corresponding surface tension forces at the contact lines prevent small droplets from sliding away, so the rainwater residuals from previous impacts accumulate on the leaf. Large drops and puddles drip off when this force induced by contact angle hysteresis no longer balances the pull of either gravity or wind drag. Leaf compliance magnifies the gravitational pull. These observations suggest that the liquid in which pathogens are suspended is more likely in the shape of a sessile drop rather than in the form of a liquid film. In §3, we will show that this subtle difference in initial shape leads to major quantitative differences in the resulting pathogen ejection pattern. Building on this finding, we now focus the reminder of the study on the dynamics of impacts of raindrops on dyed sessile drops residing on a variety of real and artificial leaves.
2.2. Dominant modes of pathogen-bearing droplet ejection
Observations of rain falling on a plant reveal a wide spectrum of possible impact and fragmentation scenarios, owing to the many parameters (including leaf shape and inclination, drop size and initial position) that are simultaneously varied in natural conditions. Nevertheless, these many modes of pathogen-bearing droplet ejection are not equally likely, nor are they equally good at ejecting droplets away. Only scenarios that are both likely and efficient can potentially govern the dynamics of rain-induced pathogen dispersal shaping epidemic growth in the field. We recorded and analysed high-speed visualizations (Phantom-v5, 1000 frames s−1) of thousands of raindrops in the millimetre range impacting on 30 plants, including foliar disease victims (figure 2b–d). The leaf initially supported a sessile dyed drop, which was used as the analogue of an infected drop. The visualizations indeed revealed a collection of liquid fragmentation phenomena, all very different from the splash on a liquid film (figure 2a) [37,41]. We identified two dominant modes of droplet ejection.
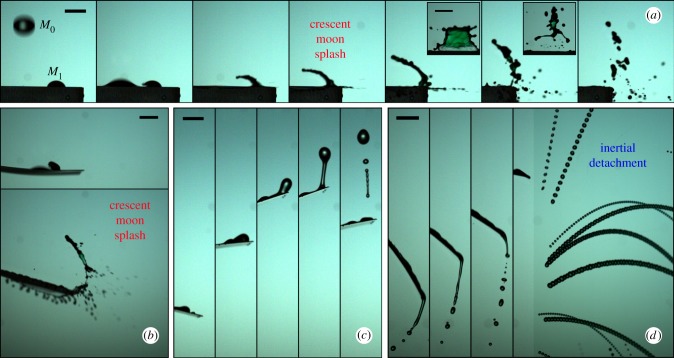
In the first ejection mode, the raindrop impacts in the vicinity of the dyed sessile drop and expands until direct contact between them occurs (figures 2b,d and 3a–b). Subsequently, the raindrop slides underneath the dyed drop. The latter is then lifted in succession in the form of a sheet that fragments into filaments and droplets. We refer to this mode as the crescent-moon splash due to the shape and motion of the liquid sheet. Leaf compliance has little qualitative influence on this mechanism (figure 3a versus b). The crescent-moon splash shares certain features with liquid splashes commonly described in the literature (e.g. corona splash [37]). These include the dynamics of initial raindrop spreading. However, the horizontal asymmetry of its liquid sheet is a specific feature of the crescent-moon splash. It provides a significant horizontal velocity component to the ejected droplets, and therefore can play an important role in pathogen dispersal to neighbouring plants.
Figure 3.
Fragmentation mechanisms revealed by time sequences of off-centre raindrop (mass M0) impacts on a sessile drops (mass M1) placed on several substrates at distance L1 from their edge. (a) Crescent-moon splash on a rigid surface (·) at −1.25, 1.25, 2.5, 3.75, 6.25, 10 and 15 ms after impact. Insets represent front views showing the dark/green fluid (analogue of contaminated). (b) Crescent-moon splash on an artificial compliant leaf (•) at 1.25 and 7.5 ms after impact. (c) Inertial detachment on the same compliant leaf (•) at 62.5, 77.5, 92.5, 107.5 and 122.5 ms after impact. (d) Inertial detachment and catapult on a tomato leaf (t) at 30, 36.25, 40 ms after impact. The last frame represents a time superposition from 50 ms after impact. Scale bars, 5 mm. See electronic supplementary material, movies S5–S7. (Online version in colour.)
The second ejection mode is only observed for light and compliant leaves and it involves an indirect interaction between the raindrop and the sessile drop mediated by leaf motion (figures 2c,d and 3c,d). Upon impact, the leaf significantly bends and oscillates. The resulting acceleration elongates then fragments the sessile drop via Rayleigh–Taylor and Rayleigh–Plateau instabilities. Upon ejection, the spawned sessile droplets inherit the leaf velocity. We name this indirect mode the inertial detachment. We recorded centrifugal accelerations of up to 10 g at the tip of small leaves such as strawberry, tomato and blueberry. For millimetre drops, the associated inertial forces easily overcome capillary forces, resulting in the drift of the dyed liquid to the tip (figure 3c,d). If this latter is reached within one-fourth of the leaf oscillation period, the liquid detaches on the upward motion of the leaf. The resulting droplets are then catapulted away (figures 2c and 3d). Note that during storms, wind drag also induces leaf motion and subsequent inertial detachment; however, the remainder of the paper is concerned with raindrop-induced motion.
3. Quantification through analogue experiments
3.1. Experimental set-up
The ejection dynamics of both dominant scenarios is quantified through an extensive set of analogue experiments (figure 4). In order to address the role of leaf mechanical properties and inclination, we considered 15 different substrates, whose properties are summarized in table 1. They comprise four real leaves still attached to their plant (tomato t, citrus c, strawberry s and blueberry b); a 1 mm depth liquid film (*); and 10 artificial plastic leaves with contact angle 62 ± 4°. The latter include a stiff horizontal surface (·), a stiff inclined surface (×) and eight 2 cm width cantilevers of varying mass, length and compliance (○, ∇, □, ▹, •, ▾, ▪, ▸).
Figure 4.
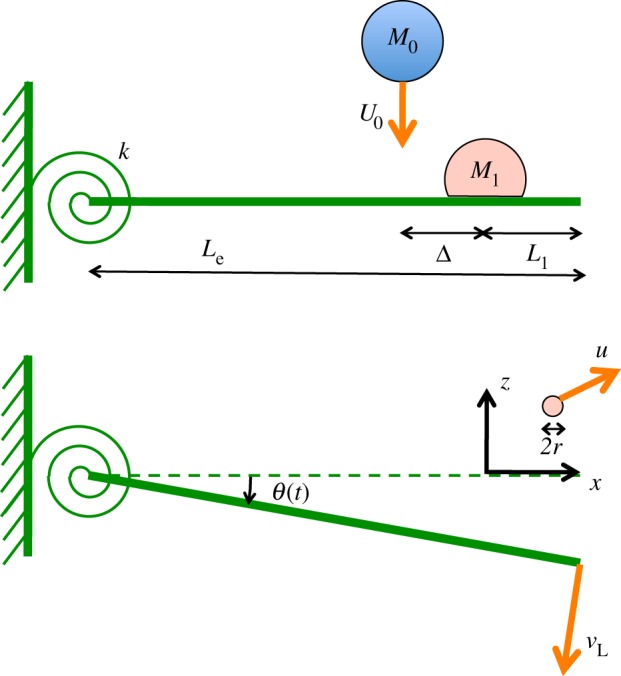
Analogue experiments. Most artificial leaves consist of cantilevers hinged at their base (torsional stiffness k and length Le). (a) A drop of mass M1 is placed on the leaf, at a distance L1 from the tip. A drop of mass M0 and speed U0 impacts the leaf at a distance Δ from the drop M1. (b) After impact, the leaf motion is approximated by a solid body rotation (angle θ(t)). The velocity of the leaf tip is vL. Droplets of radius r are ejected at a velocity u. (Online version in colour.)
Table 1.
Mechanical properties of the 15 analogue experiment substrates. M, mass; L, length; Le, effective length; θ0, initial inclination; ω0, natural frequency; k, torsional stiffness; α, compliance parameter. These three latter parameters are calculated from the leaf model presented in §4.
| symbol | description | M (g) | L (cm) | Le (cm) | θ0 (°) | ω0 (rad s−1) | K (mN m rad−1) | α (—) |
|---|---|---|---|---|---|---|---|---|
| real | ||||||||
| b | blueberry | 0.21 | 3.8 | 3.6 | 13 | 102 | 1.4 | 5.4 |
| s | strawberry | 0.29 | 4.5 | 6.8 | 9 | 38 | 1.3 | 3.5 |
| c | citrus | 0.56 | 8.0 | 8.3 | 5 | 44 | 3.0 | 2.8 |
| t | tomato | 0.09 | 2.9 | 3.7 | 28 | 78 | 0.6 | 6.6 |
| artificial | ||||||||
| · | art. rigid horizontal | — | — | — | 0 | — | ∞ | 0 |
| × | art. rigid inclined | — | — | — | 45 | — | ∞ | 0 |
| ○ | art. compl. | 0.16 | 3.0 | 3.0 | −6 | 124 | 1.3 | 6.2 |
| ∇ | art. compl. | 0.23 | 3.0 | 3.1 | −4 | 112 | 1.3 | 4.8 |
| □ | art. compl. | 0.47 | 3.0 | 3.2 | 0 | 94 | 1.8 | 2.9 |
| ▹ | art. compl. | 0.78 | 3.0 | 3.3 | 3 | 88 | 2.7 | 1.9 |
| • | art. compl. | 0.34 | 6.0 | 5.2 | 3 | 45 | 0.8 | 4.5 |
| ▾ | art. compl. | 0.51 | 6.0 | 5.5 | 3 | 47 | 1.3 | 3.3 |
| ▪ | art. compl. | 0.84 | 6.0 | 5.8 | 2 | 65 | 4.5 | 2.2 |
| ▸ | art. compl. | 1.5 | 6.0 | 6.0 | 4 | 59 | 6.9 | 1.3 |
| ⋆ | art. compl. | 0.51 | 6.0 | 4.9 | 6 | 46 | 0.7 | 0.54 |
| * | liquid pool | — | — | — | 0 | — | — | 0 |
The dynamic bending of a plant leaf upon impact involves many geometrical and structural parameters in a complex way, including leaf curvature and the structural support provided by various patterns of venation. A leaf is not usually clamped at one end, but instead connected to a plant that can also move in response to the impact. Thus, leaf response to impact is a complex multimodal combination of bending and twisting motions; which is impossible to characterize in full at once. Most importantly, it might not be necessary to do so in order to explain the fluid fragmentation examined in this study. Instead, we focus on isolating the role of size, mass and compliance to propose a physical analogue model for leaf motion. The eight cantilever artificial leaves were designed with the purpose of simplifying the leaf dynamics to a problem where the effect of compliance is localized: the leaves are hinged at their base (figure 4) to allow for a deflection mostly captured by a solid body rotation around the hinge. Thus, the motion can be reduced to a single time-dependent angle variable θ(t). Table 1 indicates that these artificial hinges have a finite torsional stiffness k in the same range as the effective torsional stiffness of the real plant leaves that we examined. As subsequently shown, this physical analogue model allows the capture of most of the dynamics of leaf motion relevant for fluid break-up and pathogen-bearing droplet ejection.
The strength of a liquid impacter of mass M0 and velocity U0 is quantified through the Weber number  . This dimensionless group accounts for the relative importance of kinetic to surface energies [37]. Here, σ = 72 mN m−1 and ρ = 1000 kg m−3 are the surface tension and density of water, respectively. Larger raindrops fall with a larger terminal velocity. Thus, they impact with a higher We0 and can potentially cause more ejections. Practically, raindrop size is limited to a few millimetres in radius [42]. Indeed, larger raindrops experience a bag break-up instability, in which the surrounding air penetrates the drop [43]. Recent investigations [44,45] indicated that this break-up is actually responsible for the size distribution of raindrops at ground level. In our quantitative experiments, we fixed the mass of the impacting raindrops to M0 = 56 ± 6 mg. Their equivalent radius R0 = 2.4 ± 0.1 mm is slightly below the break-up instability threshold. Therefore, our raindrop size is about the maximum that could be encountered in a rainfall. The corresponding terminal velocity, reached before impact, is measured to be U0 = 6.04 ± 0.05 m s−1, so the Weber number is We0 = 1200 ± 5%.
All leaves are initially fixed at 50 cm above the ground. The following operations were repeated 100 times for each substrate. A dyed water drop (McCormick), supposed to mimic an infected drop, was placed at distance  from the leaf tip (figure 3a), except for (⋆) where L1 = 3.5 cm. At sufficiently low dye concentration, dyed water has the same physical properties (density, surface tension) as plain water and is perfectly miscible in it. This sessile drop had a fixed mass M1 = 12 ± 3 mg, or equivalent radius R1 = 1.4 ± 0.1 mm. Then, a raindrop (as described here above) was released from 4 m height and impacted the leaf at almost terminal velocity. We finely tuned the horizontal position of the substrate for the distribution of the impact position Δ (figure 4) to be centered on the sessile drop. We found that the impact distance from the position of the sessile drop follows a normal distribution with standard deviation of 3.8 mm. This apparent randomness is due to the aerodynamic coupling between the raindrop trajectory and its own wake. The Reynolds number associated with the raindrop progressively reaches Re = 2000 during the free fall. In this intermediate regime, the raindrop alternatively sheds counter-rotating vortices (Karman vortex street) that in turn modify the droplet's trajectory. As a result, the raindrop occasionally directly hits the sessile drop, but, more often than not, it misses and impacts in its vicinity, spreads and then possibly dislodges the sessile drop in the form of a crescent moon ejection. For each impact, we measured the leaf angular position θ(t), the size r, and the initial speed u (velocity magnitude) of the ejected droplets (figure 4), with a resolution of r ≈ 30 µm being the smallest detectable droplet radius.
3.2. Droplet ejecta hydrodynamics
Figure 5 shows the size r and initial speed u of the ejected droplets. These contain mostly fluid from the dyed sessile drop, possibly slightly diluted by water from the raindrop (e.g. figure 3, insets). Droplet trajectories were computed accounting for drag. The Reynolds number of the ejected droplets Re = 2ρaur/μa ranged from 5 to 100 (figure 5), where  and μa = 0.018 cP are the air density and viscosity, respectively. The Stokes drag formula F = 6πμaru is only valid when
  . In the considered regime of the Reynolds number, drag is estimated by multiplying Stokes estimate by a correction factor (1 + 0.15 Re0.687) [46]. The settling speed at which gravity and drag balance establishes a boundary between two groups of pathogen dispersal agents. Large droplets (
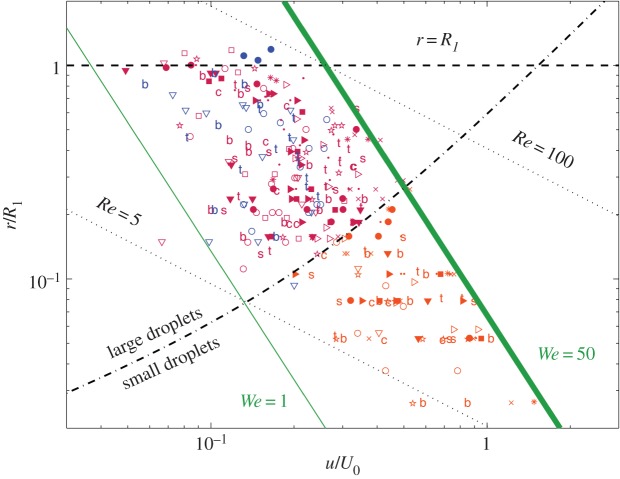
 ) follow gravity-dominated trajectories. Small droplets (typically smaller than 200 µm) are strongly affected by air drag and they evaporate in less than a second. Any residual pathogenic nuclei would then easily be advected by ambient wind [47]. Figure 1 illustrates conceptually the potential difference in range and pathogen load between the two. Here, we quantified and identified a maximum value of 50 for the Weber number We = ρru2/σ of the ejected droplets. This maximum value imposes an upper limit on initial ejection velocity u that scales as r−1/2. This upper bound in We is shared by all substrates for this specific Weber We0 of the incoming drop.
Figure 5.
Fragmentation limits. Radius of the ejected droplets r (normalized by the sessile drop radius R1) as a function of their ejection velocity u (normalized by the raindrop velocity U0). Crescent-moon splash droplets are in shades of red. Inertial detachment droplets are in blue. Symbols refer to substrates (table 1). The dashed line marks r = R1. The dash-dot line represents the speed at which drag and weight are equal in magnitude. The green solid lines correspond to We = 1 and We = 50. The lower and upper dotted lines mark Reynolds number values of Re = 5 and Re = 100, respectively.
3.3. Pathogen footprint
In order to link the contamination pattern to the mechanical properties of the plants, a top-view picture of the ground was taken (Nikon D90) after each set of raindrop impacts on the substrates considered (table 1). Moreover, the substrate was cleaned prior to placing another dyed drop to ensure repetition of identical and statistically independent impacts.
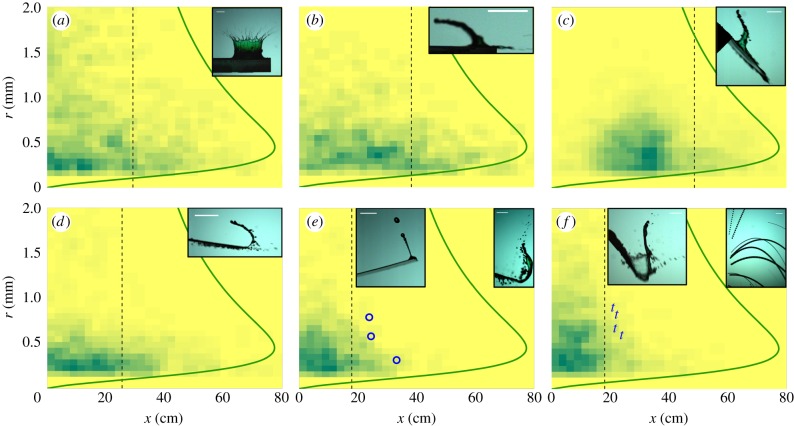
Figure 6 shows the contamination footprints of various infected leaves. This is the probability density function (PDF) of deposition of analogue contaminated dyed droplets of size r at a horizontal distance x from the centre of the initial sessile drop, 50 cm below leaf level. Using the upper limit We = 50 valid for all substrates (figure 5) and accounting for drag, we compute the maximum distance of potential deposition xm(r) over all possible angles of ejection. The farthest travelling droplets have a size of r ≈ 400–500 µm. The contamination footprint clearly changes from the splash-on-film (figures 5, 6a and table 1) to the crescent moon on rigid substrate (figure 6b) while remaining bounded by the theoretical envelope xm(r). This variation is partly due to the intrinsic asymmetry of the crescent-moon splash (figure 3a), which strongly enhances the initial horizontal impulse of the ejected droplets. Leaf inclination (figure 6c) shifts the pathogen footprint to higher x, without modifying the maximum distance of deposition. Leaf motion and compliance act strongly in the opposite direction (figure 6d–f). They reduce the splash-induced footprint by absorbing the incoming kinetic energy and further stretching the dyed liquid sheet. The maximum distance travelled by droplets ejected from a light and compliant substrate is then significantly lower than the theoretical prediction based on the maximum Weber number.
Figure 6.
Pathogen footprint. Probability distribution functions of ejected droplets for different substrates (table 1, a = (*), b = (·), c = (×), d = (□), e = (○), f = (t)). Shades of green (grey in print) quantify the likelihood of deposition of an ejected droplet of size r to reach a horizontal distance x from the leaf. The green (grey in print) solid line is the substrate-independent limit xm(r) resulting from We ≤ 50. Additional symbols (e,f) mark the position of the furthest reaching inertial detachment droplets. The vertical dashed line represents the distance x* past which only 10% of the total ejected volume is identified. (Online version in colour.)
4. Theoretical model
4.1. Compliance parameter
In order to quantify the influence of leaf weight and compliance on the contamination footprint, we introduce a new dimensionless parameter
| 4.1 |
where vL is the leaf velocity at the impact point (figure 2d) and vf is the velocity of fluid fragmentation. The fragmentation timescale tf is expected to vary with the size of the liquid sheet. This size is proportional to the radius R1 of the sessile drop. Preliminary measurements (made on three different drop sizes) indicate that
| 4.2 |
This scaling law is encountered in many capillary phenomena where inertial forces are directly balanced by surface tension. For example, it captures the contact time of a drop bouncing on a non-wetting substrate [48], or the period of free oscillations of a drop, as first calculated by Lord Rayleigh. In our experiments,  .
.
To estimate vL, modelling the kinematics of the leaf tip is necessary. Directly tracking the leaf tip on high-speed videography allowed us to identify the initial leaf inclination θ0 and showed that the motion of the tip can be approximated by a circular arc of radius Le. It appeared that, from the perspective of the sessile drop, the leaf could be approximated as a solid body of mass Me = MLe/L in rotation about a virtual centre located at a distance Le from the tip (figure 4). Some plant leaves satisfy this approximation better than others and artificial leaves have been designed to satisfy it almost exactly. The effective length Le is found to be distinct from leaf length L (table 1). Instead, it encapsulates the effects of compliance and encompasses the portion of leaf mass Me that is effectively disturbed during the raindrop impact time. Fully rigid leaves (high bending stiffness) articulated only at their base have an Le equal to their total length L. The corresponding excited mass Me is then equal to their total mass Me = M. Compliant leaves (small bending stiffness) yield  . In the appendix, using a spectral method, we calculate the effective length for a distributed compliance assuming a homogeneous cantilever beam clamped at one end. We can then identify the regimes during which leaf tips approximately move along a circular arc and discuss the range of validity of our assumption.
Figure 7 shows that upon impact, the angular momentum of the incoming raindrop M0U0(Le − L1)cos θ0 is almost entirely transferred to the angular momentum  of the joint system made of the leaf, the raindrop, and the sessile drop, whose moment of inertia is
| 4.3 |
The angular velocity
| 4.4 |
of this joint motion yields the leaf velocity
| 4.5 |
The more compliant the leaf, the smaller Le/L and Me/M, and the larger vL and α. The relevance of α for capturing the influences of leaf size, mass and compliance is confirmed by the measured footprints surrounding the leaves, as discussed next.
Figure 7.
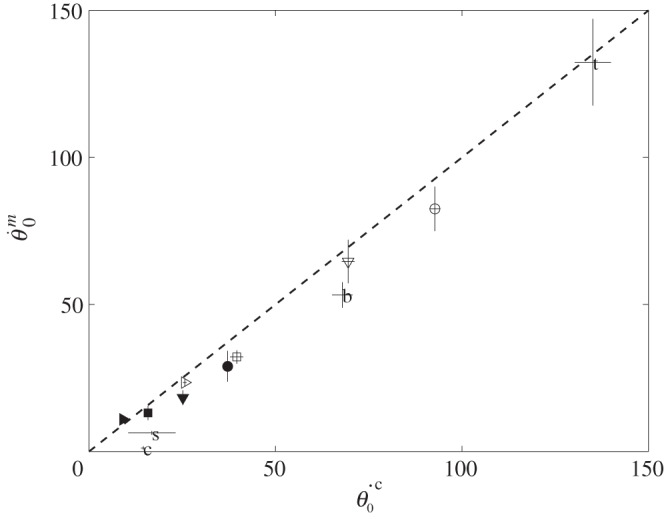
Conservation of angular momentum upon impact. Measured  versus calculated
  initial angular velocity (in rad s−1). Symbols are given in table 1.
After impact, the angle governing the motion of the leaf tip obeys the equations of a monochromatic damped harmonic oscillator
| 4.6 |
so
| 4.7 |
The frequency ω and damping rate β are determined by fitting this solution on the measurements of θ(t) (figure 8). From there, the natural frequency  and the torsional stiffness
  are inferred (values are reported in table 1).
Figure 8.
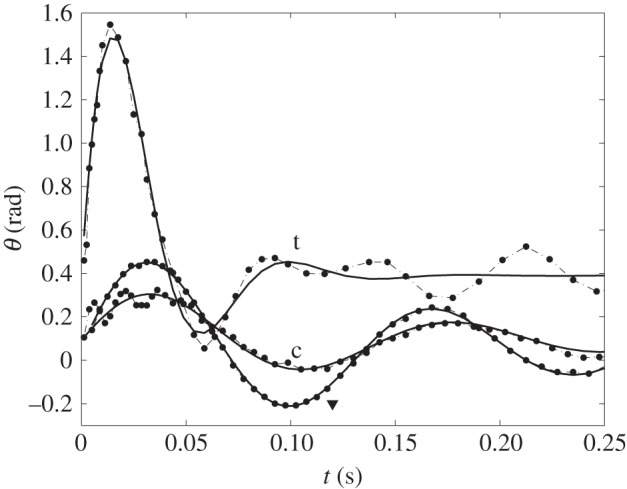
Compliant leaf kinematics. Leaf inclination θ as a function of time t for citrus (c), tomato (t) and the artificial leaf (▾). Dots correspond to measurements, while the lines represent a fit by a monochromatic damped oscillator (equations (4.6) and (4.7)).
Figure 8 indicates that although the monochromatic approximation is excellent for the artificial hinged leaves, real leaf oscillations may comprise harmonics and subharmonics (e.g. [49] and references therein). In particular, harmonics (higher frequencies) are observed on relatively heavy leaves (e.g. citrus). They correspond to a very local and immediate response of the leaf to the impact, with an oscillation wavelength significantly smaller than the leaf length. In our experiments, crescent-moon fragmentation occurs during the first 7 ms after impact. Leaf motion harmonics that correspond to this timescale are expected to modify fragmentation and subsequent dispersal. Subharmonics (lower frequencies) originate from the induced motion of the stems. They are observed on much lighter leaves (e.g. tomato), where the angular momentum and kinetic energy of the impacting drop cannot be entirely absorbed by the leaf alone. They only affect the long-term response of the leaf and have a negligible influence on the crescent-moon splash dynamics. Note that inertial detachment also occurs during the first period of oscillation and is thus not affected by subharmonic motions.
4.2. Compliance impacts dispersal
Whether real or artificial, leaves with similar α show similar footprints (figure 6e–f). Furthermore, we define the distance from the leaf x* beyond which only 10% of the dyed fluid volume resides. Figure 9a shows a significant decrease of x* with increasing α. It is split in two regions: α < 4 and α > 4. In the first region (α < 4), the crescent-moon splash dominates. It is less efficient at ejecting droplets away from compliant and light leaves (as seen as α increases). The limit case α = 0 (horizontal rigid substrate) is well aligned with other data points at finite α. Note that the inclined rigid substrate can [symbol (×)] extend x* to up to 50 cm (as shown in figure 6c). In sum, the parameter α describes well the influence of leaf motion on splash dynamics. Only the citrus is found not to match the prediction. This is due to the presence of harmonics in the early leaf motion, as discussed in the previous section. Indeed, by neglecting these harmonics, we in effect underestimate the effective compliance of the leaf at early times; thus underestimate α. In the second region (α > 4), inertial detachment emerges as another ejection mechanism. Figure 6e–f indicates that the droplets originating from inertial detachment can go farther than those originating from a splash or crescent-moon splash on the same leaf.
Figure 9.
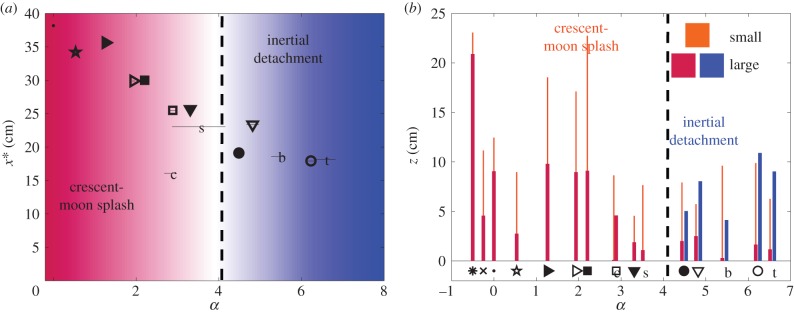
Compliance impacts dispersal. (a) Variation of x* with respect to the compliance parameter α. (b) Ejection height z of the droplets as a function of α. Thick (thin) lines indicate the maximum distance upwards reached by large (small) ejected droplets. In both (a,b), symbols refer to substrates as described in table 1. Blue shades correspond to inertial detachment while red shades correspond to crescent-moon splash. The dashed line indicates the value of α beyond which inertial detachment is observed.
The analysis of the height of contamination by droplet ejecta, z, further supports this conclusion (figure 9b). As soon as inertial detachment becomes possible (α > 4), its capacity in producing and projecting larger droplets higher dominates that of the crescent-moon splash. Typical vertical dispersal ranges from 10 cm for large droplets to 20 cm for small droplets. This distance enables upward self-contamination, as was observed in field studies [3]. Inclination [symbol (×)], which enhances horizontal dispersal, also strongly diminishes the upward motion. In sum, our results suggest that the crescent-moon splash is observed on every foliage, but it is efficient at projecting droplets and dispersing pathogens further away only for relatively large and rigid leaves. Meanwhile, the inertial detachment is only observed for lighter and more compliant leaves, for which it is more efficient than splash at projecting larger droplets further away. This distinction is important as we recall that large droplets landing on a leaf have the ability to deposit large amounts of pathogens locally; thus increasing infection likelihood.
5. Discussion
Foliar diseases menace the economy and food supply of an ever-growing world population with limited resources. Current mitigation strategies in today's monoculture concentrate on pesticides and genetic modification of plants [50]. In the context of rain-induced transmission of foliar diseases, the dynamics of pathogen–plant interaction and the mechanisms of creation and ejection of pathogen-bearing droplets remain effectively treated as a black-box. The scenario conjectured within such black-box is that of the emission of contaminated droplets via splash-on-film. In this combined experimental and theoretical study, we revisited this classical conjecture. Measurements of the contact angle of water on leaves showed that liquid films are seldom seen on common plant leaves. Instead, we find sessile drops. This distinction has important implications, as revealed from direct high-speed videography of raindrop impact on various leaves. Instead of the classically discussed raindrop splash on contaminated water films, we find two other dominant ejection mechanisms. The first, which we call crescent-moon ejection, relies on the direct interaction of the impacting raindrop with the contaminated sessile drop on the target leaf. The second, which we call inertial detachment ejection, is enabled by leaf lightness and compliance to generate catapult-like ejections. The crescent moon can involve some level of mixing between the fluid of raindrops and that of sessile-contaminated drops, while the inertial detachment does not necessarily. Thus, there is a difference in the pathogen load of the droplets resulting from either one of the mechanisms. Although the crescent moon shares the generation of a sheet and its break-up into droplets also found in the dynamics of splash-on-film, this drop-on-drop fragmentation process leads to droplet sizes and directional ejections clearly distinct from those generated from a drop-on-film corona break-up. The inertial detachment dynamics does not involve the direct interaction between the raindrop and the sessile drop. It is the result of a regime of liquid fragmentation distinct from that of either the splash-on-film or the crescent-moon break-ups.
We observed that leaf size, mass and compliance play a key role in the selection of the dominant scenarios of ejections and their efficacy in projecting contaminants to neighbouring plants. Using dimensional analysis we found that the spatial range of the contaminated droplets ejected is constrained by a hydrodynamic condition. In fact, such fluid dynamics constraint sets a minimum spacing between plants (identified in figure 5) above which the likelihood of large-droplet rain-induced contamination vanishes. Building on a theoretical model of leaf motion, we introduced a single compliance parameter α that compares the leaf velocity to the fragmentation velocity. This parameter captures and rationalizes the influence of leaf size and compliance on splash. Our results suggest that increasing α can reduce the range of disease transmission; leading one to believe that smaller and more compliant leaves induce a slower epidemic spread. However, a closer look reveals a more subtle effect: above a certain threshold on α, the inertial detachment emerges. This new mechanism of ejection turns out to enhance the range of deposition of larger contaminated droplets. This is important as large ejected droplets have a higher probability of infecting healthy surrounding plants than smaller droplets. In sum, during rainfalls, although compliance appears at first to monotonically decrease the range of pathogen-bearing droplets ejected from a sick plant, its pathogen footprint is not necessarily decreased: the crescent-moon ejection is more effective for disease transmission from large or rigid leaves (small α), while the inertial detachment dominates for light and compliant leaves (large α).
Our results show how the effect of leaf compliance and its careful quantification can account for changes of contamination range by a factor of up to four (figure 6). For the same plant spacing density in a monoculture field, a change in the size or compliance of the foliage could then quadruple the epidemic propagation speed (figure 10a). Moreover, our results suggest that alternating the position of plants of different species, but with carefully selected complementary α could halt epidemic onset (figure 10b). Our results provide, for the first time, a means to quantify the effect of polyculture on epidemic onset using mathematical models encompassing the intrinsic mechanical—rather than immunological—properties of the plants involved.
Figure 10.
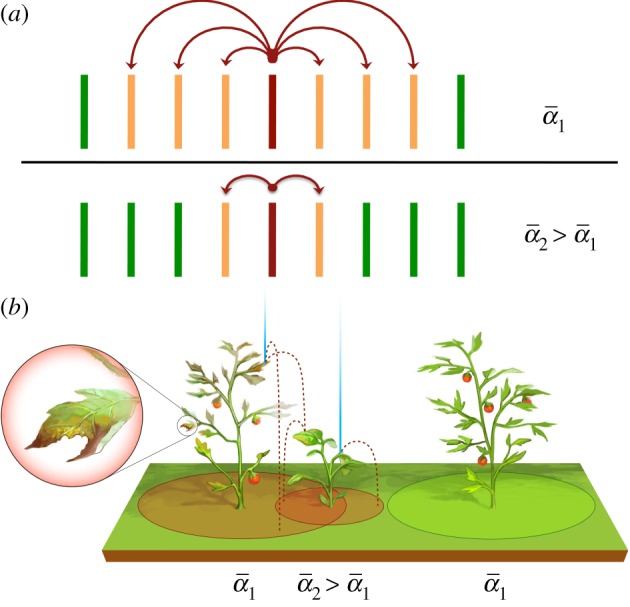
Consequences on foliar pathogen dispersal (a) Given a plant density, the speed of epidemic spread from the index plant (maroon/dark grey) to its neighbours (orange/light grey) decreases with increasing α. (b) Identifying plants of compatible α to be alternated in the same field can potentially halt epidemic onset. (Online version in colour.)
Acknowledgements
J. Wang and B. Ding are thanked for their assistance with preliminary experiments and the MIT Undergraduate Research Opportunity Program (UROP) is thanked for enabling their involvement. J. W. M. Bush, M. Mayser, J. Vogeleer and the anonymous reviewers are thanked for their comments.
Appendix A. Effective length of a cantilever beam
We here establish an exact relationship between the effective length and the compliance of a cantilever beam. We consider the ideal case of elastic deformation of a homogeneous beam clamped at one end and free at the other. The beam has a length L, a bending modulus EI and a linear density μ. The vertical deflection of the beam W(x, t) is assumed to remain small with respect to L; thus, satisfying the linear Euler–Bernoulli equation:
The boundary conditions at the clamped end, x = 0, are W = ∂xW = 0, assuming no displacement nor slope. The effect of the impacting raindrop is modelled by a sinusoidal point force F sin(ωt) applied at the free end of the beam (x = L). The corresponding boundary conditions at x = L are ∂xxW = 0 and ∂xxxW = F/EI sin(ωt), reflecting a zero bending moment and the resulting shearing caused by the impact. The beam is initially at rest, with initial condition  . The timescale of the raindrop impact is then π/ω; hence, our limitation to the examination of the time interval
  . We non-dimensionalize the problem by introducing the new variables
  ,
,  , and by replacing W by
  . The resulting equation is:
The dimensionless stiffness Ω represents the ratio between the natural frequency of the beam and the frequency of the impact. Relatively stiff beams (large EI) respond immediately to the impact force and yield large Ω. Boundary and initial conditions become w = ∂yw = 0 in y = 0, ∂yyw = 0 and ∂yyyw = (L2F)/(EI)sin τ in y = 1, and w = ∂τw = 0 in τ = 0. Since both the partial differential equation and the associated boundary conditions are linear in w, the deflection is proportional to the force. For the sake of simplicity, we then choose F = EI/L2.
To solve this differential equation, we first define an arbitrary test function f(y,t) = y2/2(y/3 − 1)sin τ that satisfies the boundary conditions. The variable v(y, t) = w(y, t) − f(y, t) now satisfies
with homogeneous boundary conditions v = ∂yv = 0 at y = 0 and ∂yyv = ∂yyyv = 0 at y = 1. The initial conditions are v = 0 and ∂τv = y2/2(1 − y/3). The solution can be expanded as v(y, τ) = ∑ici(τ)ψi(y) in terms of the eigenfunctions of the spatial operator of the differential equation
 |
where the eigenvalues αi are given by cosh αi · cos αi + 1 = 0 and where the ci(τ) are the coefficients of expansion to be determined. The eigenfunctions satisfy
and we define
 |
Similarly, the test function f(y, t) can be expanded as
 |
As a result, solving for the coefficients of expansion ci(τ) reduces to solving the second-order differential equation  , with initial conditions ci(0) = 0 and
  . Hence,
The effective length Le is obtained from the ratio of the deflection and the slope of the beam tip:
 |
Assuming that the beam tip describes a circular motion, Le should be independent on time. Figure 11 indicates that this hypothesis is well-verified during the first half-period of the forcing π/ω as long as either Ω < 0.1 or Ω > 1. For the latter condition, ci → 0 so Le saturates to 2/3 L. For the former condition, things are more subtle as the effective length is set by the largest coefficient, ck of the expansion. This corresponds to the effect of the slowest eigenmode k which affects the clamped end of the beam within the timescale of the impact. In other words,  , leading to an effective length of
Figure 11.
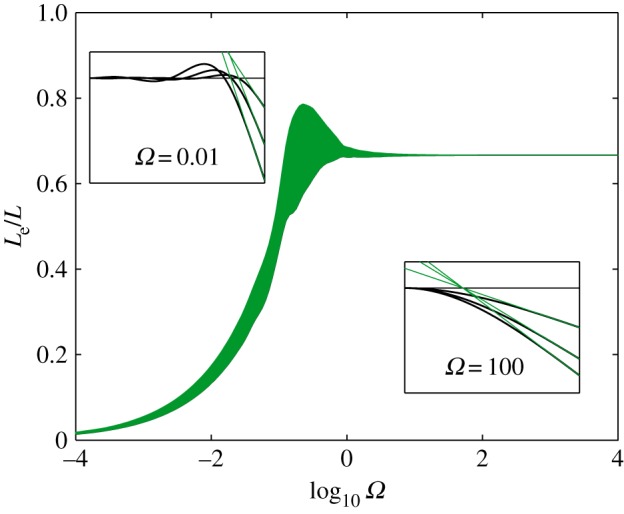
Effective length of a clamped beam as a function of the dimensionless stiffness Ω. The thickness of the line is proportional to the standard deviation of Le(τ) and reveals the extent to which it is time independent and well defined. Insets represent the beam deformation over time for two different values of Ω. The effective length is defined as the distance between the tip of the beam and the intersection of green (light grey) lines with the horizontal. (Online version in colour.)
Funding statement
T.G. acknowledges financial support from the Fonds Spéciaux pour la Recherche (University of Liège), the Crédit de recherche FNRS and the Inter-university Attraction Poles Programme (IAP 7/38 MicroMAST). L.B. acknowledges financial support from the MIT Reed Fund and the MIT Edgerton Fund.
References
- 1.Strange RN, Scott PR. 2005. Plant disease: a threat to global food security. Annu. Rev. Phytopathol. 43, 83–116. ( 10.1146/annurev.phyto.43.113004.133839) [DOI] [PubMed] [Google Scholar]
- 2.Park RF. 2007. Stem rust of wheat in Australia. Aust. J. Agric. Res. 58, 558–566. ( 10.1071/AR07117) [DOI] [Google Scholar]
- 3.AHDB-HGCA. 2012. Wheat disease management guide. Technical report Kenilworth, UK: The cereals and oilseeds division of the Agriculture and Horticulture Development Board (AHDB), UK, 2012. [Google Scholar]
- 4.The Kona Coffee Farmers Association. 2010. The Independent Voice. (October):1–2.
- 5.Dubin HJ, Brennan JP. 2009. Combating stem and leaf rust of wheat. Technical report. November Washington, DC: International Food Policy Research Institute. [Google Scholar]
- 6.Schnepf R. 2005. CRS Report for Congress Asian Soybean Rust: background and issues. Technical report Washington, DC: Congressional Research Service, The library of congress. [Google Scholar]
- 7.Rust in the bread basket. 2010. The economist, pp. 4–7. [Google Scholar]
- 8.Agrios G. 2005. Plant pathology, 5th edn New York, NY: Elsevier Academic Press. [Google Scholar]
- 9.Meredith DS. 1973. Significance of spore release and dispersal mechanisms in plant disease epidemiology. Annu. Rev. Phytopathol. 11, 313–342. ( 10.1146/annurev.py.11.090173.001525) [DOI] [Google Scholar]
- 10.Aylor DE. 1990. The role of intermittent wind in the dispersal of fungal pathogens. Annu. Rev. Phytopathol. 28, 73–92. ( 10.1146/annurev.py.28.090190.000445) [DOI] [Google Scholar]
- 11.Huber L, Gillespie TJ. 1992. Modeling leaf wetness in relation to plant disease epidemiology. Annu. Rev. Phytopathol. 30, 553–577. ( 10.1146/annurev.py.30.090192.003005) [DOI] [Google Scholar]
- 12.Fitt BDL, McCartney HA, Walklate PJ. 1989. The role of rain in dispersal of pathogen inoculum. Annu. Rev. Phytopathol. 27, 241–270. ( 10.1146/annurev.py.27.090189.001325) [DOI] [Google Scholar]
- 13.Geagea L, Huber L, Sache I. 1999. Dry-dispersal and rain-splash of brown (Puccinia recondita f.sp. tritici) and yellow (P. striiformis) rust spores from infected wheat leaves exposed to simulated raindrops. Plant Pathol. 48, 472–482. ( 10.1046/j.1365-3059.1999.00372.x) [DOI] [Google Scholar]
- 14.Bourouiba L, Dehandschoewercker E, Bush JWM. 2014. Violent expiratory events: on coughing and sneezing. J. Fluid Mech. 745, 537–563. ( 10.1017/jfm.2014.88) [DOI] [Google Scholar]
- 15.Brennan RM, Fitt BDL, Taylor GS, Colhoun J. 1985. Dispersal of Septoria nodorum pycnidiospores by simulated raindrops in still air. Phytopathology 121, 281–290. ( 10.1111/j.1439-0434.1985.tb00805.x) [DOI] [Google Scholar]
- 16.Fatemi F, Fitt BDL. 1983. Dispersal of Pseudocercosporella herpotrichoides and Pyrenopeziza brassicae spores in splash droplets. Plant Pathol. 32, 401–404. ( 10.1111/j.1365-3059.1983.tb02854.x) [DOI] [Google Scholar]
- 17.Fitt BDL, Bainbridge A. 1984. Effect of cellulose xanthate on splash dispersal of Pseudocercosporella herpotrichoides spores. Trans. Br. Mycol. Soc. 82, 570–571. ( 10.1016/S0007-1536(84)80031-5) [DOI] [Google Scholar]
- 18.Fitt BDL, Lysandrou M. 1984. Studies on mechanics of splash dispersal of spores using Pseudocercosporella herpotrichoides spores. Phytopathogol. Z. 111, 323–331. ( 10.1111/j.1439-0434.1984.tb00777.x) [DOI] [Google Scholar]
- 19.Vidaver AK, Lambrecht PA. 2004. Bacteria as plant pathogens. Plant Health Instructor. St Paul, MN: The American Phytopathological Society. ( 10.1094/PHI-I-2004-0809-01) [DOI] [Google Scholar]
- 20.Walklate PJ. 1989. Vertical dispersal of plant pathogens by splashing. Part I: the theoretical relationship between rainfall and upward rain splash. Plant Pathol. 38, 56–63. ( 10.1111/j.1365-3059.1989.tb01427.x) [DOI] [Google Scholar]
- 21.Walklate PJ, Mccartney HA, Fitt BDL. 1989. Vertical dispersal of plant pathogens by splashing. Part II: experimental study of the relationship between raindrop size and the maximum splash height. Plant Pathol. 38, 64–70. ( 10.1111/j.1365-3059.1989.tb01428.x) [DOI] [Google Scholar]
- 22.Yang X, Madden LV, Wilson LL, Ellis MA. 1990. Effects of surface topography and rain intensity on splash dispersal of Collectotrichum acutatum. Phytopathology 80, 1115–1120. ( 10.1094/Phyto-80-1115) [DOI] [Google Scholar]
- 23.Hoberg HM. 2002. Patterns of splash dispersed conidia of Fusarium poae and Fusarium culmorum. Eur. J. Plant Pathol. 108, 73–80. ( 10.1023/A:1013936624884) [DOI] [Google Scholar]
- 24.Reynolds KM, Madden LV, Reichard DL, Ellis MA. 1989. Splash dispersal of Phytophthora cactorum from infected strawberry fruit by simulated canopy drip. Phytopathology 79, 425–432. ( 10.1094/Phyto-79-425) [DOI] [Google Scholar]
- 25.Madden LV. 1992. Rainfall and the dispersal of fungal spores. Adv. Plant Pathol. 8, 39–79. [Google Scholar]
- 26.Madden LV, Yang X, Wilson LL. 1996. Effects of rain intensity on splash dispersal of Collectotrichum acutatum. Phytopathology 86, 864–874. ( 10.1094/Phyto-86-864) [DOI] [PubMed] [Google Scholar]
- 27.Huber L, Mccartney HA, Fitt BDL. 1997. Influence of target characteristics on the amount of water splashed by impacting drops. Agric. Forest Meteorol. 87, 201–2011. ( 10.1016/S0168-1923(97)00016-6) [DOI] [Google Scholar]
- 28.Huber L, Mccartney HA, Fitt BDL. 2006. Chapter 16: environmental biophysics applied to the dispersal of fungal spores by rain-splash. In The epidemiology of plant diseases (eds Cooke BM, Gareth-Jones D, Kaye B.), pp. 417–444. Dordrecht, The Netherlands: Springer. [Google Scholar]
- 29.Ntahimpera N, Madden LV, Wilson LL. 1997. Effect of rain distribution alteration on splash dispersal of Colletotrichum acutatum. Phytopathology 87, 649–655. ( 10.1094/PHYTO.1997.87.6.649) [DOI] [PubMed] [Google Scholar]
- 30.Saint-Jean S, Testa A, Madden LV, Huber L. 2006. Relashionship between pathogen splash dispersal gradient and weber number of impacting drops. Agric. Forest Meteorol. 141, 257–262. ( 10.1016/j.agrformet.2006.10.009) [DOI] [Google Scholar]
- 31.Travadon R, Bousset L, Saint-Jean S, Brun H, Sache I. 2007. Splash dispersal of Leptosphaeria maculans pycnidiospores and the spread of blackleg on oilseed rape. Plant Pathol. 56, 595–603. ( 10.1111/j.1365-3059.2007.01572.x) [DOI] [Google Scholar]
- 32.Williams RH, Whipps JM, Cooke RC. 1998. Splash dispersal of Coniothyrium minitans in the glasshouse. Annu. Appl. Biol. 132, 77–90. ( 10.1111/j.1744-7348.1998.tb05186.x) [DOI] [Google Scholar]
- 33.Shaw MW. 1987. Assessment of upward movement of rain splash using a fluorescent tracer method and its application to the epidemiology of cereal pathogens. Plant Pathol. 36, 201–213. ( 10.1111/j.1365-3059.1987.tb02222.x) [DOI] [Google Scholar]
- 34.Lovell DJ, Parker SR, Van Peteghem P, Webb DA, Welham SJ. 2002. Quantification of raindrop kinetic energy for improved prediction of splash-dispersed pathogens. Phytopathology 92, 497–503. ( 10.1094/PHYTO.2002.92.5.497) [DOI] [PubMed] [Google Scholar]
- 35.Yang X, Madden LV. 1993. Effect of ground cover, rain intensity, and strawberry plants on splash of simulated raindrops. Agric. Forest Meteorol. 65, 1–20. ( 10.1016/0168-1923(93)90035-G) [DOI] [Google Scholar]
- 36.Yang X, Madden L, Reichard DL, Fox RD, Ellis MA. 1991. Motion analysis of drop impaction on a strawberry surface. Agric. Forest Meteorol. 56, 67–92. ( 10.1016/0168-1923(91)90105-Y) [DOI] [Google Scholar]
- 37.Yarin AL. 2006. Drop impact dynamics: splashing, spreading, receding, bouncing. Annu. Rev. Fluid Mech. 38, 159–192. ( 10.1146/annurev.fluid.38.050304.092144) [DOI] [Google Scholar]
- 38.Gilet T, Bourouiba L. 2014. Rain-induced ejection of pathogens from leaves: revisiting the hypothesis of splash-on-film using high-speed visualization. Integr. Comp. Biol. 54, 974–984. ( 10.1093/icb/icu116) [DOI] [PubMed] [Google Scholar]
- 39.Vogel S. 2012. The life of a leaf. Chicago, IL: University of Chicago Press. [Google Scholar]
- 40.Dong X, Zhu H, Yang X. 2013. Three-dimensional imaging system for analyses of dynamic droplet impaction and deposit formation on leaves. Trans. ASABE 56, 1641–1651. [Google Scholar]
- 41.Eggers J, Villermaux E. 2008. Physics of liquid jets. Rep. Prog. Phys. 71, 036601 ( 10.1088/0034-4885/71/3/036601) [DOI] [Google Scholar]
- 42.Marshall JS, Palmer WMcK. 1948. The distribution of raindrops with size. J. Meteorol. 5, 165–166. () [DOI] [Google Scholar]
- 43.O'Brien V. 1961. Why raindrops break up—vortex instability. J. Meteorol. 18, 549–552. () [DOI] [Google Scholar]
- 44.Young KC. 1975. The evolution of drop spectra due to condensation, coalescence and breakup. J. Atmos. Sci. 32, 965–973. () [DOI] [Google Scholar]
- 45.Villermaux E, Bossa B. 2009. Single-drop fragmentation determines size distribution of raindrops. Nat. Phys. 5, 697–702. ( 10.1038/nphys1340) [DOI] [Google Scholar]
- 46.Hinds WC. 1999. Aerosol technology: properties, behavior, and measurement of airborne particles. Hoboken, NJ: John Wiley and Sons, Inc. [Google Scholar]
- 47.Bourouiba L, Bush JWM. 2013. Drops and bubbles. Chapter 32 in handbook of environmental fluid dynamics volume 1: overview and fundamentals. London, UK: Taylor and Francis Book Inc. [Google Scholar]
- 48.Gilet T, Bush JWM. 2012. Droplets bouncing on a wet, inclined surface. Phys. Fluids 24, 122103 ( 10.1063/1.4771605) [DOI] [Google Scholar]
- 49.de Langre E. 2008. Effects of wind on plants. Annu. Rev. Fluid Mech. 40, 141–168. ( 10.1146/annurev.fluid.40.111406.102135) [DOI] [Google Scholar]
- 50.Enserink M, Hines PJ, Vignieri SN, Wigginton NS, Yeston JS. 2013. The pesticide paradox. Science 341, 728–729. ( 10.1126/science.341.6147.728) [DOI] [PubMed] [Google Scholar]


