

Abstract
Epidemic trajectories and associated social responses vary widely between populations, with severe reactions sometimes observed. When confronted with fatal or novel pathogens, people exhibit a variety of behaviours from anxiety to hoarding of medical supplies, overwhelming medical infrastructure and rioting. We developed a coupled network approach to understanding and predicting social response. We couple the disease spread and panic spread processes and model them through local interactions between agents. The social contagion process depends on the prevalence of the disease, its perceived risk and a global media signal. We verify the model by analysing the spread of disease and social response during the 2009 H1N1 outbreak in Mexico City and 2003 severe acute respiratory syndrome and 2009 H1N1 outbreaks in Hong Kong, accurately predicting population-level behaviour. This kind of empirically validated model is critical to exploring strategies for public health intervention, increasing our ability to anticipate the response to infectious disease outbreaks.
Keywords: coupled networks, social response, epidemic spreading, data-driven models, panic spreading
1. Introduction
Mathematical models together with increased computational power and data availability have improved our ability to predict and control epidemics. The next frontier is to unravel how diseases shape behavioural norms [1,2]. The public response to a disease outbreak is usually calm and orderly [3]. In rare cases, however, the outbreak of disease can trigger social disturbances, including panic, rioting, hoarding of medical supplies, fight from the area or violence against members of groups believed to have or carry the disease [4–9]. Current large-scale computational models range from high-level, stochastic metapopulation models [10] to parameter-rich, agent-based models [11] that consider demographics, mobility and epidemiological data, as well as disease-specific mechanisms. However, by identifying the fundamental mechanisms of the system, it is still possible to effectively predict the outcomes of epidemics with few parameters. In particular, network mobility information has shown that effective distances can successfully predict the timing of global disease outbreaks [12]. In the domain of behavioural responses to disease, individuals are assumed to take into account two types of information [13,14]: (i) local information, which is generated locally and communicated via social connections [15–18], and (ii) global information, which depends on extrinsic factors that affect the entire population [19,20]. The coupling of disease contagion and social contagion processes is a pressing need, as the joint dynamics of such systems often differ from what would be expected from either process operating in isolation [1,2]. Nevertheless, the variations of social reactions to the same disease have not yet been considered. Here we incorporate the social psychology of risk behaviour into disease and information spread modelling techniques to explain how disease transmission can give rise to social responses.
Most current models of disease and information spread assume that individuals in the population are rational actors, who assess the likelihood of infection and take protective action accordingly. While this assumption may hold for some health behaviours, it neglects the emotional component and the social context of health decision-making [21]. We develop a coupled network model of the joint spread of disease and social response, where the spread of social response is based on the amplification of risk framework developed by Kasperson et al. [22]. This framework assumes that perceptions about the risk of disease are formed within a social context and factors such as the predictability of the disease risk and the society's familiarity with the disease will affect how the disease is perceived. The perceived risk of infection is therefore not necessarily the same as the true likelihood of infection. In our model, amplification of risk-related messages in the media and in interpersonal communication can provoke social responses, even when the likelihood of infection is quite low. We demonstrate the ability of the model to replicate real-world social responses to diseases, as seen in Hong Kong during the 2003 severe acute respiratory syndrome (SARS) outbreak and Mexico City at the beginning of the 2009 H1N1 pandemic. We demonstrate how diseases that are unexpected or unfamiliar to local experts can trigger social responses, particularly when these diseases are clinically severe or have unusually high morbidity or mortality.
2. Causes of social response
We define a social response as a behavioural or emotional manifestation of concern about disease. Since social responses can impede the ability of responders to deliver assistance and can have high economic and social costs, there is interest in better understanding why they occur. Biosurveilliance experts associate social responses with a combination of several conditions, including novelty to the society in question, clinical severity, availability of countermeasures and extent of spread [8,9]. The social amplification of risk framework affirms the role of these conditions and suggests a possible mechanism [22]. The framework asserts that risk-related information is often communicated in such a way that the perceived risk of an event is amplified. Amplification of risk is particularly likely when the volume of communication is high, facts are disputed, there is dramatization and the risk is novel or not well understood. In the context of social response to disease outbreaks, Kasperson's framework suggests that commonplace diseases are unlikely to produce risk amplification, whereas novel, severe diseases, such as SARS or MERS, may provoke amplification, since the public feels that the risk is unpredictable and uncontrollable. Our model demonstrates risk amplification when the disease is novel or clinically severe and also when the disease is highly infectious and can spread quickly through the population, overwhelming the medical infrastructure.
We analysed historical biosurveillance data provided by Ascel Bio (AscelBio. http://ascelbio.com), a biosurveillance company that gathers data on infectious disease outbreaks. The data consist of 11 926 near-real-time, multi-source reports on disease outbreaks. These data cover a time frame of 1 year from May 2008 to May 2009 and include over 200 countries and 300 diseases. The reports describe the social response associated with the disease as well as other features of the outbreak, such as where the outbreak took place and what steps were taken to contain it. The overall incidence of social response in the data was 5%.
In the database, the incidence of social response in countries with little prior experience with the disease was consistently higher than in endemic countries, even if the rate of spread was lower. For example, social response occurred in over 10% of dengue fever outbreaks in Latin America where dengue fever is relatively novel, but only in 1% of outbreaks in Southeast Asia where dengue fever is endemic. The observed difference was statistically significant (Pearson's χ2-test: χ2 = 11.0, d.f. = 1, p < 0.001). We also considered the role of local experts' familiarity with the disease in question. Lack of familiarity is usually a mark of novelty. Using text parsing, Ascel Bio coded the reports based on whether the disease was unknown ormysterious to local experts and whether the outbreak was unusual or atypical for the region. As shown in figure 1, outbreaks that involved diseases that were unusual or unknown in the region were associated with social response 16% of the time, compared with only 4% of the time for outbreaks without those properties, a statistically significant difference (Pearson's χ2-test: χ2 = 148.1, d.f. = 1, p < 0.001). Clinical severity was also a significant predictor of anxiety. Diseases were grouped based on human disease biosafety levels (BSLs) [23]. BSL describes the level of danger associated with working with a particular microbe and ranges from 1 (unlikely to infect human adults) to 4 (severe or fatal disease without available treatment). Diseases with BSL-4 are significantly more likely to have a social response than diseases with lower BSL (Pearson's χ2-test: χ2 = 26.7, d.f. = 3, p < 0.001; figure 1). BSL-4 diseases were associated with social response 17% of the time, whereas social response occurred in only 5% of outbreaks of diseases with lower BSL. In other words, the data indicate that the most severe diseases are more likely to be associated with social response than less severe diseases.
Figure 1.
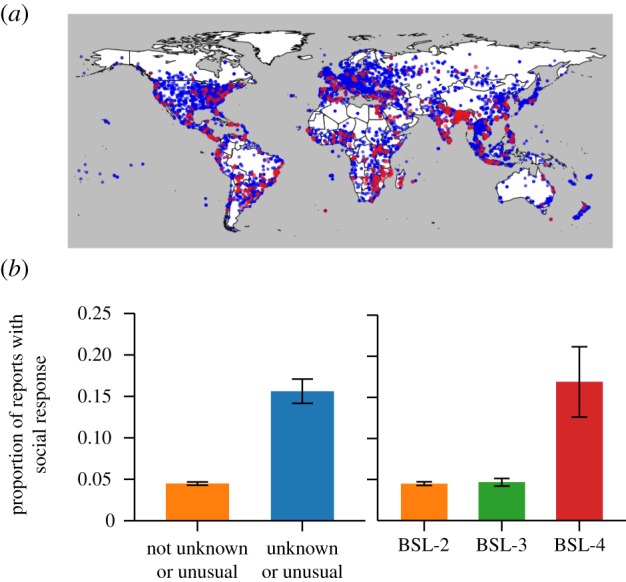
Social response most frequently occurs when the disease is novel to the region or clinically severe. (a) The 11 926 disease outbreaks recorded by Ascel Bio between May 2008 and 2009 are shown. The majority of events were not associated with social response (blue); however, there were regional clusters of events with social response (red). (b) If a disease is unusual or atypical in a region or seen as unknown or mysterious to local experts, there is an increased likelihood of social response. Outbreaks of diseases with the highest BSL are likely to have social responses. BSL-4 diseases are severe and fatal, with no available treatments.
3. Material and methods
The progression of disease and social response through the social network is simulated using two separate agent-based models [24], linked by a coupling mechanism. We consider individuals in a population as agents in a network. These individuals are connected to each other through social ties, which are represented by the edges of the network. The disease spread network and social response spread network are permitted to differ in our model. Details on the networks used in our simulations are provided in the electronic supplementary material.
The agents repeatedly interact according to behavioural rules, which govern the spread of disease and social response. The disease and social response are assumed to spread independently, coupled by an interaction rule; when an agent becomes infected, her social response level is increased to reflect the perceived risk of the disease to the society in question. Specifically, the social response of the agent is set to the disease risk index,  , which represents the society's familiarity with the disease, the degree to which the disease is unexpected, the clinical presentation of the disease and the method and rate of spread. Higher values of κ indicate greater perceived risk, and, consequently, greater amounts of amplification. For example, the common cold in North America, a familiar and mild disease, would have κ = 0.5, whereas SARS, a novel and highly fatal disease, would have a high value, such as κ = 0.95. The likelihood of agents experiencing heightened social response increases when they interact with the sick, with agents who already have heightened social response or when they receive a signal from the media that the disease is a threat. The structure and dynamics of the model are shown in figure 2 and will be described in more detail in the sections that follow.
Figure 2.

Illustration of model dynamics. (a) Social response and disease are transmitted on two different graphs. The spread of disease fuels increased social response. (b) At every time period (i) the disease transmission process spreads infection through the network, (ii) newly infected agents increase their social response to κ, and (iii) social response is communicated between neighbours and via a signal from the media.
3.1. Disease spread dynamics
We implement a susceptible, infected, recovered (SIR) model [25], adapted for agent-based modelling [26]. The infection spreads through pair-wise interactions between infected agents and their neighbours on the disease network. Each agent's disease state at time t is represented by  , where S = susceptible, I = infected and R = recovered. The model is initialized with almost all agents in a susceptible state. Agents become infected through contact with infected neighbours on the disease network. At time t, an infected agent infects each of her susceptible neighbours, independently, with probability β, that is, if Xi(t) = I, Xj(t) = S and i and j are neighbours on the disease network, then
| 3.1 |
Following infection, agents recover after TR time periods, where the parameter TR is set to reflect the time that infected persons continue to circulate in the network. Specifically, if Xi(t − 1) = S and Xi(t) = I, then
| 3.2 |
In the SIR model, the disease will grow into an epidemic if the infection rate is sufficiently larger than the recovery rate [26]. Since severe diseases frequently result in behavioural changes in the population that reduce the spread of disease, we assume that after the cumulative number of cases in the population has surpassed an intervention threshold, τ, agents will reduce their disease-spreading contacts in the population until the outbreak has ended. We model this contact reduction by randomly removing edges from the disease graph. At each time period, each edge in the disease graph has probability η of being removed for that time period and probability 1 − η of remaining in the graph, independent of previous time periods and other edges. Removal of edges in this manner is equivalent to a reduction in the effective infection rate to β × (1 − η).
3.2. Social response spread dynamics
In addition to the disease state, Xi(t), each agent i has a value, Yi(t), associated with his social response at time t. The social response, Yi(t), is treated as a continuous random variable in the range 0–1. A social response of 0 indicates no anxiety and no behavioural symptoms. A social response of 1 indicates severe anxiety or behavioural manifestations of concern about disease, such as panic buying or participating in a protest. In this model, we do not differentiate between behavioural and non-behavioural responses but consider both types of social response to be part of the same continuum. An agent's social response can be changed in one of three ways. First, agents are influenced by their neighbours on the social network and will probabilistically update their social responses to be more similar to their neighbours'. Second, if the disease is actively spreading, agents can receive an excitatory signal from the media, resulting in increased social response. Finally, immediately upon infection, the social responses of infected agents are increased to κ. Thereafter, the social responses of infected agents are allowed to change according to the social response update rules. Heightened social response spreads through the population via two mechanisms: (i) when the disease is novel to the region or is perceived as being particularly threatening, media influence spreads concern through the population, and (ii) when communicating with their neighbours, agents are biased towards adopting the opinions of their more concerned neighbours, rather than the most calm ones.
3.2.1. Media signal
The media plays an important role in communicating risk messages to the public. Young et al. [27] paired high media exposure and low media exposure diseases on the basis of mode of transmission, symptoms, mortality and prevalence. They found that infectious diseases that receive extensive media attention are considered to be more severe than diseases that do not receive such attention. Thus, we postulate that media attention will increase concern about disease and that diseases that are more novel and severe will have larger media signals.
Let NI(t) be the number of infected agents at time t. Then, the global media signal at time t, M(t), is defined as follows:
| 3.3 |
Let Mi(t) be the media signal received by agent i. Each agent receives the media signal with probability p. Thus,
| 3.4 |
Media amplifies concern over the disease when many people are infected in the present compared with the past. In general, a non-zero media signal is sent when the disease is actively spreading in the population. At the end of the outbreak, when there are only a few cases remaining, a media signal will not be sent.
3.2.2. Social response update
At time t, agent i's social response updates according to the following two steps, applied sequentially:
Step 1. Social response exchange. We use a modified version of the DeGroot model to describe how social responses are communicated between neighbours [28]. For each neighbour j of node i, with probability q, j communicates with i at time t. If j communicates with i, Iij = 1, otherwise Iij = 0. For all nodes, i, Iii = 1. Let wj(t) be the weight assigned to the social response of node j at time t. Agents are given a bias toward listening to neighbours that are more concerned about the disease. Therefore,
| 3.5 |
Then the social response of node i following step 1 is given by
 |
3.6 |
where Mi(t) is the media signal received by agent i at time t. Each agent's social response after step 1 is a weighted average of its neighbour's social responses plus the media signal received by that agent. Note that the hyperbolic tangent is used to restrict the social responses to be within the range [0,1].
Step 2. Social response decay. Decay reflects the eventual cease of panic as the disease spread tapers off. Following step 2, agent i's social response level is given by
| 3.7 |
for some constant  . Following the social response update, the next time period begins and the disease and social response updates are repeated.
3.3. The joint diffusion of disease and social response
Agents who are infected generate social response and communicate this response to their neighbours. During the time period in which agent i is infected, i's social response is set to κ. More precisely,
| 3.8 |
The model is implemented by simulating the disease-state transitions followed by social response-state transitions. Thus, at each time t, Xi(t) is updated for each agent i. Then, Yi(t) is updated, first by setting the social response of newly infected agents to κ and then by communication among agents and reception of a signal from the media.
3.4. Simulation design
To validate the model's performance, we simulated the joint spread of disease and social response during the SARS and H1N1 outbreaks in Hong Kong in 2003 and 2009, respectively, and the two waves of H1N1 infection that affected Mexico City in 2009. The Hong Kong simulations were selected to illustrate how novel and severe diseases with extremely low incidence can result in a large social response, while diseases that are not perceived to be as threatening frequently produce little social response, even if they affect a large portion of the population. These simulations were compared against longitudinal survey data taken at the time of the outbreaks, allowing for precise validation of the results. The Mexico City simulations were selected because they illustrate how the response to the same disease can change when there are changes in the disease's perceived novelty and severity. These simulations were qualitatively compared with news reports from the time period and quantitatively compared against an index of Google Internet search volume for influenza. Formal survey data are quite rare and were not available for the Mexico City H1N1 outbreaks.
We also explored the parameter space to confirm that the model produced a social response under the conditions predicted by the social amplification of risk framework. We show the results of two simulation studies, one demonstrating that media influence can produce social response when the disease has high perceived risk and the second demonstrating that a social response can occur when the disease spreads quickly through a large portion of the population.
The H1N1 and SARS simulations were conducted with 400 000 agents and 100 model realizations, and the parameter exploration simulations were conducted with 15 000 agents and 500 model realizations. Each realization was allowed to run until the disease was no longer spreading. For each realization, we recorded the number of new infections at each time t as well as the mean social response of agents in the network. Realizations were initialized with a randomly selected agent as the initial infected agent. If this agent infected no other agents before recovering, the realization was repeated.
The H1N1 and SARS simulations were used to demonstrate the model's ability to predict social response for real disease outbreaks. First, we fit the simulated disease spread to the observed disease spread. Let the expected new infections for each day be the number of new infections for that day averaged over all model realizations. We selected disease parameters such that the simulated expected new infections for each day approximated the daily number of new infections observed in the outbreak. Then, we manually estimated κ based on the society's perception of the disease at the time of the outbreak. We ran the simulations and calculated the expected mean social response for each day by averaging the mean social response over the model realizations. Finally, we compared the simulated expected mean social response with the available data on how the society responded to the outbreak. Overall, the model achieved high predictive accuracy. The parameters used in the H1N1 and SARS simulations are shown in table 1.
Table 1.
Disease transmission and social response parameters used in case study simulations.
| Mexico City |
Hong Kong |
||||
|---|---|---|---|---|---|
| H1N1, spring 2009 | H1N1, autumn 2009 | SARS, 2003 | H1N1, 2009 | ||
| disease transmission dynamics | |||||
| β | per contact infection probability | 0.258 | 0.243 | 0.255 | 0.239 |
| TR | duration of infective period | 1 day | 1 day | 1 day | 1 day |
| τ | intervention threshold | 100 cases | 800 cases | 3 cases | 800 cases |
| η | edge removal probability | 0.25 | 0.15 | 0.25 | 0.05 |
| social response dynamics | |||||
| κ | disease risk index | 0.75 | 0.60 | 0.95 | 0.60 |
| q | per contact communication probability | 0.50 | 0.50 | 0.50 | 0.50 |
| p | media penetration | 0.05 | 0.05 | 0.05 | 0.05 |
| α | response decay | 0.95 | 0.95 | 0.95 | 0.95 |
4. Results
4.1. Model behaviour: effects of disease severity and incidence
We analysed the model behaviour under different sets of parameters. Consistent with our observations from data, two combinations of model parameters produced social response. Assuming p > 0, a high value of the disease risk index (κ) produced a social response, regardless of the disease spread parameters (β and TR), as media influence drove concern about infection. Since κ represents the perceived novelty and severity of disease, this combination of parameters reflects the situation in which the disease is perceived as highly threatening even though incidence may be relatively low. Examples of diseases with high κ include Ebola, avian influenza and MERS. Outbreaks of these diseases have historically been quite small, but have attracted widespread attention. Figure 3a shows the effect of p and κ on average social response when the disease spread is small. The expected peak mean social response is the largest mean social response observed at any point in the outbreak, averaged over the model realizations. In the absence of media influence, the disease itself did not trigger a social response. For high novelty or severity of disease (κ ≥ 0.7), we observed that even low levels of media penetration (p) produced large social responses (figure 3a). Media had little effect on the social response of the agents when the disease was perceived as neither novel nor severe (figure 3a, κ < 0.7).
Figure 3.

Effects of disease severity and incidence. (a) Media influence: the disease parameters were chosen such that, absent media influence, no social response occurred. When the novelty and severity of the disease were low (small κ), little social response was observed, regardless of media penetration p. When the novelty and severity were high (large κ), media influence resulted in a social response, even at low levels of media penetration. In other words, if diseases lack characteristics that result in high perceived risk of infection, such as novelty, severity or lack of knowledge about treatment or transmission, media will not excite a social response. (b) Large disease spread: an unusually prevalent disease can produce social response even if media penetration is low and the disease is neither novel nor severe (β = 0.281, TR = 1, η = 0.0, κ = 0.60 and p = 0.05).
Alternatively, a large social response can be produced when the disease parameters (β and TR) are set such that infection is very prevalent in the network. In this case, the unexpectedly large spread of disease drives the surge in social response. The 2013 dengue fever outbreak in Singapore is an example of such behaviour [29]. Figure 3b shows a large disease spread resulting in a social response. In this example, removing the coupling mechanism and spreading social response only via the media resulted in a 60% decrease in the expected peak mean social response, compared with the baseline case in which social response was spread via both coupling and media.
4.2. Case study: Hong Kong SARS and H1N1
Hong Kong is a special administrative district of China and home to 7 million people. In 2003, Hong Kong became the epicentre of the severe acute respiratory syndrome outbreak in South Asia. In total, 1755 cases were reported, with 299 deaths [30]. While SARS was spreading in Hong Kong, Leung et al. [31] conducted a series of surveys of the population. The surveys measured anxiety using the State-Trait Anxiety Inventory (STAI) and asked about self-protective behaviours. It was found that at the height of the outbreak in early April, the residents of Hong Kong were experiencing heightened anxiety in response to the spread of SARS (figure 4a, lower left). Over time, as the case count fell, the anxiety scores returned to lower levels. In addition, anxiety during the SARS outbreak had behavioural manifestations. Many residents wore face masks and stayed home from work or school; some engaged in panic buying [7].
Figure 4.

Predicting the social response to SARS and H1N1 in Hong Kong. The simulated number of new infections and simulated social response are shown for (a) the 2003 SARS outbreak and (b) the 2009 H1N1 outbreak. Mean State-Trait Anxiety Inventory (STAI) scores are shown for comparison with the simulated social response. The disease spread was modelled such that the expected number of new infections per day reflected the observed new infections per day. The disease risk index (κ) was set to 0.95 for SARS, reflecting the novelty of the virus, its unexpected appearance in Hong Kong and the high clinical severity of the disease. Residents of Hong Kong considered H1N1 to be a much less severe disease than SARS. Therefore, we set the disease risk index to be lower, 0.60. In these simulations, the widespread media attention directed at SARS helped to fuel a large social response in the population, whereas H1N1 did not produce a social response. The shape of the simulated social response corresponds well with the mean STAI for the SARS outbreak. For the H1N1 outbreak, comparison with the mean STAI indicates that the perceived risk of H1N1 in Hong Kong was slightly overestimated.
In the summer and autumn of 2009, Hong Kong was affected by the global H1N1 pandemic. Compared with SARS, H1N1 affected a large proportion of the population. Using blood tests taken before and after the outbreak, as well as survey data and reports of confirmed cases, Wu et al. [32] estimated that about 11% of the population of Hong Kong was infected with H1N1. Another study found that between 11 and 19% of the population was likely to be infected [33]. Nevertheless, public anxiety was relatively low. One survey found that a majority of residents, 64%, felt that the H1N1 outbreak had had no effect on their daily lives [34]. Another survey found that anxiety was low at all points in the outbreak, with a mean score of about 18 on the STAI (figure 4b, lower right) [35]. This low level of concern was due to the low perceived severity of H1N1. In late April, when H1N1 was spreading in Mexico but had not yet reached Hong Kong, surveyed residents of Hong Kong estimated H1N1 to be about 60% as severe as SARS. As they learned more, the severity estimates were revised downward. When H1N1 finally hit Hong Kong in June, residents believed H1N1 to be only about 15% as severe as SARS [35].
The volume of Google searches for ‘H1N1′ in Hong Kong during 2009 supports the findings about perceived disease severity [36]. The most searches were conducted in late April, before H1N1 had begun to spread locally in Hong Kong. Although there was a spike in search interest in mid-June when local transmission began, search interest in H1N1 declined in Hong Kong over July and August even as the number of cases rose. The residents of Hong Kong appear to have been interested in the threat of a seemingly dangerous disease, but when it actually arrived and was not as severe as feared, interest dissipated. It is also important to note that the arrival of H1N1 in Hong Kong was not a surprise. It was quite clear that H1N1 would have a global footprint, and health officials in Hong Kong had months to prepare their response. The SARS and H1N1 outbreaks are compared in table 2. Observations about the disease severity and incidence of SARS and H1N1 in Hong Kong were incorporated into the choice of model parameters. The model fitting procedure is described in the electronic supplementary material.
Table 2.
Comparison of SARS and H1N1 outbreaks in Hong Kong; disease and social response characteristics.
| SARS, 2003 | H1N1, 2009 |
|---|---|
| disease characteristics | |
| 1755 cases and 299 deaths; a 17% mortality rate [30] | approximately 11% of the population infected [32,33] |
| medical personnel had no prior experience with SARS | medical personnel were familiar with the treatment of influenza and anti-viral drugs were effective |
| the disease's arrival in Hong Kong was unexpected [7] | health officials had months to prepare for H1N1 |
| social response characteristics | |
| high anxiety, about 25 on the STAI [31] | low anxiety, about 18 on the STAI [35] |
| behavioural social response, including panic buying [7] | 64% of residents reported no effect on their daily lives [34] |
Although there were many more cases of H1N1, the simulated social response for H1N1 was much smaller than that for SARS (figure 4), since H1N1 was not perceived to be as severe. Since SARS had low incidence, most agents in the network were unlikely to be personally connected to anyone infected with the disease, making the media signal the primary driver of social response. Indeed, removing the effect of media in the SARS simulations resulted in a 100% decrease in the expected peak mean social response. For the H1N1 simulations, coupling played a more important role in the simulated social response, though media influence was still important. Removing the effects of media resulted in a 65% decrease in the expected peak mean social response compared with the baseline model in which media was active. Removing the coupling mechanism resulted in a 28% decrease.
The simulated social response corresponds well with the available STAI data (figure 4, lower plots). The simulated social response for SARS peaked at a high level at the same time as the peak in cases, then declined over the months that followed, returning to a normal level by June 2003. This behaviour mirrors the trajectory of the mean STAI score in Hong Kong during the time period [31]. The simulated social response for H1N1 rose only slightly during the outbreak and never reached the same level as during the SARS outbreak. If anything, the simulated social response overestimated the social response to H1N1, perhaps indicating a lower value of κ would have been a more suitable prediction. Cowling et al. [35] observed that the mean STAI score was stable near baseline during the entire outbreak. The simulated expected mean social response was positively, but insignificantly, correlated with mean STAI (r = 0.5, d.f. = 14, p = 0.18). The relationship was insignificant due to the low number of observations of mean STAI (five for the SARS outbreak and 11 for the H1N1 outbreak) and the slight overestimate of κ for the H1N1 outbreak in Hong Kong; we will show in §4.3 that the estimate was appropriate for the autumn H1N1 outbreak in Mexico City.
4.3. Case study: H1N1 in Mexico City
In March of 2009, cases of respiratory illness began to surface in La Gloria, Mexico. By April 10, it was reported that 616 people, or 28.5% of the population, had been infected [37].
While it has since been confirmed that multiple respiratory infections were circulating, at the time it appeared that a novel H1N1 influenza virus was responsible for the outbreak. Shortly afterwards, influenza cases began to be reported throughout Mexico. The outbreak was particularly intense in Mexico City where, according to data from the Mexican Social Security Institute, 203 confirmed cases were reported by June 1 [38]. The Mexican government responded to the outbreak in Mexico City with extreme social distancing measures that have been estimated to have reduced disease transmission by between 29% and 37% [38]. Schools, restaurants and entertainment venues were closed, and all public gatherings cancelled [37]. Many businesses voluntarily shut down. There were media reports of widespread panic [39,40].
In late August of 2009, there was a second outbreak of H1N1 in Mexico City corresponding with the return of children from the summer school vacation. By that time, fears that the 2009 influenza pandemic could reach the scale of the 1918–1919 pandemic had largely been alleviated. As a consequence, though many more people were infected in the autumn outbreak, the outbreak was met with relative calm. While the Mexican government continued to encourage hygiene and social distancing of infected individuals, closures were isolated and the disease was allowed to run its course [41]. In Mexico City, approximately 10 times as many cases were confirmed in the autumn H1N1 outbreak, which lasted from late August to early December, than in the spring outbreak, which lasted from April to May [38]; however, the social response to the autumn outbreak was much smaller. The spring and autumn outbreaks are compared in table 3. The disease spread parameters and disease risk index were fit to the distinct dynamics of the spring and autumn outbreaks using the procedure outlined in the electronic supplementary material.
Table 3.
Comparison of spring and autumn outbreaks of H1N1 in Mexico City in 2009; disease and social response characteristics.
| spring outbreak | autumn outbreak |
|---|---|
| disease characteristics | |
| 203 confirmed cases: April 1 to June 1 [38] | 2138 confirmed cases: September 1 to December 31 [38] |
| marked the emergence of a strain of influenza that in the past had caused extreme morbidity and mortality | H1N1 was not as severe as originally feared and there was increased familiarity with the virus |
| social response characteristics | |
| schools, restaurants and entertainment venues closed [37] | no widespread closures or activity restrictions [41] |
| media reports of widespread panic [39,40] | media reports gave little indication of panic or anxiety |
The simulated social responses were in accordance with our observations from media reports about the outbreaks (figure 5). The model predicted a large social response for the spring outbreak. For the significantly larger autumn outbreak, the model predicted low social response. It is important to note that had the Mexican government not implemented extreme contact reduction measures at the beginning of the spring outbreak, there probably would have been many more cases. Nevertheless, given that these measures were in place, it seems that the social response observed was connected to the potential of a large and deadly outbreak, rather than the presence of such an outbreak.
Figure 5.

Predicting the social response to the 2009 autumn and spring outbreaks of H1N1 in Mexico City. The simulated number of new infections and simulated social response are shown for (a) the spring H1N1 outbreak and (b) the autumn outbreak. The Google Trends search index for the term ‘influenza′ in Mexico City is shown for comparison with the simulated social response. The disease spread was modelled such that the expected number of new infections per day reflected the observed new infections per day. For the spring outbreak, the disease risk index (κ) was set to 0.75 to reflect H1N1's novelty and its perceived severity. For the autumn outbreak, we lowered the disease risk index to 0.60, since Mexico City already had experience with H1N1 and H1N1was shown to not be as severe as originally feared. While the number of cases produced in the spring outbreak was relatively low, a large social response resulted. The autumn outbreak, though larger, was met with relative calm. In our model, the social response in the spring outbreak was triggered by heightened media attention brought on by the novelty and perceived severity of the disease. In the autumn, the size of the media signal was reduced and the resulting social response was much smaller. The simulated expected mean social response was strongly correlated with the Google Trends search index for influenza in Mexico City (r = 0.69, d.f. = 32, p < 0.001).
Media played a more important role in spreading social response than did the coupling mechanism for both simulated social responses. Removing the effect of media resulted in a 97% decrease in the expected peak mean social response for the autumn outbreak and a 100% decrease for the spring outbreak. Removing the coupling mechanism resulted in 8% and 5% decreases for the autumn and spring outbreaks, respectively. To the best of our knowledge, quantitative research on the trajectory of social response during these outbreaks has not been completed. Such research will be needed to thoroughly validate the simulated social response curves. Researchers have used Google Trends search indices as an indicator of issue salience [42]. We, therefore, investigated the relationship between the simulated social response and the Google Trends influenza search index for Mexico City [36]. The search index is a normalized measure of the volume of search queries for the term ‘influenza′. We used the index as aproxy for anxiety related to H1N1. The simulated expected mean social response was strongly correlated with the search index (figure 5, lower plots; r = 0.69 d.f. = 32, p < 0.001). There is no significant association between the number of confirmed influenza cases and the influenza search index (r = −0.21, d.f. = 32, p = 0.24), which suggests that the interest in influenza was not primarily driven by people infected with the disease. The index corresponds well with our qualitative analysis of news reports from the time period, and we believe that it at least partially measures social response. An approach to quantitative estimation of social response with greater content validity is needed for better validation of the simulations in the future.
5. Discussion
We have introduced a model of the joint diffusion of social response and disease through a population. It is among the first in the field to explore how the spread of disease influences social processes in a society. This model contributes to the body of knowledge in several ways. Perhaps most importantly, the present model accounts for discrepancies between perceived and actual risk of infection. One might assume that social response to disease spread is proportional to the overall burden of the disease. Under this hypothesis, we would expect that low probability, high severity diseases and high probability, low severity diseases would elicit little social response, yet this is not the pattern observed. Instead, while high probability, low severity diseases, such as seasonal influenza, do not typically elicit social response, high severity, low probability diseases, such as Ebola and SARS, frequently do. Moreover, the same disease can provoke different social responses in different locations or even in the same location at different times, as with H1N1 in Mexico City. Through incorporation of a mechanism for risk amplification, the present model is able to realistically model these scenarios.
The model is one of the first to introduce a mechanism for media influence. Media undoubtedly plays a large role in disseminating information about the threat of disease and, according to the social amplification of risk framework, can be responsible for increasing concern about infection. Bomlitz & Brezis [43] collected data on the number of newspaper articles about different types of diseases. They found that newspaper coverage of a health risk is negatively correlated with the number of deaths from the risk. Novel, low incidence risks, such as SARS and bioterrorism, garner the bulk of attention, while more commonplace risks are comparatively ignored. Our model captures this behaviour. Media actively influences the population when novelty and severity are high, regardless of incidence. We have shown that even when a disease has low incidence and social response does not spread by word of mouth, media influence can produce a social response.
The model is extremely flexible, allowing us to simulate a variety of real-world situations with just a few parameters. We have shown through the simulations of H1N1 in Mexico City and of SARS and H1N1 in Hong Kong that the model can account for large and small social response resulting from changes in novelty and perceived severity of disease. Additionally, the model approach allows us to add additional interventions to prevent disease without extensive modifications. We can then explore what happens when interventions are triggered by heightened social response rather than disease incidence.
We encountered a significant problem while identifying real-world quantitative data about disease-related social anxiety against which to validate the shape and magnitude of the simulated social response curves. Very few studies are currently available. The Hong Kong outbreaks discussed in the paper were selected partially because of availability of such quantitative estimates. More survey studies explicitly measuring characteristics of social response are needed for full validation of the model. Additionally, data from Internet search engines, news sources or social networking sites could be mined to produce a quantitative assessment of social response (see Vaisman et al. [44] for discussion of an initial attempt).
One of the limitations of the model is that the disease risk index (κ) is currently estimated manually, which is a potential source of bias. We are working on developing a data-driven approach to estimate κ, based on early information about the outbreak, the characteristics of the disease and historical data on how similar cultures have responded to similar disease threats. Similarly, more quantitative data on social response are needed to better estimate this parameter.
Eventually, we plan to use this model, not only to explain social response during past disease outbreaks, but to predict if and how social response will spread during future outbreaks. Incorporating mechanisms for analysis of the effects of mitigation measures will further enhance the model's usefulness. These predictions will help policy makers better respond to disease outbreaks, by bringing to their attention when there is risk for social disruption and allowing them to take its cost into account.
Supplementary Material
Funding statement
This research was funded by DTRA contract HDTRA1–12-C-0061.
References
- 1.Bauch CT, Galvani AP. 2013. Social factors in epidemiology. Science 342, 47–49. ( 10.1126/science.1244492) [DOI] [PMC free article] [PubMed] [Google Scholar]
- 2.Ferguson N. 2007. Capturing human behaviour. Nature 446, 733 ( 10.1038/446733a) [DOI] [PubMed] [Google Scholar]
- 3.Glass T, Schoch-Spana M. 2002. Bioterrorism and the people: how to vaccinate a city against panic. Clin. Infect. Dis. 34, 217–223. ( 10.1086/338711) [DOI] [PubMed] [Google Scholar]
- 4.Strong P. 1990. Epidemic psychology—a model. Sociol. Health Ill. 12, 249–259. ( 10.1111/1467-9566.ep11347150) [DOI] [Google Scholar]
- 5.Zarocostas J. 2010. Violence hinders efforts to stem Haiti cholera epidemic as deaths continue to rise. Br. Med. J. 341, c7259 ( 10.1136/bmj.c7259) [DOI] [PubMed] [Google Scholar]
- 6.Kinsman J. 2012. ‘A time of fear’: local, national, and international responses to a large Ebola outbreak in Uganda. Global Health 8, 15 ( 10.1186/1744-8603-8-15) [DOI] [PMC free article] [PubMed] [Google Scholar]
- 7.Cheng C. 2004. To be paranoid is the standard? Panic responses to SARS outbreak in the Hong Kong Special Administrative Region. Asian Perspect. 28, 67–98. [Google Scholar]
- 8.Wilson JM, Polyak MA, Blake JW, Collmann J. 2008. A heuristic indication and warning staging model for detection and assessment of biological events. J. Am. Med. Inform. Assoc. 15, 158–171. ( 10.1197/jamia.M2558) [DOI] [PMC free article] [PubMed] [Google Scholar]
- 9.McGrath JW. 1991. Biological impact of social disruption resulting from epidemic disease. Am. J. Phys. Anthropol. 84, 407–419. ( 10.1002/ajpa.1330840405) [DOI] [PubMed] [Google Scholar]
- 10.Tizzoni M, Bajardi P, Poletto C, Ramasco JJ, Balcan D, Goncalves B, Perra N, Colizza V, Vespignani A. 2012. Real-time numerical forecast of global epidemic spreading: case study of 2009 A/H1N1pdm. BMC Med. 10, 1–31. ( 10.1186/1741-7015-10-165) [DOI] [PMC free article] [PubMed] [Google Scholar]
- 11.Ajelli M, Goncalves B, Balcan D, Colizza V, Hu H, Ramasco JJ, Merler S, Vespignani A. 2012. Comparing large-scale computational approaches to epidemic modeling: agent-based versus structured metapopulation models. BMC Infect. Dis. 10, 1–13. ( 10.1186/1471-2334-10-190) [DOI] [PMC free article] [PubMed] [Google Scholar]
- 12.Brockmann D, Helbing D. 2013. The hidden geometry of complex, network-driven contagion phenomena. Science 342, 1337–1342. ( 10.1126/science.1245200) [DOI] [PubMed] [Google Scholar]
- 13.Funk S, Salathe M, Jansen VAA. 2010. Modelling the influence of human behaviour on the spread of infectious diseases: a review. J. R. Soc. Interface 7, 1247–1256. ( 10.1098/rsif.2010.0142) [DOI] [PMC free article] [PubMed] [Google Scholar]
- 14.Perra N, Balcan D, Goncalves B, Vespignani A. 2011. Towards a characterization of behavior-disease models. PLoS ONE 6, e23084 ( 10.1371/journal.pone.0023084) [DOI] [PMC free article] [PubMed] [Google Scholar]
- 15.Funk S, Gilad E, Watkins C, Jansen VAA. 2009. The spread of awareness and its impact on epidemic outbreaks. Proc. Natl Acad. Sci. USA 7, 1247–1256. ( 10.1073/pnas.0810762106) [DOI] [PMC free article] [PubMed] [Google Scholar]
- 16.Epstein JM, Parker J, Cummings D, Hammond RA. 2008. Coupled contagion dynamics of fear and diseases: mathematical and computational explorations. PLoS ONE 3, e3955 ( 10.1371/journal.pone.0003955) [DOI] [PMC free article] [PubMed] [Google Scholar]
- 17.Meloni S, Perra N, Arenas A, Gomez S, Moreno Y, Vespignani A. 2011. Modeling human mobility responses to the large-scale spreading of infectious diseases. Sci. Rep. 1, 62 ( 10.1038/srep00062) [DOI] [PMC free article] [PubMed] [Google Scholar]
- 18.Evans JA, Fast SM, Markuzon N. 2013. Modeling the social response to a disease outbreak. SBP LNCS 7812, 154–163. ( 10.1007/978-3-642-37210-017) [DOI] [Google Scholar]
- 19.Durham DP, Casman EA. 2012. Incorporating individual health-protective decisions into disease transmission models: a mathematical framework. J. R. Soc. Interface 9, 562–570. ( 10.1098/rsif.2011.0325) [DOI] [PMC free article] [PubMed] [Google Scholar]
- 20.Xiao D, Ruan S. 2007. Global analysis of an epidemic with nonmonotone incidence rate. Math. Biosci. 208, 419–429. ( 10.1016/j.mbs.2006.09.025) [DOI] [PMC free article] [PubMed] [Google Scholar]
- 21.Leppin A, Aro AR. 2009. Risk perceptions related to SARS and avian influenza: theoretical foundations of current empirical research. Int. J. Behav. Med. 16, 7–29. ( 10.1007/s12529-008-9002-8) [DOI] [PMC free article] [PubMed] [Google Scholar]
- 22.Kasperson R, et al. 1988. The social amplification of risk—a conceptual framework. Risk Anal. 8, 177–187. ( 10.1111/j.1539-6924.1988.tb01168.x) [DOI] [Google Scholar]
- 23.US HHS. 2009. Biosafety in microbiological and biomedical laboratories, 5th edn Washington, DC: US GPO. [Google Scholar]
- 24.Bonabeau E. 2002. Agent-based modeling: methods and techniques for simulating human systems. Proc. Natl Acad. Sci. USA 99, 7280–7287. ( 10.1073/pnas.082080899) [DOI] [PMC free article] [PubMed] [Google Scholar]
- 25.Kermack WO, McKendrick AG. 1927. Contribution to the mathematical theory of epidemics. Proc. R. Soc. Lond. A 115, 700–721. ( 10.1098/rspa.1927.0118) [DOI] [Google Scholar]
- 26.Newman MEJ. 2010. Networks: an introduction. Oxford, UK: Oxford University Press. [Google Scholar]
- 27.Young ME, King N, Harper S, Humphreys KR. 2013. The influence of popular media coverage on perceptions of personal and population risk in possible disease outbreaks. Health Risk Soc. 15, 103–114. ( 10.1080/13698575.2012.748884) [DOI] [Google Scholar]
- 28.DeGroot MH. 1974. Reaching a consensus. J. Am. Stat. Assoc. 69, 118–121. ( 10.1080/01621459.1974.10480137) [DOI] [Google Scholar]
- 29.Tiong S, Tan S. 2013. Singapore residents more worried over dengue. The Straits Times. See http://yourhealth.asiaone.com. [Google Scholar]
- 30.WHO. 2004. Summary of probable SARS cases with onset of illness from 1 November 2002 to 31 July 2003. GAR. [Google Scholar]
- 31.Leung G, et al. 2005. Longitudinal assessment of community psychobehavioural responses during and after the 2003 outbreak of severe acute respiratory syndrome in Hong Kong. Clin. Infect. Dis. 40, 1713–1720. ( 10.1086/429923) [DOI] [PubMed] [Google Scholar]
- 32.Wu JT, et al. 2010. The infection attack rate and severity of 2009 pandemic H1N1 influenza in Hong Kong. Clin. Infect. Dis. 51, 1184–1191. ( 10.1086/656740) [DOI] [PMC free article] [PubMed] [Google Scholar]
- 33.Riley S, et al. 2011. Epidemiological characteristics of 2009 (H1N1) pandemic influenza based on paired sera from a longitudinal community cohort study. PLoS Med. 8, e1000442 ( 10.1371/journal.pmed.1000442) [DOI] [PMC free article] [PubMed] [Google Scholar]
- 34.Lau JTF, Griffiths S, Choi KC, Tsui HY. 2009. Widespread public misconception in the early phase of the H1N1 influenza epidemic. J. Infect. 59, 122–127. ( 10.1016/j.jinf.2009.06.004) [DOI] [PubMed] [Google Scholar]
- 35.Cowling BJ, Ng DMW, Ip DKM, Liao Q, Lam WWT, Wu JT, Lau JT, Griffiths SM, Fielding R. 2010. Community psychological and behavioural responses through the first wave of the 2009 influenza A(H1N1) pandemic in Hong Kong. J. Infect. Dis. 202, 867–876. ( 10.1086/655811) [DOI] [PubMed] [Google Scholar]
- 36.Google Trends [Internet]. 2013. See http://google.com/trends/explore.
- 37.US CDC. 2009. Update: novel influenza A (H1N1) virus infection—Mexico, March–May. MMWR 58, 585–589. [PMC free article] [PubMed] [Google Scholar]
- 38.Chowell G, Echevarria-Zuno S, Viboud C, Simonsen L, Tamerius J, Miller MA, Borja-Aburto VH. 2011. Characterizing the epidemiology of the 2009 influenza A/H1N1 pandemic in Mexico. PLoS Med. 8, e1000436 ( 10.1371/journal.pmed.1000436) [DOI] [PMC free article] [PubMed] [Google Scholar]
- 39.Hawley C. 2009. Swine flu spreads panic in Mexico City, USA Today. See http://usatoday30.usatoday.com/news/world/2009-4-25-mexicocity-flu-N.htm.
- 40.Penhaul K. 2009. Swine flu fears stalk the living and the dead in Mexico City. CNN. See http://www.cnn.com/2009/WORLD/americas/05/01/penhaul.mexico.flu/.
- 41.Rodríguez R, Martínez E. 2009. En escuelas, tercer rebrote de AH1N1. El Universal. See http://www.eluniversal.com.mx/primera/33638.html.
- 42.Mellon J. 2013. Where and when can we use Google Trends to measure issue salience? Political Sci. 46, 280–290. [Google Scholar]
- 43.Bomlitz LJ, Brezis M. 2008. Misrepresentation of health risks by mass media. J. Public Health (Oxf) 30, 202–204. ( 10.1093/pubmed/fdn009) [DOI] [PMC free article] [PubMed] [Google Scholar]
- 44.Vaisman E, Fast SM, Cunha MG, Postlethwaite T, Wilson JM, Mekaru SR, Brownstein JS, Markuzon N. 2014. Predicting negative social response to disease outbreaks using biosurveillance and news data. In Proc. of the 2014 INFORMS Workshop on Data Mining and Analytics, San Francisco, CA, 8 November. [Google Scholar]
Associated Data
This section collects any data citations, data availability statements, or supplementary materials included in this article.