Abstract
Numerous diseases have been linked to genetic mutations that lead to reduced amounts or disorganization of arterial elastic fibres. Previous work has shown that mice with reduced amounts of elastin (Eln+/−) are able to live a normal lifespan through cardiovascular adaptations, including changes in haemodynamic stresses, arterial geometry and arterial wall mechanics. It is not known if the timeline and presence of these adaptations are consistent in other mouse models of elastic fibre disease, such as those caused by the absence of fibulin-5 expression (Fbln5−/−). Adult Fbln5−/− mice have disorganized elastic fibres, decreased arterial compliance and high blood pressure. We examined mechanical behaviour of the aorta in Fbln5−/− mice through early maturation when the elastic fibres are being assembled. We found that the physiologic circumferential stretch, stress and modulus of Fbln5−/− aorta are maintained near wild-type levels. Constitutive modelling suggests that elastin contributions to the total stress are decreased, whereas collagen contributions are increased. Understanding how collagen fibre structure and mechanics compensate for defective elastic fibres to meet the mechanical requirements of the maturing aorta may help to better understand arterial remodelling in human elastinopathies.
Keywords: arterial mechanics, elastin, fibulin-5, extracellular matrix, mechanical modelling, cardiovascular
1. Introduction
Numerous diseases, including supravalvular aortic stenosis [1], Marfan syndrome [2] and cutis laxa [3] have been linked to genetic mutations in elastin or elastic fibre proteins (i.e. fibrillin-1, fibulin-5) that lead to decreased amounts or disorganization of elastic fibres in the arterial wall. We have shown that mice with about 60% of normal elastin levels (Eln+/−) are able to adapt to develop suitable cardiovascular function for a normal lifespan. The adaptations include increased blood pressure, decreased arterial diameter and wall thickness, increased arterial length, increased lamellar units, decreased arterial compliance and similar arterial stress–strain relationships [4–6]. Many of the adaptations occur early in maturation and are measurable by postnatal day (P) 7 [7,8]. The adaptations demonstrate that a combination of changes in haemodynamic stresses (i.e. blood pressure), arterial geometry (i.e. diameter, thickness and length) and arterial mechanics (i.e. compliance and modulus) occur during early maturation and may be required to maintain normal cardiovascular function despite reduced amounts of elastin in the arterial wall.
Mature elastic fibres are composed of elastin and up to 30 different elastic fibre proteins [9]. Although the process is not completely understood, a model of elastic fibre assembly has been constructed from in vitro and in vivo data [10]. In this model, soluble tropoelastin is secreted from cells and interacts with an extracellular microfibril scaffold primarily composed of fibrillins and associated glycoproteins. Tropoelastin self-aggregates in a process called coacervation, which may be the first step in forming micro-assemblies of elastin that are visible by electron microscopy in developing arteries. The fibulins regulate maturation of the coacervates and facilitate interaction between tropoelastin and the lysyl oxidase proteins necessary for cross-linking into insoluble elastin. Mice lacking fibulin-5 (Fbln5−/−) have disorganized elastic fibres with large elastin aggregates instead of continuous elastic laminae in the arterial wall [11,12]. Adult Fbln5−/− mice have a normal lifespan and show some of the same cardiovascular adaptations observed in Eln+/− mice, including increased blood pressure, increased arterial length and decreased arterial compliance [13]. Many of the cardiovascular adaptations are measurable by P21 [14], but have not been investigated at younger ages while the elastic fibres are still being assembled.
Elastic fibre assembly occurs during late embryonic and early postnatal development [15]. During this same time period, there are large changes in the haemodynamic stresses on the arterial wall in mice [16,17]. We know that a collection of arterial remodelling behaviours occurs early in maturation when elastin amounts are reduced, but we do not know if the remodelling timeline and behaviours are similar if elastic fibres are compromised through a different genetic mechanism, such as the loss of fibulin-5. Elucidating a pattern of remodelling in mouse models of elastic fibre disease may help us to better understand how physiologic and pathologic arterial remodelling occurs in human elastinopathies. We hypothesize that there is a pattern of arterial remodelling that leads to a set of optimized mechanical properties (i.e. circumferential or axial wall stress, strain or modulus) that must be maintained throughout maturation for Fbln5−/− mice to live a normal lifespan despite having disorganized elastic fibres. We investigate this hypothesis through ex vivo biaxial mechanical testing on ascending aortae from wild-type (WT) and Fbln5−/− mice at P7, soon after the elastic laminae are complete [18], at P21, which is near the peak of elastic fibre protein expression [15], and at P60, when the mouse is considered a young adult and the growth and blood pressure have plateaued [17]. We also use a microstructurally motivated constitutive model to investigate remodelling mechanisms that may be used to maintain the optimized mechanical properties.
2. Material and methods
2.1. Animals and aortic dissection
Male and female Fbln5−/− [19] and WT littermate mice nominally at P7, 21 and 60 were used for all studies. The actual ages ranged from P 7 to 8, 21 to 24 and 60 to 64. Male mice were used for mechanical testing, whereas female mice were used for protein quantification and histology. The sexes were separated because male mice have slightly bigger arteries due to an increased body weight, which affects the pressure–diameter behaviour in mechanical testing. Preliminary results showed that genotype had a consistent effect in both sexes for mechanical testing, protein amounts and structural appearance. The mice were sacrificed by thoracotomy under 2% isoflurane after invasive blood pressure measurements for another study [20]. The chest was opened and images of the ascending aorta in male mice before and after excision were taken with a digital camera attached to a dissecting microscope. The aortic length from the base of the heart to the innominate artery was measured from the in vivo and ex vivo images using ImageJ software (NIH). The male aortae were placed in physiologic saline solution (PSS) and stored in the refrigerator for up to 3 days before mechanical testing [21]. The female aortae were stored dry at −20°C for protein quantification or fixed in 10% formalin for histology. Additional male and female aortas were used for fluorescent imaging.
2.2. Biaxial mechanical testing
Inflation–extension tests were performed as previously described [7,22,23]. Briefly, each aorta was mounted on a pressure myograph system (Danish Myotechnology) in PSS at 37°C, secured with 7–0 silk suture on custom stainless steel cannulae, and stretched to its approximate in vivo length (figure 1). The aorta was preconditioned for three cycles in the circumferential and axial direction to the maximum pressure and stretch. The maximum pressures for P7, 21 and 60 aortae were 120, 160 and 175 mmHg, which represent two to three times the expected mean physiologic pressure for each age [7]. The maximum axial stretch ratio was determined by the in vivo axial stretch ratio and pressure–force behaviour of each aorta and ranged from 1.2 to 1.9. After preconditioning, each aorta was subjected to three constant-length circumferential inflation cycles at different axial stretches to the maximum pressure and three constant-pressure axial extension cycles at different pressures to the maximum axial stretch ratio. The circumferential inflation cycles were automatically programmed in the pressure myograph to increase the pressure in discrete increments and then hold for 8–12 s for the diameter to stabilize, while the axial extension cycles consisted of manual rotation of the micrometre attached to one end of the aorta. The overall circumferential inflation rate was 1–2 mmHg s−1 and the axial extension rate was approximately 20 µm s−1. Lumen pressure, outer diameter, axial force and calculated axial stretch ratio were recorded at 1 Hz for each test cycle. Custom Matlab scripts were used to isolate the third loading cycle for further analyses. Compliance was calculated as the change in diameter divided by the previous diameter and the size of the pressure step. After testing, three rings approximately 0.2 mm thick were cut from each aorta. Care was taken to avoid the region near the sutures used to secure the aorta during testing. The rings were imaged to determine the average unloaded dimensions. A total of 8–13 animals were used for the mechanical testing data at each age and genotype.
Figure 1.
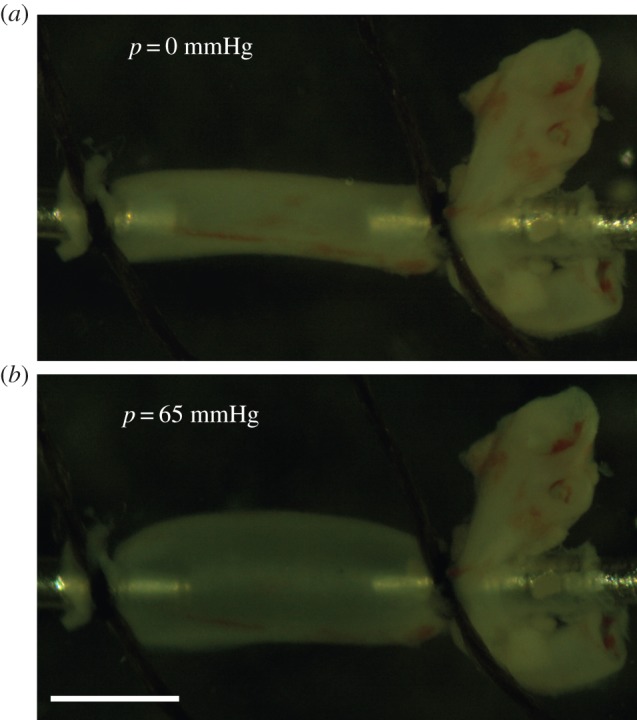
P21 Fbln5−/− aorta mounted in the mechanical test system (Danish Myotechnology), stretched to its approximate in vivo length and inflated with lumen pressures of 0 mmHg (a) and 65 mmHg (b). 65 mmHg is the mean physiologic pressure for P21 mice [20]. The aorta is slipped over custom stainless steel cannulae and secured with 7–0 silk suture. Scale bar, 1 mm. (Online version in colour.)
The pressure range used for mechanical testing varied for each age group and was determined by the mean physiologic blood pressure at each age. We believe that the mechanical behaviour with reference to the in vivo pressure is the most relevant for comparison across age groups, so in the results we normalized the applied experimental pressures to the mean blood pressures for Fbln5−/− and WT mice from our previous study [20]. Mean blood pressures at P7 were not measured, so we assumed that the ratio between the systolic and mean pressures for each genotype at P7 was the average of the ratios for each genotype at P21 and 60. Since there were no significant differences in the mean blood pressures between genotypes, we used the following mean blood pressures at each age: 38.5 mmHg at P7, 64.5 mmHg at P21 and 82.0 mmHg at P60 to normalize the results. These values are consistent with previous data for mean arterial blood pressures in maturing mice [17]. A normalized pressure equal to one in the results corresponds to the mean blood pressure and mechanical behaviour above and below this value can be easily compared across age groups.
2.3. Experimental stress calculations
The aorta was treated as an incompressible cylinder with no shear deformations. The mean circumferential (λθ) and axial (λz) stretch were defined as,
| 2.1 |
where rmid is the loaded mid-wall radius, Rmid is the unloaded mid-wall radius, l is the loaded length and L is the unloaded length. For an incompressible material, the stretch ratio in the radial direction is λr = 1/(λθλz). The mean experimental stresses in the circumferential (σθ,exp) and axial (σz,exp) directions were calculated by
| 2.2 |
where P is the measured lumen pressure, ri is the loaded internal radius (calculated by incompressibility from the unloaded dimensions, loaded outer radius and axial stretch), ro is the measured loaded outer radius, and f is the measured axial force. The stresses in the radial direction (σr) are small compared with the circumferential and axial directions, but can be calculated by equilibrium of forces on the cylinder wall. The incremental circumferential elastic modulus was calculated as the change in circumferential stress divided by the change in circumferential stretch ratio for each pressure step at the in vivo length.
2.4. Constitutive modelling
The inflation and extension of the aorta were described by the deformation gradient tensor (F) and the right Cauchy–Green tensor (C). For an axisymmetric cylinder with no shear deformations, these are defined as
| 2.3 |
and
| 2.4 |
The calculated, passive Cauchy stress is defined by
| 2.5 |
where p is the Lagrange multiplier and W is the strain energy density function [24]. We used a microstructurally motivated strain energy function originally proposed by Holzapfel et al. [25] for describing arterial mechanics. The model includes an isotropic, neo-Hookean matrix (dominated mechanically by the elastic fibres) embedded with two symmetric families of diagonal collagen fibres. We assumed that the contribution of the smooth muscle cells (SMCs) to the passive stress is negligible in the aorta [26]. The total strain energy is represented by the sum of the elastic fibre (We) and collagen fibre (Wc) contributions,
| 2.6 |
| 2.7 |
and
| 2.8 |
where c1, c2 and c3 are material parameters, I1 is the first invariant defined by  , I4 is the fourth invariant for the kth fibre family defined by
  and α represents the angle of the two families of collagen fibres in the unloaded configuration with respect to the circumferential direction.
Based on previous results from maturing WT and Eln+/− aorta [22], additional constraints were imposed on the circumferential stress contributions from elastin (e) and collagen (c) to ensure physiologically relevant results. A penalty function was used to ensure that elastin contributes at least 30% of the total circumferential stress in the mid-pressure, linear region and collagen contributes at least 75% of the total circumferential stress in the high-pressure region. The penalty function is
 |
2.9 |
The beginning/low (PL) and end/high (PH) pressures for the mid-pressure, linear region were defined by inspection of the average pressure–diameter curve for each age and genotype at the in vivo stretch ratio. PL values were the same for each genotype and were equal to 12, 20 and 25 mmHg for P7, P14 and P60, respectively. PH values were higher for WT than Fbln5−/− aorta and were 60 (WT) and 48 (Fbln5−/−), 120 (WT) and 100 (Fbln5−/−), and 125 (WT) and 100 (Fbln5−/−) mmHg for P7, P14 and P60 WT/Fbln5−/− aorta, respectively. These values are similar to those determined by Cheng et al. [22] by calculating the second derivative of an empirical equation fitted to the pressure–diameter data for WT and Eln+/− aorta at the same ages. Application of these constraints does not force the stress contributions to be equal to these values (30% elastin; 75% collagen) and similar results are obtained with a range of constraints from 10–40% elastin contribution and 55–85% collagen contribution.
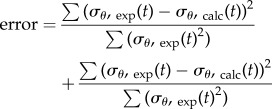
The penalty function was added to an error function to provide a minimum error for fitting the model constants
| 2.10 |
where
 |
2.11 |
Constants (c1, c2, c3 and α) were fitted using the Matlab function fmincon to minimize equation (2.10). The material constants were constrained to the positive domain and α was limited between 0 and 90°. Multiple initial guesses were used to ensure a global minimum was obtained. Only those aortae with six successful mechanical testing protocols were included in the constitutive modelling, which provides five to eight animals per group.
The linearized circumferential modulus (ζθ) [27] was calculated for comparison to the experimental incremental modulus. The linearized axial (ζz) modulus was also calculated to compare properties in each direction
| 2.12 |
and
| 2.13 |
where λθ and λz are the stretch ratios at the mean physiologic blood pressure and in vivo axial stretch ratio.
2.5. Protein quantification
Elastin, collagen and total protein were quantified to compare the amounts of each component to the stress predictions from the constitutive model. The methods were modified from Long & Tranquillo [28] and Wu et al. [29]. Aortae were stored at −20°C until processed in one batch for all ages and genotypes. Standards for elastin (Elastin Soluble, Elastin Products Company) and hydroxyproline (Trans-4-Hydroxy-Lproline, Sigma-Aldrich) were processed along with the aortae. Aortae were placed in glass vials and digested in 0.1 M NaOH. The insoluble elastin pellet was transferred to a new vial and the remaining supernatant was evaporated in a speedvac. The pellet and supernatant were hydrolysed in 6 N HCl, then dried in a speedvac. A ninhydrin assay was used to quantify total protein in the pellet (elastin) and supernatant samples (total protein—elastin) [30]. Hydroxyproline, a major constituent of collagen, was measured through a reaction of the supernatant with Chloramine T [31]. It was assumed that hydroxyproline constitutes 13.4% of mammalian collagen [32]. Absorbance of the standards and the samples for each assay at 570 nm was determined with a microplate reader (SpectraMax). A total of 7–10 animals per group were used for the protein quantification assays.
2.6. Histology and fluorescent imaging
Histology was used to investigate microstructural changes in the aortic wall that may correlate with changes in the mechanical properties. After fixation for 24 h, aortic samples were dehydrated in a graded series of ethanol, embedded in paraffin and sectioned. Sections were stained with H&E to view overall morphology, Verhoeff Van Gieson (VVG) to examine elastic fibres, and picrosirius red (PSR) to visualize collagen organization. Images were taken at 40× magnification. Sections from four to six animals were examined in each group. Number, thickness and spacing of elastic laminae were quantified by converting the VVG image to greyscale, thresholding the image to identify the black staining elastic laminae and white spaces in between, drawing five user-defined lines radially through the wall and using custom Matlab scripts to detect the change in pixel colour from black to white. Results were averaged across the wall and for all radial lines drawn for each cross-section. Intensity of the elastic laminae was quantified by converting the VVG image to greyscale, drawing eight user-defined 45 × 45 µm regions within the media only and creating a greyscale histogram ranging from 0 = black to 255 = white using custom Matlab scripts. The darkest quartile [0–63] of the pixels was binned as ‘black’ and the next quartile (64–127) were binned as ‘dark grey’. The images were analysed by users blind to the age and genotype of the mouse.
Fluorescence microscopy was used to further investigate the structure of elastic laminae and collagen fibres in fresh aortic cross-sections from three to five animals per group. Ascending aortas were frozen in optimal cutting temperature media and a cryostat was used to cut 30 μm thick sections. The sections were incubated for 20 min to stain for elastin and collagen, followed by a 5 min incubation to stain the cell nuclei. For elastin, Alexa Fluor 633 Hydrazide (Life Technologies) was used at a concentration of 0.6 µM [33,34]. For collagen, CNA35 (kindly provided by Magnus Hook, Texas A&M) was labelled with Oregon Green 488 (Life Technologies) according to the manufacturer's protocol and used at a concentration of 5 µM [35]. The nuclei were stained with Hoechst 34580 (Life Technologies) at a concentration of 5 µM. Imaging was performed using a Zeiss 40× oil immersion objective lens (NA 1.3) mounted on a Zeiss LSM 710 confocal microscope. Images were acquired on separate tracks for each dye. To reduce low-frequency noise, line averaging (2 scans) was performed. Post image acquisition processing was performed using ImageJ (NIH) and Zen 2012 (Zeiss).
2.7. Statistics
Data are presented as mean ± s.e.m. The effects of age and genotype were determined using a general linear model (GLM). Two-tailed t-tests with unequal variance between genotypes at each age were performed when genotype had a significant effect in the GLM. All analyses were performed with SPSS software (IBM) and p < 0.05 was considered significant.
3. Results
3.1. Aortic dimensions and in vivo axial stretch
The unloaded diameter, thickness and length of the ascending aorta increase with age, as expected with growth of the animal (table 1). The diameter and thickness are similar between WT and Fbln5−/− aorta at all ages. The unloaded length of the Fbln5−/− aorta is 24–48% greater than WT at all ages. The in vivo axial stretch ratio is reduced 10% in Fbln5−/− aorta at P60.
Table 1.
Unloaded dimensions and in vivo (IV) axial stretch ratio of the ascending aorta in WT and Fbln5−/− mice throughout early maturation. The outer diameter and thickness were measured from cut rings of arterial sections after mechanical testing, whereas the length and stretch ratio were measured from images of the aorta before and after dissection. Data are presented as mean ± s.e.m. N = 8–13 for each group.
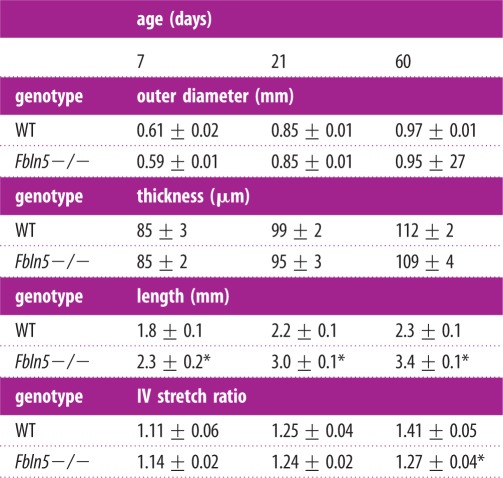 |
*p ≤ 0.05 for Fbln5−/− compared to WT.
3.2. Biaxial mechanical testing
The normalized pressure–diameter, pressure–force and pressure–compliance curves for each aorta at the in vivo axial stretch ratio are shown in figure 2. The diameters and forces increase with age. Fbln5−/− aortic diameters are similar to WT at low pressures, but diverge at high pressures to become about 10% smaller in P21 and P60 mice (figure 2a). The axial forces are 40–100% lower than WT in P21 and P60 Fbln5−/− aortae (figure 2b). There is a reduction in overall compliance of Fbln5−/− aorta at high pressures, as well as a shift in the compliance peak to lower pressures (figure 2c). Owing to the shift in the peak of the curve, the compliance of P7 Fbln5−/− aorta is 40–90% higher than WT at low pressures and 30–40% lower than WT at high pressures. For P21 and P60 mice, the compliance of Fbln5−/− aorta is 40–70% lower than WT at normalized pressures greater than one. Interestingly, the peak compliance remains at about the same normalized pressure throughout maturation for each genotype (normalized pressure approx. 0.8 for Fbln5−/− and approx. 1.3 for WT).
Figure 2.
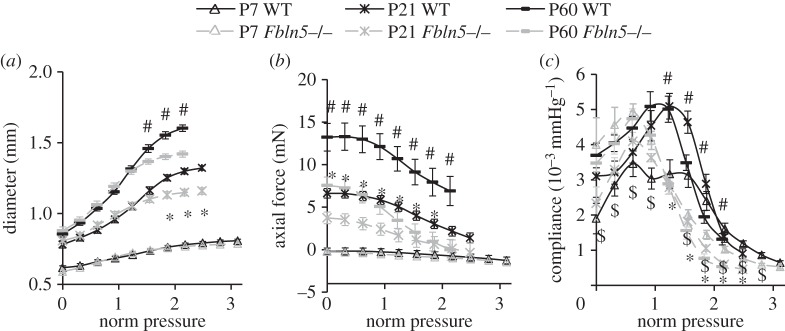
Normalized (norm) pressure versus outer diameter (a), axial force (b) and compliance (c) of the ascending aorta in WT and Fbln5−/− aorta throughout early maturation. A normalized pressure = 1 represents the mean physiologic pressure for each age and genotype [20]. Data were obtained from ex vivo mechanical tests with the aorta held near the in vivo axial stretch ratio. N = 8–13 for each group. ‘$’ denotes p ≤ 0.05 at P7, ‘*’ denotes p ≤ 0.05 at P21 and ‘#’ denotes p ≤ 0.05 at P60 for Fbln5−/− compared to WT.
The experimental circumferential stretch ratio, circumferential modulus, and circumferential and axial stresses at the in vivo axial stretch ratio are plotted versus normalized pressure to determine whether there are consistent values across ages and/or genotypes (figure 3). For the circumferential stretch, modulus and stress (figure 3a–c), there is an increasing trend with age, but similar values across genotypes up to and just beyond the physiologic pressure values (normalized pressure = 1). The physiologic axial stress increases with age and is higher in WT compared with Fbln5−/− aorta at P21 and P60 at all pressure values (figure 3d).
Figure 3.
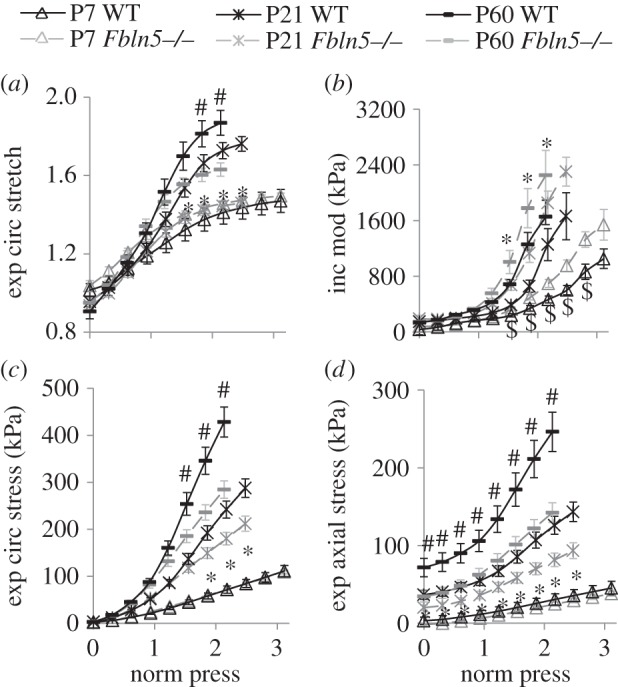
Normalized pressure (norm press) versus experimental (exp) circumferential (circ) stretch ratio (a), incremental modulus (mod) (b), stress (c) and axial stress (d). A normalized pressure = 1 represents the mean physiologic pressure for each age and genotype [20]. Stresses and the stretch ratio were calculated from the mechanical test data and unloaded dimensions. The incremental modulus in the circumferential direction was calculated as the local slope of the stress–stretch ratio curve. N = 8–13 for each group. ‘$’ denotes p ≤ 0.05 at P7, ‘*’ denotes p ≤ 0.05 at P21 and ‘#’ denotes p ≤ 0.05 at P60 for Fbln5−/− compared to WT.
3.3. Constitutive modelling
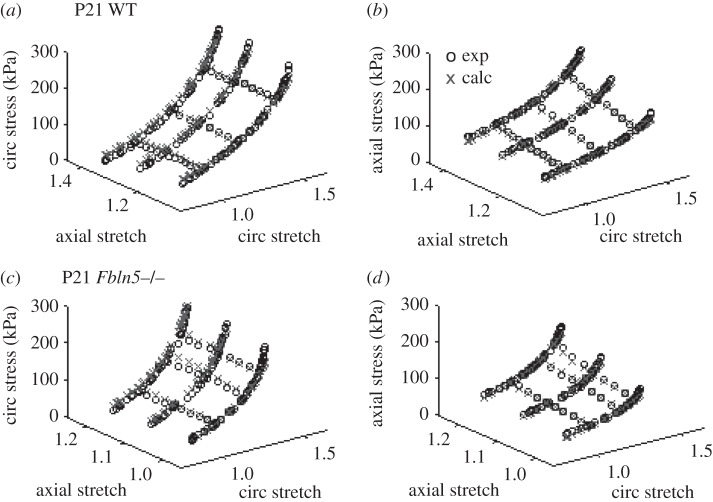
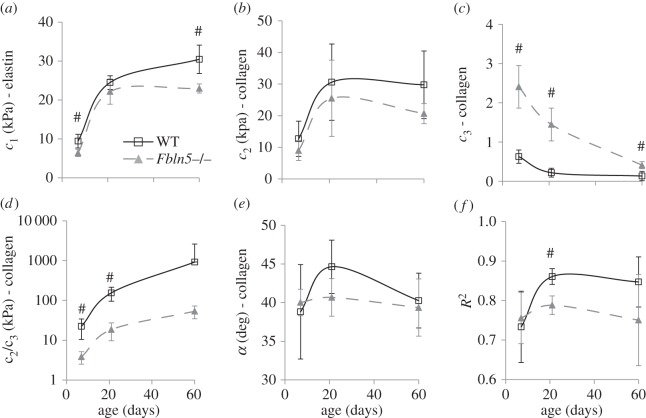
Example fits for the calculated circumferential and axial stresses for all six mechanical testing protocols for a P21 WT and Fbln5−/− aorta are shown in figure 4. The fitted material parameters are shown in figure 5. The material constant for elastin, c1, increases with age as expected since elastic fibres are assembled during early maturation. At P7 and 60, c1 is 25–30% lower in Fbln5−/− aorta compared with WT (figure 5a), consistent with the idea that disorganized elastic fibres contribute less to the aortic wall stress. The first material constant for collagen, c2, increases with age and there are no differences between genotypes at each age (figure 5b). The second material constant for collagen, c3, which is in the exponential term and contributes to the nonlinearity of the collagen mechanical behaviour, decreases with age and is three to seven times larger in Fbln5−/− aorta compared with WT at all ages (figure 5c). The ratio of c2/c3, which is the linear multiplier for the collagen strain energy function, increases with age as expected since collagen fibres are also laid down during maturation. The c2/c3 ratio is six to eight times larger in WT compared with Fbln5−/− aorta at P7 and P21 (figure 5d), showing that the contributions of the linear collagen term are increased in WT aorta. There are no significant differences in the collagen fibre angle between genotypes and α remains around 40° at all ages (figure 5e). The model fits the experimental data reasonably well with an average R2 of 0.79 ± 0.08 for all ages and genotypes (figure 5f).
Figure 4.
Experimental (exp) and calculated (calc) circumferential (circ) (a,c) and axial (b,d) stresses plotted against the circumferential and axial stretch ratios for a representative P21 WT (a,b) and Fbln5−/− (c,d) aorta. The experimental data were collected from ex vivo biaxial mechanical tests. The calculated data were determined from the constitutive model using the experimental stretch ratios and the best-fit material parameters.
Figure 5.
Average fitted constants (a–e) and goodness of fit (R2) (f) for the constitutive model used to describe biaxial mechanical behaviour of WT and Fbln5−/− aorta throughout early maturation. Only those aortae with six successful mechanical test protocols (three inflation protocols at constant axial stretch and three axial stretch protocols at constant pressure) were included in the constitutive modelling. Note that (d) is plotted on a log scale. N = 5–8 per group. ‘#’ denotes p ≤ 0.05 for Fbln5−/− compared to WT.
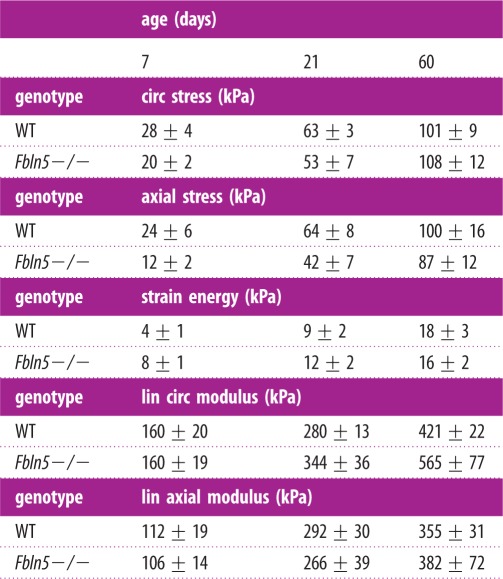
The total calculated circumferential and axial stresses for the model (table 2) at the mean physiologic pressure for each age are similar between genotypes and to the experimental values in figure 3c,d. There is a trend towards the axial stresses being lower than the circumferential stresses in Fbln5−/− aorta, but not in WT aorta. This is consistent with the reduced in vivo axial stretch of the Fbln5−/− aorta, which would presumably unload the aorta in the axial direction and reduce the axial stresses. The total physiologic strain energy, which represents the energy stored in the aorta and available for return upon unloading, is similar between genotypes (table 2). The linearized circumferential and axial moduli, as calculated from the model, increase with age, but plateau in adulthood (table 2). The moduli are similar across genotypes and are in the range of 200–500 kPa and 100–300 kPa for the circumferential and axial directions, respectively. The linearized circumferential modulus is similar to the incremental elastic modulus calculated from the experimental data. The modulus values lie within a narrow range for all ages and despite the disorganized elastic fibre in Fbln5−/− aorta.
Table 2.
Total stresses, strain energies and linearized (lin) moduli calculated from the constitutive model for WT and Fbln5−/− aorta throughout early maturation. The values were determined using the fitted material constants and the stretch ratios corresponding to the mean physiologic blood pressure and the in vivo axial stretch for each artery. The trends for the stresses and the circumferential (circ) modulus are consistent with the experimental data in figure 3. Data are presented as mean ± s.e.m. N = 5–8 per group.
 |
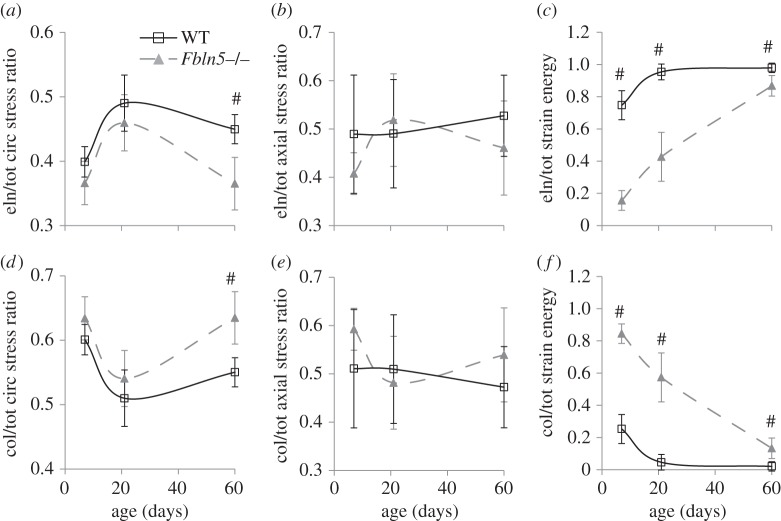
Although the total calculated stresses and strain energies are similar, the stresses and strain energies contributed by the elastin and collagen components vary between genotypes (figure 6). At P60, the ratio of elastin/total circumferential stress is 20% lower (figure 6a), while the ratio of collagen/total circumferential stress is 15% higher (figure 6d) in Fbln5−/− aorta compared with WT. The elastin/total and collagen/total axial stress ratios are similar between genotypes (figure 6b,e). The elastin/total strain energy ratio is 10–80% higher, while the collagen/total strain energy ratio is 3–13 times lower in WT aorta compared with Fbln5−/−. Note that the elastin and collagen stress and strain energy ratios must add up to one, so they are not independent variables. However, the model suggests that the equivalent total stresses and strain energies between WT and Fbln5−/− aorta are made possible by a shift in the stress applied and the strain energy stored in the individual elastin and collagen components.
Figure 6.
Elastin/total (a–c) and collagen/total (d–f) ratios for the circumferential stress (a,d), axial stress (b,e) and strain energy (c,f) calculated from the constitutive model for WT and Fbln5−/− aorta throughout early maturation. The elastin contribution to the total strain energy is decreased and the collagen contribution is increased in Fbln5−/− aorta compared with WT. N = 5–8 per group. ‘#’ denotes p ≤ 0.05 for Fbln5−/− compared to WT.
3.4. Protein content
The ratios of elastin and collagen to total protein in the aortic wall are shown in figure 7. There are no significant differences between the ratios for any age or genotype, although there is a trend towards a reduced elastin ratio in P60 Fbln5−/− aorta compared with WT (p = 0.065). The shape of the elastin/total protein ratio (figure 7a) is similar to the elastin/total circumferential stress ratio (figure 6a), suggesting that the circumferential stress contribution of elastin in the constitutive model is related to elastin protein fraction. The collagen/total protein ratio (figure 7b) does not have the same shape as the collagen/total circumferential stress ratio (figure 6d), suggesting that the circumferential stress contribution of collagen in the constitutive model cannot be directly related to the collagen protein fraction. The nonlinear mechanical behaviour of the collagen fibres complicates direct correlations between protein amount and stress contributions.
Figure 7.
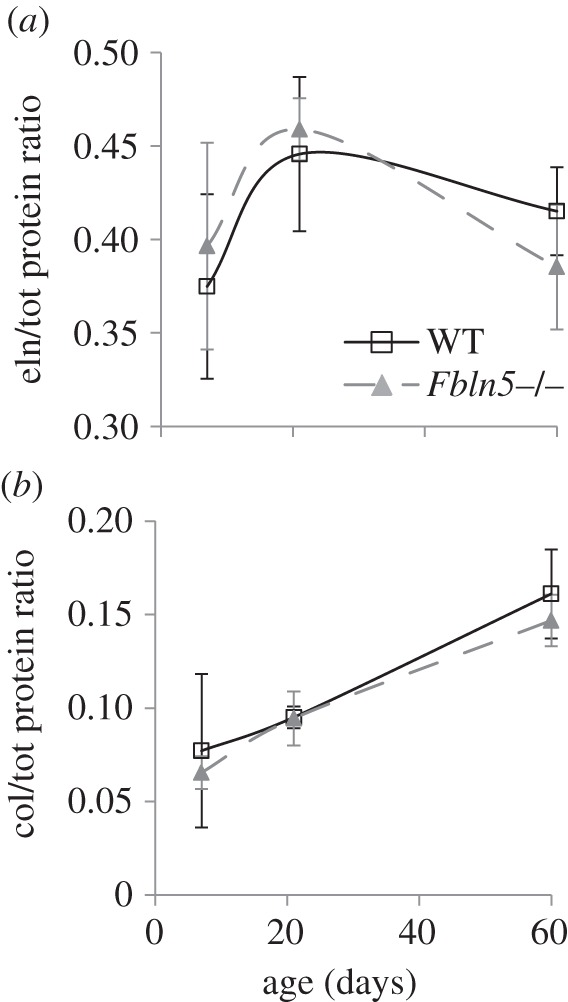
Elastin/total (a) and collagen/total (b) protein ratios for WT and Fbln5−/− aorta throughout early maturation. Aortae were digested with 0.1 M NaOH to separate insoluble elastin from soluble collagen and other proteins. Elastin and total protein were quantified by a ninhydrin assay, while collagen was quantified by a reaction with Chloramine T. N = 7–10/group.
3.5. Imaging
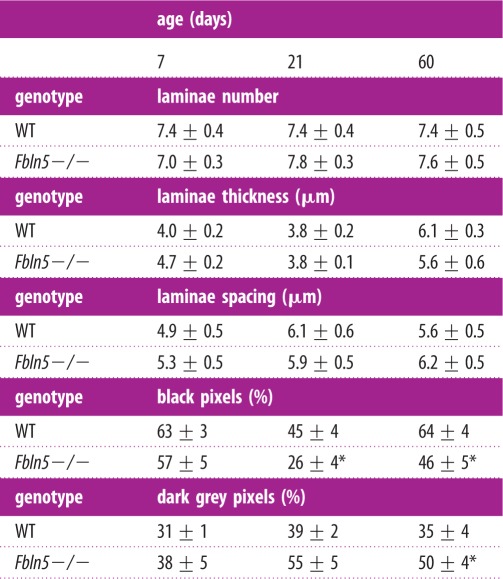
Fbln5−/− aorta shows less distinct elastic laminae than WT, with pink collagen and brown SMCs staining appearing within the black elastic laminae (figure 8a,b). The VVG images were converted to greyscale and a histogram of pixel values was determined (figure 8a and b, inset). The histogram was binned into quartiles of the darkest pixels (black = 0–63) and the next darkest pixels (dark grey = 64–127) (table 3). The Fbln5−/− aortae have 71% and 39% less black staining pixels at P21 and P60 and 31% more dark grey staining pixels at P60 compared with WT. The black staining pixels represent mostly intact elastic laminae (i.e. figure 8a), while the dark grey pixels represent mostly SMCs, collagen and disrupted elastic laminae (i.e. figure 8b). Our data are consistent with disruptions in the elastic laminae in Fbln5−/− aorta that can be seen at higher magnification with electron microscopy [12]. The number, thickness and spacing of elastic laminae were quantified from thresholded greyscale VVG images and there are no significant differences between genotypes (table 3). This method does not highlight differences in intensity or quality of the elastic laminae, as the threshold was individually varied for each aorta to obtain complete black and white layers through the wall thickness. The laminae thickness significantly increases with age, but the number and spacing do not. PSR images show red collagen staining outlining yellow areas where the elastic laminae are located in P60 WT aorta (figure 8c). In P60 Fbln5−/− aorta, the red collagen staining is more diffuse and the outline of the yellow elastic laminae is not as clear (figure 8d), consistent with the VVG images. There are no obvious differences in the size or organization of the SMC nuclei in the H&E images (figure 8e and f).
Figure 8.
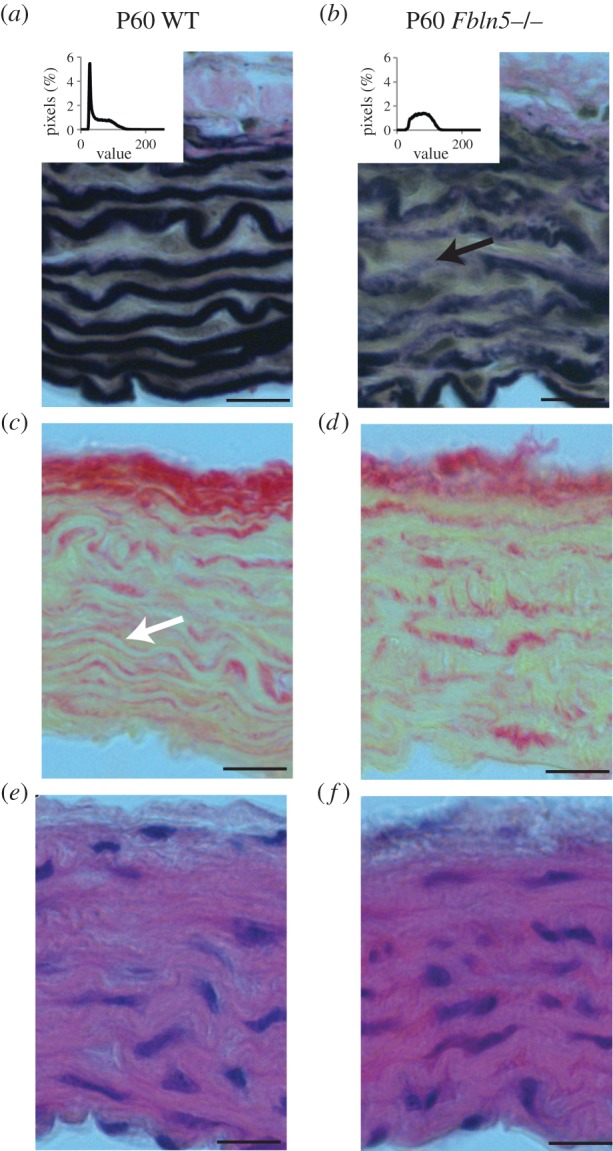
Representative histology sections of P60 WT (a,c,e) and Fbln5−/− (b,d,f) aorta stained with VVG (a,b) to highlight elastic fibres (black), PSR (c,d) to highlight collagen fibres (red) and H&E (e,f) to show overall wall morphology (cell nuclei in dark purple). Intensity of the black staining elastic laminae was quantified (table 3) using histograms of the pixel values for greyscale VVG images on a scale of 0 = black to 255 = white (insets). Fbln5−/− aorta shows less intense black staining of the elastic laminae with collagen (pink) appearing within the elastin layers (black arrow in b). Consistent with this observation, clear boundaries are visible between layers of collagen (red) and non-collagenous tissue (yellow) in WT aorta (white arrow in c), while the boundaries are less distinct in Fbln5−/− aorta (d). Four to six sections were examined in each group. Scale bar, 20 μm.
Table 3.
Number, thickness, spacing and intensity of elastic laminae quantified from VVG stained histology slides of aortic cross-sections from WT and Fbln5−/− mice. The number, thickness and spacing were determined by calculating the average number and spacing of white and black pixels crossed in user-defined radial lines on thresholded images. The intensity was determined from a greyscale histogram (figure 8a,b inset) calculated from user-defined regions in the media. The darkest quartile of the pixels (0–63) was binned as ‘black’ and represent mostly the intact elastic laminae. The next quartile (64–127) was binned as ‘dark grey’ and represent mostly the SMCs, collagen and disrupted elastic laminae. Data are presented as mean ± s.e.m. N = 4–6 per group.
 |
*p ≤ 0.05 for Fbln5−/− compared to WT.
To better understand the alterations in elastic laminae and collagen fibre structure in Fbln5−/− aorta compared with WT, we imaged fresh frozen sections stained with fluorescent probes for elastin, collagen and cell nuclei. The frozen sections show collagen fibres outlining the elastic laminae in WT aorta, while they appear integrated within the elastic laminae in Fbln5−/− aorta at all ages. Representative images for P7 aorta are shown in figure 9.
Figure 9.
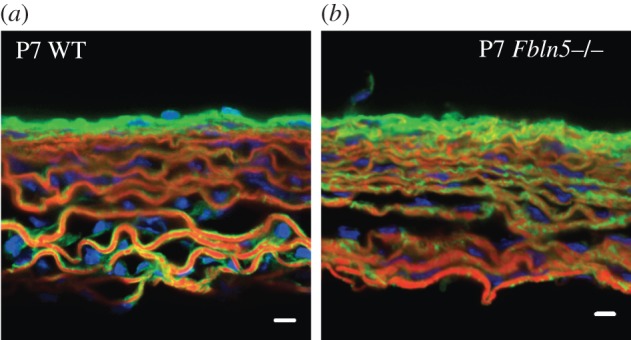
Representative frozen sections of P7 WT (a) and Fbln5−/− (b) aorta stained with Alexa Fluor 633 Hydrazide for elastin (red) [33,34], Oregon Green 488 conjugated CNA35 [35] for collagen (green) and Hoescht 34580 for cell nuclei (blue). In WT aorta, the elastic laminae are outlined with collagen fibres. In Fbln5−/− aorta the collagen fibres appear integrated within the elastic laminae, suggesting that collagen may fill in the disruptions in the laminae observed in histology sections (figure 8) and electron microscopy images [12]. In both genotypes, cell nuclei can be seen oriented circumferentially between elastin layers. Three to five sections were examined for each group. Scale bar, 10 μm.
4. Discussion
4.1. Unloaded dimensions and compliance of Fbln5−/− aorta
There are no differences in the aortic geometry in the circumferential (diameter) or radial (thickness) direction in response to the lack of fibulin-5 expression and the subsequent defects in elastic fibre assembly. This is consistent with previous data on Fbln5−/− carotid arteries [13,14] and in contrast to dimensional differences observed in other mouse models of elastic fibre defects, including Eln+/− arteries (smaller diameter and thickness) [4], arteries from elastin knockout mice rescued by expression of human elastin (hBACmNull) (smaller diameter and increased wall thickness) [36], and fibulin-4 smooth muscle cell-deficient aorta (Fbln4SMKO) (aneurysm development) [37]. Although the dimensions do not change in the circumferential and radial direction, the Fbln5−/− aorta is longer than WT at all time points. This is consistent with lengthening observed in Eln+/− mice [7] and Fbln4SMKO mice [38] and with the reduced axial stretch ratios observed in fibrillin-1 insufficient mice (mgR) [39] and adult Fbln5−/− mice [13,14]. Because reduced axial stretch affects both circumferential and axial stress, it has been speculated that this may be a mechanism to maintain stress values despite changing material properties [40].
The compliance above physiologic pressure is reduced at all ages in Fbln5−/− aorta compared with WT. Wan et al. [13,14] also found reduced compliance in Fbln5−/− carotid arteries. Elastin and collagen are added to the arterial wall [15] and blood pressures are increasing [17] throughout the P7–60 maturation period. The WT compliance data suggest that the mix of matrix proteins is adjusted to maintain the peak compliance just above the mean physiologic pressure at all ages. When the elastic fibres are disrupted by the loss of fibulin-5, the peak compliance shifts to just below the mean physiologic pressure but is maintained at this point throughout maturation. Similar results have been described for WT and Eln+/− aorta (7).
4.2. Homeostatic stress and universal elastic modulus
From experimental results and model predictions, the circumferential stresses at mean physiologic pressure are similar across genotypes. Wan et al. [13,14] found the circumferential stress to be reduced in Fbln5−/− carotid artery compared with WT from four to13 weeks of age, but not at three weeks of age. However, the stresses in Wan et al. [13,14] were calculated based on mean adult pressure values of 110 mmHg [12] for all ages, while our values are calculated from mean pressures at each age [20]. In figure 3c, the circumferential stresses diverge between genotypes just above the physiologic values for P21 and P60 aorta, highlighting the importance of determining the physiologic loading environment for relevant comparisons. Our data on maturing WT and Fbln5−/− aorta support the assertion of a ‘homeostatic circumferential stress’ in adult arteries [41,42]. The physiologic circumferential stress changes with maturation, showing that the value of the homeostatic stress state depends on age. Previous results on WT and Eln+/− aorta also showed an increase in circumferential stress with age and similar stresses across genotypes at most ages; however, there was a 60% increase in Eln+/− circumferential stress by P60 [7]. Hence, the aorta may remodel towards a homeostatic circumferential stress state, but limitations on matrix production and SMC plasticity in adulthood may preclude maintenance of precise values.
The experimental axial stresses at physiologic pressure diverge between genotypes at P21 and 60 and show a trend towards lower model predicted values, implying that maintenance of the homeostatic stress in the axial direction is less important than the circumferential direction. This is consistent with data from Wan et al. [13,14] for Fbln5−/− carotid arteries. Although Wan et al. [13,14] used different physiologic blood pressures for calculating the stresses, our data (figure 3d) show that axial stresses in the aorta are lower in Fbln5−/− aorta at P21 and 60, regardless of pressure. Carotid arteries from fibrillin-1 insufficient mice (mgR) also show similar circumferential stresses to WT, but decreased axial stresses. It is hypothesized that this may represent an overcompensation in the mechanically mediated reorganization of the wall components [39]. Assuming that SMCs are aligned mostly in the circumferential direction, it is reasonable that circumferential stress would be a driving factor for remodelling. The axial stresses change with age but are similar in value to the circumferential stresses. An isotropic stress state may be preferred for the ascending aortic wall.
The physiologic incremental modulus is within a small range of values for all ages and genotypes, with divergence occurring at higher pressure values. This supports previous observations by Shadwick [43] that aortae from a wide range of animals (from lobsters to rats) have a physiologic elastic modulus around 400 kPa. Matsumoto & Hayashi [42] found that the modulus was maintained after hypertensive remodelling in the rat aorta. We previously found that WT and Eln+/− aorta also have physiologic elastic moduli in this range and term it a ‘universal elastic modulus’ [44]. Our data on Eln+/− and Fbln5−/− aorta show that the universal modulus can be maintained despite decreased amounts or disorganization of elastic fibres and suggest that this is a critical parameter for mechanically induced aortic remodelling.
4.3. Predictions of the constitutive model
Our microstructurally motivated constitutive model provides mechanistic explanations for how the physiologic circumferential stresses and moduli can be maintained despite defects in elastic fibre assembly. The elastic modulus calculated from the constitutive model confirms that the modulus values remain in a narrow range (200–500 kPa) across ages, genotypes and directions. In the model, the fitted material constant associated with the elastin contribution is reduced in P60 Fbln5−/− mice, which results in a reduction of the elastin circumferential stress ratio at P60 and total elastin strain energy at all ages. Hence, the defective elastic fibres do not contribute as much as normal elastic fibres to the circumferential stress or stored energy of the deformed aortic wall. The decrease in circumferential stress contribution of the elastic fibres is similar to the decrease in elastin protein ratio and is supported by less intense staining and disruptions in the elastic fibres in Fbln5−/−. Wan et al. [14] also found a trend towards reduced elastin mass fractions in Fbln5−/− carotid arteries compared with WT. Yanagisawa et al. [12] found a decrease in desmosine, an elastin-specific cross-link, in three-month-old Fbln5−/− aorta compared with WT and show electron micrographs with elastin aggregates in Fbln5−/− aorta, compared to complete elastic laminae in WT, that are consistent with our imaging results.
Because elastin mechanical contributions are decreased in Fbln5−/− aorta, the collagen contribution must be increased to maintain the homeostatic circumferential stress and universal modulus. Our model shows that this can be accomplished through an increase in the exponential constant in the collagen strain energy function, so that collagen fibres have more nonlinear mechanical behaviour in Fbln5−/− aorta compared with WT. This increases the collagen circumferential stress contribution at P60 and increases the total collagen strain energy at all ages. The circumferential stress contribution of the collagen fibres does not mirror the changes in collagen protein ratio, indicating that altered collagen amount is not responsible for the mechanical differences, but that collagen fibre structure and organization may be important. Imaging of collagen fibres in aortic cross-sections does not show any obvious differences in collagen amount and structure between genotypes, but suggests that collagen localization (whether outside of or integrated with the elastic laminae) may be altered. Future work must focus on additional microstructural characterization, such as collagen fibre orientation [45], fibre recruitment [46], cross-link density [47] and overall organization within the three-dimensional wall under physiologic loading conditions. Previous work has shown that chemical degradation of elastic fibres [48,49] or alterations to the elastic fibres through the loss of fibulin-5 expression [13,14], reduced levels of fibrillin-1 [50] or mutations in the fibrillin-1 gene [51] affect collagen fibre orientation and recruitment. Understanding how collagen fibre structure and mechanics compensate for defective elastic fibres to meet the design constraints of the maturing aortic wall may help to manipulate this process in disease treatments and duplicate the process in tissue engineering.
Previous constitutive modelling of mouse arteries with elastic fibre defects have generally used a four-fibre model to fit carotid artery data [13,14,39,50], which is an extension of the two-fibre model [25] used here. Using a four-fibre model, Wan et al. [13] showed similar trends to this study with a decrease in the isotropic, elastin-associated parameter and an increase in the exponential terms associated with the collagen fibre families in Fbln5−/− carotids compared with WT. The authors discuss the large variability in the parameter values and the fact that some values are zero. We have found that the current two-fibre model with constraints on the elastin and collagen stress contributions reduces both the variability and the occurrence of zero values for the parameters. While the two-fibre model is sufficient for capturing the behaviour of mouse ascending aorta, a four-fibre model is necessary to fit mouse carotid artery data (JE Wagenseil 2014, unpublished results). Differences in the model fitting may be due to increased anisotropy of the carotid artery compared with the ascending aorta. The current constitutive model is similar to that used by Cheng et al. [22] to compare material properties of WT and Eln+/− aorta throughout maturation, except that we have eliminated the circumferentially aligned group of fibres that represent passive SMCs, because the fitted constants were near zero in that model.
4.4. Limitations
Although mice serve as useful models for human disease, arterial remodelling mechanisms may be different in mice and humans. Physiologic values were determined through ex vivo mechanical tests and measured blood pressures with the mice in an anaesthetized state [20]. There may be errors between these calculated values and the actual in vivo values. We anticipate the errors to be consistent in all groups however, so that the observed trends would hold. The constitutive model is microstructurally motivated, but does not provide specific explanations for how physical changes in the collagen fibres produce the observed changes in mechanical behaviour. Constitutive models that include collagen fibre waviness and dispersion, coupled with experimental measurement of the collagen fibre structure, may provide further insight [45,46,52,53]. Our model shows how trade-offs in the mechanical behaviour of elastin and collagen can produce equivalent circumferential stresses and incremental moduli in the composite aortic wall, but does not address molecular mechanisms for how these changes occur.
5. Conclusion
Biaxial mechanical data on maturing Fbln5−/− mouse aorta demonstrate a pattern of remodelling that leads to maintenance of the physiologic circumferential stress and modulus near WT levels. Adaptation in Fbln5−/− aorta begins early in maturation, and may be necessary to maintain cardiovascular function for a normal lifespan. Many of the adaptations are consistent with those observed in maturing Eln+/− mice [7,22] and may represent a common remodelling pattern that leads to a set of optimized aortic mechanical properties. A microstructurally based constitutive model suggests that trade-offs in the stress contributions of elastin and collagen are used to maintain the homeostatic stress state. Elastin protein amounts and imaging support the predicted elastin stress contributions. More work is needed to determine the structural changes to the collagen fibres that produce the increased circumferential stress contributions in Fbln5−/− aorta.
Acknowledgements
This work was supported, in part, by the National Institutes of Health grants R01HL115560 (J.E.W.), R01HL105314 (J.E.W. and R.P.M.), R01HL106305 (H.Y.) and T32HL727531 (J.K.C.). Magnus Hook at Texas A&M is gratefully acknowledged for providing the CNA35 for the collagen fluorescent staining.
Ethics statement
All procedures were approved by the Institutional Animal Care and Use Committee.
Data accessibility
Mechanical test data for fitting the constitutive model has been uploaded to Dryad (doi:10.5061/dryad.v1q15).
References
- 1.Li DY, Toland AE, Boak BB, Atkinson DL, Ensing GJ, Morris CA, Keating MT. 1997. Elastin point mutations cause an obstructive vascular disease, supravalvular aortic stenosis. Hum. Mol. Genet. 6, 1021–1028. ( 10.1093/hmg/6.7.1021) [DOI] [PubMed] [Google Scholar]
- 2.Dietz HC, Saraiva JM, Pyeritz RE, Cutting GR, Francomano CA. 1992. Clustering of fibrillin (FBN1) missense mutations in Marfan syndrome patients at cysteine residues in EGF-like domains. Hum. Mutat. 1, 366–374. ( 10.1002/humu.1380010504) [DOI] [PubMed] [Google Scholar]
- 3.Hu Q, Loeys BL, Coucke PJ, De Paepe A, Mecham RP, Choi J, Davis EC, Urban Z. 2006. Fibulin-5 mutations: mechanisms of impaired elastic fiber formation in recessive cutis laxa. Hum. Mol. Genet. 15, 3379–3386. ( 10.1093/hmg/ddl414) [DOI] [PubMed] [Google Scholar]
- 4.Faury G, et al. 2003. Developmental adaptation of the mouse cardiovascular system to elastin haploinsufficiency. J. Clin. Invest. 112, 1419–1428. ( 10.1172/JCI19028) [DOI] [PMC free article] [PubMed] [Google Scholar]
- 5.Wagenseil JE, Nerurkar NL, Knutsen RH, Okamoto RJ, Li DY, Mecham RP. 2005. Effects of elastin haploinsufficiency on the mechanical behavior of mouse arteries. Am. J. Physiol. Heart Circ. Physiol. 289, H1209–H1217. ( 10.1152/ajpheart.00046.2005) [DOI] [PubMed] [Google Scholar]
- 6.Li DY, Faury G, Taylor DG, Davis EC, Boyle WA, Mecham RP, Stenzel P, Boak B, Keating MT. 1998. Novel arterial pathology in mice and humans hemizygous for elastin. J. Clin. Invest. 102, 1783–1787. ( 10.1172/JCI4487) [DOI] [PMC free article] [PubMed] [Google Scholar]
- 7.Le VP, Knutsen RH, Mecham RP, Wagenseil JE. 2011. Decreased aortic diameter and compliance precedes blood pressure increases in postnatal development of elastin-insufficient mice. Am. J. Physiol. Heart Circ. Physiol. 301, H221–H229. ( 10.1152/ajpheart.00119.2011) [DOI] [PMC free article] [PubMed] [Google Scholar]
- 8.Le VP, Wagenseil JE. 2012. Echocardiographic characterization of postnatal development in mice with reduced arterial elasticity. Cardiovasc. Eng. Technol. 3, 424–438. ( 10.1007/s13239-012-0108-4) [DOI] [PMC free article] [PubMed] [Google Scholar]
- 9.Kielty CM, Sherratt MJ, Shuttleworth CA. 2002. Elastic fibres. J. Cell Sci. 115, 2817–2828. [DOI] [PubMed] [Google Scholar]
- 10.Yanagisawa H, Davis EC. 2010. Unraveling the mechanism of elastic fiber assembly: the roles of short fibulins. Int. J. Biochem. Cell Biol. 42, 1084–1093. ( 10.1016/j.biocel.2010.03.009) [DOI] [PMC free article] [PubMed] [Google Scholar]
- 11.Nakamura T, et al. 2002. Fibulin-5/DANCE is essential for elastogenesis in vivo. Nature 415, 171–175. ( 10.1038/415171a) [DOI] [PubMed] [Google Scholar]
- 12.Yanagisawa H, Davis EC, Starcher BC, Ouchi T, Yanagisawa M, Richardson JA, Olson EN. 2002. Fibulin-5 is an elastin-binding protein essential for elastic fibre development in vivo. Nature 415, 168–171. ( 10.1038/415168a) [DOI] [PubMed] [Google Scholar]
- 13.Wan W, Yanagisawa H, Gleason Hr RL. 2010. Biomechanical and microstructural properties of common carotid arteries from fibulin-5 null mice. Ann. Biomed. Eng. 38, 3605–3617. ( 10.1007/s10439-010-0114-3) [DOI] [PMC free article] [PubMed] [Google Scholar]
- 14.Wan W, Gleason RL., Jr 2013. Dysfunction in elastic fiber formation in fibulin-5 null mice abrogates the evolution in mechanical response of carotid arteries during maturation. Am. J. Physiol. Heart Circ. Physiol. 304, H674–H686. ( 10.1152/ajpheart.00459.2012) [DOI] [PMC free article] [PubMed] [Google Scholar]
- 15.Kelleher CM, McLean SE, Mecham RP. 2004. Vascular extracellular matrix and aortic development. Curr. Top. Dev. Biol. 62, 153–188. ( 10.1016/S0070-2153(04)62006-0) [DOI] [PubMed] [Google Scholar]
- 16.Wiesmann F, Ruff J, Hiller KH, Rommel E, Haase A, Neubauer S. 2000. Developmental changes of cardiac function and mass assessed with MRI in neonatal, juvenile, and adult mice. Am. J. Physiol. Heart Circ. Physiol. 278, H652–H657. [DOI] [PubMed] [Google Scholar]
- 17.Huang Y, Guo X, Kassab GS. 2006. Axial nonuniformity of geometric and mechanical properties of mouse aorta is increased during postnatal growth. Am. J. Physiol. Heart Circ. Physiol. 290, H657–H664. ( 10.1152/ajpheart.00803.2005) [DOI] [PubMed] [Google Scholar]
- 18.Davis EC. 1995. Elastic lamina growth in the developing mouse aorta. J. Histochem. Cytochem. 43, 1115–1123. ( 10.1177/43.11.7560894) [DOI] [PubMed] [Google Scholar]
- 19.Budatha M, Roshanravan S, Zheng Q, Weislander C, Chapman SL, Davis EC, Starcher B, Ann Word R, Yanagisawa H. 2011. Extracellular matrix proteases contribute to progression of pelvic organ prolapse in mice and humans. J. Clin. Invest. 121, 2048–2059. ( 10.1172/JCI45636) [DOI] [PMC free article] [PubMed] [Google Scholar]
- 20.Le VP, Stoka KV, Yanagisawa H, Wagenseil JE. 2014. Fibulin-5 null mice with decreased arterial compliance maintain normal systolic left ventricular function, but not diastolic function during maturation. Physiol. Rep. 2, e00257 ( 10.1002/phy2.257) [DOI] [PMC free article] [PubMed] [Google Scholar]
- 21.Amin M, Kunkel AG, Le VP, Wagenseil JE. 2011. Effect of storage duration on the mechanical behavior of mouse carotid artery. J. Biomech. Eng. 133, 071007 ( 10.1115/1.4004415) [DOI] [PMC free article] [PubMed] [Google Scholar]
- 22.Cheng JK, Stoilov I, Mecham RP, Wagenseil JE. 2013. A fiber-based constitutive model predicts changes in amount and organization of matrix proteins with development and disease in the mouse aorta. Biomech. Model Mechanobiol. 12, 497–510. ( 10.1007/s10237-012-0420-9) [DOI] [PMC free article] [PubMed] [Google Scholar]
- 23.Amin M, Le VP, Wagenseil JE. 2012. Mechanical testing of mouse carotid arteries: from newborn to adult. J. Visualized Exp. 60, e3733 ( 10.3791/3733) [DOI] [PMC free article] [PubMed] [Google Scholar]
- 24.Humphrey JD. 2002. Cardiovascular solid mechanics , 757 p New York, NY: Springer. [Google Scholar]
- 25.Holzapfel GA, Gasser TC, Ogden RW. 2000. A new constitutive framework for arterial wall mechanics and a comparative study of material models. J. Elast. 61, 1–48. ( 10.1023/A:1010835316564) [DOI] [Google Scholar]
- 26.Faury G, Maher GM, Li DY, Keating MT, Mecham RP, Boyle WA. 1999. Relation between outer and luminal diameter in cannulated arteries. Am. J. Physiol. 277, H1745–H1753. [DOI] [PubMed] [Google Scholar]
- 27.Baek S, Gleason RL, Rajagopal KR, Humphrey JD. 2007. Theory of small on large: potential utility in computations of fluid–solid interactions in arteries. Comp. Methods Appl. Mech. Eng. 196, 3070–3078. ( 10.1016/j.cma.2006.06.018) [DOI] [Google Scholar]
- 28.Long JL, Tranquillo RT. 2003. Elastic fiber production in cardiovascular tissue-equivalents. Matrix Biol. 22, 339–350. ( 10.1016/S0945-053X(03)00052-0) [DOI] [PubMed] [Google Scholar]
- 29.Wu J, Thabet SR, Kirabo A, Trott DW, Saleh MA, Xiao L, Madhur MS, Chen W, Harrison DG. 2014. Inflammation and mechanical stretch promote aortic stiffening in hypertension through activation of p38 mitogen-activated protein kinase. Circ. Res. 114, 616–625. ( 10.1161/CIRCRESAHA.114.302157) [DOI] [PMC free article] [PubMed] [Google Scholar]
- 30.Starcher B. 2001. A ninhydrin-based assay to quantitate the total protein content of tissue samples. Anal. Biochem. 292, 125–129. ( 10.1006/abio.2001.5050) [DOI] [PubMed] [Google Scholar]
- 31.Jamall IS, Finelli VN, Que Hee SS. 1981. A simple method to determine nanogram levels of 4-hydroxyproline in biological tissues. Anal. Biochem. 112, 70–75. ( 10.1016/0003-2697(81)90261-X) [DOI] [PubMed] [Google Scholar]
- 32.Neuman RE, Logan MA. 1950. The determination of collagen and elastin in tissues. J. Biol. Chem. 186, 549–556. [PubMed] [Google Scholar]
- 33.Shen Z, Lu Z, Chhatbar PY, O'Herron P, Kara P. 2012. An artery-specific fluorescent dye for studying neurovascular coupling. Nat. Methods 9, 273–276. ( 10.1038/nmeth.1857) [DOI] [PMC free article] [PubMed] [Google Scholar]
- 34.Clifford PS, et al. 2011. Spatial distribution and mechanical function of elastin in resistance arteries: a role in bearing longitudinal stress. Arterioscler. Thromb. Vasc. Biol. 31, 2889–2896. ( 10.1161/ATVBAHA.111.236570) [DOI] [PMC free article] [PubMed] [Google Scholar]
- 35.Krahn KN, Bouten CV, van Tuijl S, van Zandvoort MA, Merkx M. 2006. Fluorescently labeled collagen binding proteins allow specific visualization of collagen in tissues and live cell culture. Anal. Biochem. 350, 177–185. ( 10.1016/j.ab.2006.01.013) [DOI] [PubMed] [Google Scholar]
- 36.Hirano E, Knutsen RH, Sugitani H, Ciliberto CH, Mecham RP. 2007. Functional rescue of elastin insufficiency in mice by the human elastin gene: implications for mouse models of human disease. Circ. Res. 101, 523–531. ( 10.1161/CIRCRESAHA.107.153510) [DOI] [PubMed] [Google Scholar]
- 37.Huang J, Davis EC, Chapman SL, Budatha M, Marmorstein LY, Word RA, Yanagisawa H. 2010. Fibulin-4 deficiency results in ascending aortic aneurysms: a potential link between abnormal smooth muscle cell phenotype and aneurysm progression. Circ. Res. 106, 583–592. ( 10.1161/CIRCRESAHA.109.207852) [DOI] [PMC free article] [PubMed] [Google Scholar]
- 38.Le VP, Yamashiro Y, Yanagisawa H, Wagenseil JE. 2014. Measuring, reversing, and modeling the mechanical changes due to the absence of Fibulin-4 in mouse arteries. Biomech. Model Mechanobiol. 13, 1081–1985. ( 10.1007/s10237-014-0556-x) [DOI] [PMC free article] [PubMed] [Google Scholar]
- 39.Eberth JF, Taucer AI, Wilson E, Humphrey JD. 2009. Mechanics of carotid arteries in a mouse model of Marfan Syndrome. Ann. Biomed. Eng. 37, 1093–1104. ( 10.1007/s10439-009-9686-1) [DOI] [PMC free article] [PubMed] [Google Scholar]
- 40.Humphrey JD, Eberth JF, Dye WW, Gleason RL. 2009. Fundamental role of axial stress in compensatory adaptations by arteries. J. Biomech. 42, 1–8. ( 10.1016/j.jbiomech.2008.11.011) [DOI] [PMC free article] [PubMed] [Google Scholar]
- 41.Wolinsky H. 1972. Long-term effects of hypertension on the rat aortic wall and their relation to concurrent aging changes. Morphological and chemical studies. Circ. Res. 30, 301–309 ( 10.1161/01.RES.30.3.301 [DOI] [PubMed] [Google Scholar]
- 42.Matsumoto T, Hayashi K. 1994. Mechanical and dimensional adaptation of rat aorta to hypertension. J. Biomech. Eng. 116, 278–283. ( 10.1115/1.2895731) [DOI] [PubMed] [Google Scholar]
- 43.Shadwick RE. 1999. Mechanical design in arteries. J. Exp. Biol. 202, 3305–3313. [DOI] [PubMed] [Google Scholar]
- 44.Wagenseil JE, Mecham RP. 2009. Vascular extracellular matrix and arterial mechanics. Physiol. Rev. 89, 957–989. ( 10.1152/physrev.00041.2008) [DOI] [PMC free article] [PubMed] [Google Scholar]
- 45.Sacks MS. 2003. Incorporation of experimentally-derived fiber orientation into a structural constitutive model for planar collagenous tissues. J. Biomech. Eng. 125, 280–287. ( 10.1115/1.1544508) [DOI] [PubMed] [Google Scholar]
- 46.Hill MR, Duan X, Gibson GA, Watkins S, Robertson AM. 2012. A theoretical and non-destructive experimental approach for direct inclusion of measured collagen orientation and recruitment into mechanical models of the artery wall. J. Biomech. 45, 762–771. ( 10.1016/j.jbiomech.2011.11.016) [DOI] [PMC free article] [PubMed] [Google Scholar]
- 47.Avery NC, Sims TJ, Bailey AJ. 2009. quantitative determination of collagen cross-links. Methods Mol. Biol. 522, 103–121. ( 10.1007/978-1-59745-413-1_6) [DOI] [PubMed] [Google Scholar]
- 48.Fonck E, Prod'hom G, Roy S, Augsburger L, Rufenacht DA, Stergiopulos N. 2007. Effect of elastin degradation on carotid wall mechanics as assessed by a constituent-based biomechanical model. Am. J. Physiol. Heart Circ. Physiol. 292, H2754–H2763. ( 10.1152/ajpheart.01108.2006) [DOI] [PubMed] [Google Scholar]
- 49.Zeinali-Davarani S, Chow MJ, Turcotte R, Zhang Y. 2013. Characterization of biaxial mechanical behavior of porcine aorta under gradual elastin degradation. Ann. Biomed. Eng. 41, 1528–1538. ( 10.1007/s10439-012-0733-y) [DOI] [PMC free article] [PubMed] [Google Scholar]
- 50.Ferruzzi J, Collins MJ, Yeh AT, Humphrey JD. 2011. Mechanical assessment of elastin integrity in fibrillin-1-deficient carotid arteries: implications for Marfan syndrome. Cardiovasc. Res. 92, 287–295. ( 10.1093/cvr/cvr195) [DOI] [PMC free article] [PubMed] [Google Scholar]
- 51.Haskett D, et al. 2012. Altered tissue behavior of a non-aneurysmal descending thoracic aorta in the mouse model of Marfan syndrome. Cell Tissue Res. 347, 267–277. ( 10.1007/s00441-011-1270-y) [DOI] [PubMed] [Google Scholar]
- 52.Lanir Y. 1983. Constitutive equations for fibrous connective tissues. J. Biomech. 16, 1–12. ( 10.1016/0021-9290(83)90041-6) [DOI] [PubMed] [Google Scholar]
- 53.Zulliger MA, Fridez P, Hayashi K, Stergiopulos N. 2004. A strain energy function for arteries accounting for wall composition and structure. J. Biomech. 37, 989–1000. ( 10.1016/j.jbiomech.2003.11.026) [DOI] [PubMed] [Google Scholar]
Associated Data
This section collects any data citations, data availability statements, or supplementary materials included in this article.
Data Availability Statement
Mechanical test data for fitting the constitutive model has been uploaded to Dryad (doi:10.5061/dryad.v1q15).


