

Abstract
Background
The use of self-reported measures of chronic disease may substantially underestimate prevalence in low-income and middle-income country settings, especially in groups with lower socioeconomic status (SES). We sought to determine whether socioeconomic inequalities in the prevalence of non-communicable chronic diseases (NCDs) differ if estimated by using symptom-based or criterion-based measures compared with self-reported physician diagnoses.
Methods
Using population-representative data sets of the WHO Study of Global Ageing and Adult Health (SAGE), 2007–2010 (n=42 464), we calculated wealth-related and education-related concentration indices of self-reported diagnoses and symptom-based measures of angina, hypertension, asthma/chronic lung disease, visual impairment and depression in three ‘low-income and lower middle-income countries’—China, Ghana and India—and three ‘upper-middle-income countries’—Mexico, Russia and South Africa.
Results
SES gradients in NCD prevalence tended to be positive for self-reported diagnoses compared with symptom-based/criterion-based measures. In China, Ghana and India, SES gradients were positive for hypertension, angina, visual impairment and depression when using self-reported diagnoses, but were attenuated or became negative when using symptom-based/criterion-based measures. In Mexico, Russia and South Africa, this distinction was not observed consistently. For example, concentration index of self-reported versus symptom-based angina were: in China: 0.07 vs −0.11, Ghana: 0.04 vs −0.21, India: 0.02 vs −0.16, Mexico: 0.19 vs −0.22, Russia: −0.01 vs −0.02 and South Africa: 0.37 vs 0.02.
Conclusions
Socioeconomic inequalities in NCD prevalence tend to be artefactually positive when using self-report compared with symptom-based or criterion-based diagnostic criteria, with greater bias occurring in low-income countries. Using standardised, symptom-based measures would provide more valid estimates of NCD inequalities.
Keywords: Epidemiology of chronic non communicable diseases, INEQUALITIES, PUBLIC HEALTH
Introduction
A significant limitation to the currently available evidence on the magnitude and direction of socioeconomic inequalities in non-communicable chronic diseases (NCDs) is the widespread use of self-reported cases of physician diagnoses as source data. These self-reported data may systematically skew estimated inequalities due to reporting bias. Wealthier and more educated individuals tend to have relatively better access to healthcare as well as greater knowledge about disease conditions, compared with those in lower socioeconomic status (SES) groups.1–4 Since the governance of health systems and public service infrastructure in lowand middle income countries (LMICs) are generally weak, the gap in access to healthcare between low and high SES individuals is greater in lower income countries compared to higher income countries.5 As a result, the use of self-reported measures of NCDs may systematically underestimate the true NCD prevalence and could lead to an artificial inequality that makes social gradients appear positive, especially in LMICs.6–8
The use of standardised measures of identification of disease (ie, case finding) that assume no prior diagnosis or patient knowledge can help minimise reporting bias.7 9 The use of more objective measures consisting of symptom-based and criterion-based measures of diseases from the population surveys can be a viable option. For example, the symptom-based measure of angina using the WHO-Rose angina questionnaire10 has been widely used in epidemiological studies.11 12 Furthermore, symptom-based prevalence measures of asthma13 and depression14 were used in studies in different cultural settings. Several household level surveys in LMICs collect detailed disease specific information of symptoms and anthropometric features which can generate standardised disease measures.15 16 Several studies have incorporated more criterion-based measures of prevalence of specific NCDs in LMICs,6 8 17–20 and shown higher prevalence rates and negative SES gradients in NCDs; however, little evidence is available on whether prevalence rates and SES inequalities of specific NCDs vary when standardised measures and self-reported diagnoses are employed and the extent to which these vary in countries at different stages of economic development.
In this study, we tested whether and to what extent SES inequalities in the prevalence of NCDs were less marked if estimated using symptom-based or criterion-based measures, which assume no prior diagnosis or patient knowledge, compared with self-reported physician diagnoses. We evaluated the prevalence of five NCDs (angina, hypertension, asthma/chronic lung diseases, visual impairment and depression) in six LMICs. On the basis of the World Bank classification of countries, we grouped China, Ghana and India into ‘low-income and lower middle-income countries’ and Mexico, Russia and South Africa into ‘upper-middle-income countries’. We hypothesise that (1) SES gradients in NCD prevalence would be more likely to be positive if measured by self-reported physician diagnoses than by symptom-based/criterion-based measures, and that (2) these estimated SES inequalities would be greater in China, Ghana and India than in Mexico, Russia and South Africa. We discuss the findings in the light of the observation that lower SES groups in lower-income countries are at a greater disadvantage from their poorer knowledge of NCDs and lower access to healthcare than in richer countries as described above.
Methods
We used the individual level, cross-sectional data of wave 1 from the WHO Study on Global AGEing and Adult Health (SAGE), covering the years 2007–2010. SAGE is a series of nationally representative samples of persons aged 50+years and younger adults aged 18–49 years in China, Ghana, India, Mexico, Russia and South Africa.21 These SAGE countries represent different geographic regions of the world, levels of economic development and stages in the demographic and health transition, including the world's two most populous countries, China and India.21 Comparative descriptions of the six countries are presented in web appendix table 1.
The sampling method used for SAGE was based on the design for the World Health Survey 2002–2004, which was drawn from the national census of each country. The sampling details of SAGE have been documented elsewhere.15 21 Briefly, SAGE employed a probability sampling strategy using multistage, stratified, random cluster samples. The primary sampling units were stratified by region and location (urban/rural), and enumeration areas were selected within each stratum. The samples were drawn from a national sampling frame using a stratified, multistage cluster design so as to allow each household and individual respondent to be assigned a known non-zero probability of selection. The households were classified into one of two mutually exclusive categories:1 ‘50+ household’, and2 ‘18–49 household’. In the sample of age 50+ households, all individuals aged 50 years or older were eligible for interview and invited to respond. Only one individual aged 18–49 years was selected from the sample of age 18–49 households, and this individual was randomly selected using Kish grid table, so to avoid skewing the sample towards particular age or sex groups. Household-level and person-level analysis weights were calculated for each country, which included sample selection and a post-stratification factor.21
Standardised survey instruments, interviewer training and translation protocols were used in all SAGE countries. Interviewer-administered questionnaires in the native language of the respondent using local, commonly understood terms, with back translation to English to ensure accuracy and comparability, were used. Interviews were conducted between 2007 and 2010. The pooled wave 1 six-country totals for individual respondents included 34 124 respondents aged 50 years and 8340 aged 18–49 years. The individual level response rates for each country were as follows: China (93%), Ghana (81%), India (68%), Mexico (53%), Russia (83%) and South Africa (75%). SAGE achieved a very high response rate for two reasons. First, the majority of the respondents were participants in the World Health Survey 2002–2004 and followed up. Second, local institutions applied concerted efforts in collaboration with local partners to improve survey response. This included conducting a minimum of three revisits to households.
Ethical clearance was obtained from local research review boards for each participating SAGE site, in addition to the WHO Ethical Review Committee. Informed consent was obtained from each respondent prior to interview.
Measuring NCDs prevalence
Of the total eight NCDs reported in the SAGE survey, we considered five major NCDs: angina, hypertension, chronic lung diseases (emphysema, bronchitis, chronic obstructive pulmonary disease (COPD)) and asthma, visual impairment and depression. We excluded diabetes, stroke and arthritis because data were insufficient or unavailable for developing symptom-based measures.
The descriptions of survey questions for self-reported physician diagnoses and the criteria used for deriving symptom-based measures for each NCD were presented in web appendix table 2.
We derived symptom-based/criterion-based measures from the literature and previous household surveys. Symptom-based prevalence measures, which were based on the respondent's self-report, were used for angina and depression. Objective measures of prevalence based on internationally accepted standard criteria were employed for hypertension, asthma and chronic lung diseases, and visual impairment. The symptom-based measure for angina was from the WHO-Rose angina questionnaire,10 which has been widely used in epidemiological studies.11 12 We used the cut-offs for high blood pressure based on systolic blood pressure ≥140 mm Hg and/or diastolic blood pressure ≥90 mm Hg, the WHO criteria for diagnosing hypertension in adults 18 years and older.22 23 Symptom-based measures are available for asthma13 but not for chronic lung diseases. Hence, we used the spirometry test as a criterion-based measure for asthma and chronic lung diseases, as per the Global Initiative for Obstructive Lung Disease (GOLD) criteria for identifying obstructive diseases that would include asthma, COPD, chronic bronchitis and emphysema.24 The prevalence of visual impairment was estimated using the Tumbling E LogMAR chart.25 26 Finally, criteria for ‘moderate depression’ were derived from the International Statistical Classification of Diseases (ICD)-10 classification of mental and behavioural disorders.27 The Center for Epidemiologic Studies Depression Scale Revised (CESD-R), developed by the Center for Epidemiologic Studies, has been widely used to measure depression in a different cultural setting.14 We used the ICD-10 criteria of depression for the symptom-based measure as SAGE had used the same criteria of depression.
Socioeconomic status
We used wealth (asset-score index) and education as two distinct indicators of SES. A validated asset (wealth) score index, as originally reported in the WHO SAGE data set, was derived using the WHO standard approach to estimate permanent income from survey data on household ownership of durable goods, neighbourhood and dwelling characteristics, and access to water, sanitation and electricity.28 For the bivariate tabulation, education was defined as five categories such as ‘No formal education’, ‘Less than primary school’, ‘Primary school completed’, ‘High/secondary school’, and ‘College/university education’. For estimating the multivariate logistic regression and concentration index, we used the years of education.
Modelling approach
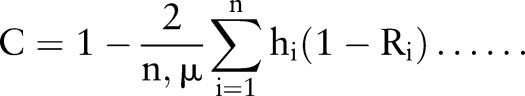
We estimated wealth-based and education-based concentration indices to estimate the SES inequalities in NCDs. The concentration index has been increasingly used to measure socioeconomic inequalities in health in an objective and readily understandable manner.29–31 The concentration index, a generalisation of the Gini coefficient, takes the whole socioeconomic distribution of the population into account, and is mathematically equivalent to the slope and relative index of inequality. The Concentration index (C) was computed as twice the (weighted) covariance of the health variable (‘ill-health’ in the present study) and a person's relative rank in terms of economic status, divided by the variable mean, according to the equation below.
 |
1 |
where n is the sample size, hi is the ill health of the ith individual, µ is the weighted mean of the ill-health, Ri is the fractional rank of the ith individual in terms of the index of household economic status. The concentration index can vary between −1 (concentrated among lower SES) and +1 (concentrated among the higher SES), and zero when there is no inequality.32 In addition, we estimated multivariate logistic regression models for each NCD.
We adjusted the estimates of concentration index and logistic regression models of symptom-based/criterion-based measures of NCD for the differential healthcare access across SES groups, which can potentially bias the symptom-based/criterion-based measures. For example, the acute pain symptom from angina is often amenable to medication (eg, sublingual nitroglycerine or removal of physical exertion), but otherwise would be largely asymptomatic if the patient is on chronic treatment. Access to these treatments might well be different for different SES respondents and might well account for the differences in the outcomes. In our models, we included a dichotomous variable of whether the respondent has taken medicines/treatments in the past 2 weeks for the criterion-based measure of hypertension, and asthma and chronic lung diseases, undergone surgery to correct visual impairment, and taken medicines/treatments in the past 12 months for the symptom-based angina and depression. Longer time windows for symptom-based angina and depression were used as assessment of these was based on a 12-month recall-period.
All statistical estimations were done with STATA V.13.1 (Stata Corp, College Station, Texas, USA).
Results
Table 1 shows the characteristics of the study sample of each country. The proportion of women respondents across countries ranged from 49.1% (China) to 57.3% (Russia). The respondents were drawn largely from rural areas in China (51%), Ghana (54%) and India (74%) while rural respondents consisted of a smaller proportion of the sample in Mexico (22%), Russia (24%) and South Africa (31%).
Table 1.
Socioeconomic characteristics of the sample population of China, Ghana, India, Mexico, Russia and South Africa (weighted sample)
| Ghana | India | China | South Africa | Mexico | Russia | |
|---|---|---|---|---|---|---|
| Total (N) | 5573 | 12 198 | 14 785 | 4227 | 2734 | 3418 |
| Sex (%) | ||||||
| Women | 50.4 | 50.3 | 49.1 | 52.8 | 52.0 | 57.3 |
| Men | 49.6 | 49.7 | 50.9 | 47.2 | 48.0 | 42.7 |
| Age group (%) | ||||||
| 18–34 | 23.8 | 35.8 | 15.6 | 34.6 | 40.0 | 14.9 |
| 35–49 | 50.5 | 39.0 | 58.4 | 41.3 | 33.5 | 24.0 |
| 50–59 | 10.3 | 12.3 | 11.7 | 12.0 | 12.7 | 26.9 |
| 60+ | 15.3 | 12.9 | 14.3 | 12.1 | 13.7 | 34.1 |
| Education level (%) | ||||||
| No formal schooling | 29.0 | 35.1 | 7.9 | 8.6 | 0.0 | 0.4 |
| Less than primary school | 13.5 | 8.9 | 11.9 | 12.2 | 21.5 | 0.5 |
| Primary school completed | 19.9 | 16.7 | 17.1 | 16.0 | 27.2 | 3.4 |
| Secondary high school completed | 33.4 | 30.8 | 53.5 | 56.0 | 38.1 | 73.3 |
| College completed or above | 4.2 | 8.5 | 9.6 | 7.3 | 13.2 | 22.4 |
| Location (%) | ||||||
| Rural | 54.0 | 74.3 | 51.3 | 30.7 | 22.2 | 24.4 |
| Urban | 46.0 | 25.7 | 48.7 | 69.3 | 77.8 | 75.6 |
Source: WHO Study on Global AGEing and Adult Health (SAGE) survey, 2007–2010.
Prevalence rate differences
Marked differences in the prevalence levels between self-reported physician diagnoses and symptom-based/criterion-based measures of NCDs were found between countries (figure 1). In China, Ghana and India, the prevalence of hypertension, visual impairment and depression was higher when symptom-based/criterion-based measures were used compared with self-reported diagnoses. The prevalence of symptom-based angina was also higher than that of self-reported angina in these countries, except in China. However, the prevalence of criterion-based measures of asthma and chronic lung disease was lower than that of self-reported diagnoses in these countries.
Figure 1.

Self-reported diagnoses and symptoms-based/criterion-based measures of the prevalence rate (95% CI) of diseases among the adult population in China, Ghana, India, Mexico, Russia and South Africa.
In Mexico, Russia and South Africa, we found a higher prevalence of hypertension and visual impairment using criterion-based measures, but a reverse trend was evident for asthma and chronic lung disease. In contrast, findings for angina and depression were heterogeneous, with the prevalence of symptom-based angina being lower in Russia and South Africa but higher in Mexico; also, the prevalence of symptom-based depression was lower in Mexico and South Africa, and higher in Russia.
SES inequalities in NCDs
Within-country prevalence levels of symptom-based/criterion-based measures were higher among those with lower SES compared to self-reported diagnoses for most NCDs in China, Ghana and India (see web appendix tables 3 and 4, and web appendix figure 1). Figures 2A–E and 3 and table 2 show the concentration index of each NCD within country. Further, web appendix tables 5 and 6 show the adjusted and undjusted OR of gender, asset (wealth) and education on the prevalence of specific NCDs.
Figure 2.

Age-standardised wealth-related and education-related concentration index (95% CI) of angina, hypertension, asthma and chronic lung diseases, visual impairment, and depression for self-reported diagnoses and symptoms-based/criterion-based measure, among the adult population in China, Ghana, India, Mexico, Russia and South Africa.
Figure 3.

Age-standardised wealth-related and education-related concentration index (95% CI) of angina, hypertension, asthma and chronic lung diseases, visual impairment, and depression for self-reported diagnoses and symptoms-based/criterion-based measure, among the adult population in China, Ghana, India, Mexico, Russia and South Africa.
Table 2.
Age-adjusted wealth-related and education-related concentration index (in %, with 95% CI) of disease, measured through self-reported diagnoses and symptoms-based/criterion-based measures, among the adult population in China, Ghana, India, Mexico, Russia and South Africa
| Wealth-related concentration index | Education-related concentration index | |||
|---|---|---|---|---|
| Symptoms-based/criterion-based measures | Self-reported diagnoses | Symptoms-based/criterion-based measures | Self-reported diagnoses | |
| Angina | ||||
| Ghana | −0.21 (−0.22 to −0.20) | 0.04 (0.03 to 0.05) | −0.12 (−0.15 to −0.10) | 0.36 (0.33 to 0.38) |
| India | −0.16 (−0.17 to −0.16) | 0.02 (0.01 to 0.02) | −0.12 (−0.12 to −0.11) | 0.03 (0.03 to 0.03) |
| China | −0.11 (−0.12 to −0.11) | 0.07 (0.07 to 0.07) | −0.01 (−0.02 to −0.01) | 0.09 (0.08 to 0.10) |
| South Africa | 0.02 (−0.02 to 0.06) | 0.37 (0.32 to 0.42) | −0.13 (−0.15 to −0.10) | −0.17 (−0.19 to −0.14) |
| Mexico | −0.22 (−0.26 to −0.17) | 0.19 (0.17 to 0.21) | −0.08 (−0.11 to −0.05) | 0.13 (0.05 to 0.20) |
| Russia | −0.02 (−0.02 to −0.01) | −0.01 (−0.01 to 0.00) | −0.07 (−0.07 to −0.06) | 0.04 (0.04 to 0.05) |
| Hypertension | ||||
| Ghana | 0.03 (0.02 to 0.03) | 0.29 (0.27 to 0.30) | −0.03 (−0.03 to −0.03) | 0.10 (0.09 to 0.10) |
| India | 0.03 (0.03 to 0.03) | 0.19 (0.18 to 0.19) | 0.00 (0.00 to 0.00) | 0.12 (0.12 to 0.13) |
| China | −0.02 (−0.02 to −0.02) | 0.09 (0.09 to 0.09) | −0.04 (−0.04 to −0.03) | 0.07 (0.06 to 0.07) |
| South Africa | −0.02 (−0.03 to −0.01) | 0.15 (0.13 to 0.17) | 0.00 (−0.01 to 0.01) | 0.04 (0.02 to 0.06) |
| Mexico | −0.02 (−0.03 to −0.02) | 0.14 (0.12 to 0.16) | 0.10 (0.08 to 0.12) | 0.00 (−0.01 to 0.02) |
| Russia | −0.07 (−0.07 to −0.06) | 0.02 (0.02 to 0.03) | −0.02 (−0.02 to −0.02) | −0.03 (−0.03 to −0.02) |
| Asthma and chronic lung disease | ||||
| Ghana | 0.05 (0.03 to 0.07) | −0.04 (−0.05 to −.03) | 0.06 (0.06 to 0.07) | −0.09 (−0.10 to −0.08) |
| India | −0.04 (−0.04 to −0.04) | −0.05 (−0.06 to −0.05) | −0.05 (−0.05 to −0.04) | 0.04 (0.04 to 0.04) |
| China | −0.03 (−0.03 to −0.02) | −0.04 (−0.04 to−0.04) | 0.05 (0.04 to 0.06) | −0.03 (−0.04 to −0.02) |
| South Africa | −0.06 (−0.08 to −0.03) | 0.11 (0.08 to 0.14) | −0.06 (−0.17 to 0.05) | −0.14 (−0.18 to −0.09) |
| Mexico | 0.52 (0.48 to 0.56) | −0.21 (−0.26 to −0.16) | 0.24 (0.15 to 0.33) | 0.17 (0.12 to 0.22) |
| Russia | −0.13 (−0.15 to −0.11) | 0.02 (0.01 to 0.02) | −0.33 (−0.36 to −0.30) | 0.01 (0.01 to 0.02) |
| Visual impairment | ||||
| Ghana | −0.05 (−0.06 to −0.05) | 0.23 (0.22 to 0.24) | −0.01 (−0.02 to 0.00) | 0.20 (0.19 to 0.21) |
| India | −0.06 (−0.06 to −0.06) | 0.07 (0.07 to 0.07) | −0.06 (−0.06 to −0.06) | 0.02 (0.02 to 0.02) |
| China | −0.01 (−0.01 to −0.01) | 0.05 (0.05 to 0.06) | 0.11 (0.10 to 0.12) | 0.15 (0.15 to 0.16) |
| South Africa | 0.02 (0.01 to 0.04) | 0.03 (−0.03 to 0.10) | 0.07 (0.04 to 0.10) | −0.22 (−0.26 to −0.19) |
| Mexico | −0.09 (−0.12 to −0.07) | −0.10 (−0.13 to −0.06) | −0.09 (−0.11 to −0.07) | 0.11 (0.07 to 0.15) |
| Russia | −0.03 (−0.04 to −0.03) | −0.07 (−0.07 to −0.07) | −0.05 (−0.06 to −0.04) | 0.04 (0.03 to 0.05) |
| Depression | ||||
| Ghana | 0.02 (0.01 to 0.03) | 0.20 (0.18 to 0.21) | 0.00 (0.00 to 0.00) | 0.04 (0.02 to 0.06) |
| India | −0.12 (−0.13 to −0.12) | 0.07 (0.06 to 0.07) | −0.08 (−0.08 to −0.07) | −0.04 (−0.05 to −0.04) |
| China | −0.16 (−0.17 to −0.14) | 0.25 (0.23 to 0.26) | −0.04 (−0.05 to −0.03) | −0.16 (−0.17 to−0.14) |
| South Africa | −0.19 (−0.25 to −0.14) | 0.02 (−0.02 to 0.07) | −0.24 (−0.28 to −0.20) | 0.06 (0.01 to 0.12) |
| Mexico | 0.03 (−0.01 to 0.06) | 0.02 (−0.01 to 0.05) | 0.11 (0.09 to 0.12) | 0.15 (0.12 to 0.18) |
| Russia | 0.00 (−0.02 to 0.01) | 0.11 (0.10 to 0.12) | 0.16 (0.14 to 0.17) | 0.03 (0.02 to 0.04) |
(1) Source: WHO SAGE survey, 2007–2010; (2) Negative values indicate concentration of disease among those of lower socioeconomic status (SES), and positive values indicate concentration among those of higher SES The symptom-based/criterion-based measures of each non-communicable chronic disease was also adjusted with a dichotomous variable of whether the respondent has taken medication/treatment or not.
In China, Ghana and India, the prevalence of most NCDs was concentrated among higher SES groups based on self-reported diagnoses. Conversely, SES patterning was either attenuated or was concentrated in lower SES groups when based on symptom-based/criterion-based measures. Self-reported diagnoses (Cself-report) for hypertension, angina, visual impairment and depression were more concentrated among higher SES individuals, whereas symptom-based/criterion-based measures (Csymptom or Ccriterion-based) of these NCDs showed either concentration among lower SES individuals or attenuation in the SES inequalities. For example, the age-standardised wealth-related concentration index of angina showed positive values (concentration among higher SES) for self-reported diagnoses and negative values (concentration among lower SES) for symptoms-based diagonoses (Ghana: Cself-report 0.04 vs Csymptom −0.21; India: Cself-report 0.02 vs Csymptom −0.16; China: Cself-report 0.07 vs Csymptom −0.11). Conversely, self-reported diagnoses of asthma and chronic lung diseases in China, Ghana and India were concentrated among lower SES individuals.
In Mexico, Russia and South Africa, the patterns of SES inequalities between self-reported diagnoses and symptom-based/criterion-based measures showed a mixed picture with some NCDs showing patterns similar to China, Ghana and India and others showing a heterogeneous pattern. More specifically, there was a higher prevalence among lower SES individuals of symptom-based/criterion-based measures of angina and hypertension than self-reported diagnoses. Self-reported hypertension was concentrated among higher SES individuals, whereas criterion-based measure of hypertension was concentrated among lower SES individuals (South Africa: Cself-report 0.15 vs Ccriterion-based −0.02; Mexico: Cself-report 0.14 vs Ccriterion-based −0.02; Russia: Cself-report 0.02 vs Ccriterion-based −0.07). Self-reported angina was concentrated among higher SES individuals in Mexico (Cself-report 0.19 vs Csymptom −0.22) and South Africa (Cself-report 0.37 vs Csymptom 0.02) while symptom-based angina was concentrated in lower SES individuals in Mexico but turned to get less positive in South Africa. Indicating similar patterns, symptom-based angina in Russia was more common among lower SES individuals. However, the SES concentration of most NCDs such as asthma and chronic lung diseases, visual impairment and depression in Mexico, Russia and South Africa showed more heterogeneous patterns. Web appendix table 7 summarises the main findings on the SES inequalities between self-reported diagnoses and symptom-based measures of specific NCDs across countries.
Gender differences in prevalence and inequalities
Most NCDs were found to be more prevalent among women than men, irrespective of the method used for assessing prevalence (see web appendix table 8). For example, self-reported and symptom-based angina was more prevalent among women than men across all the six countries, with the exception of India, where a lower prevalence of self-reported angina was reported (3% in women vs 3.2% in men). Prevalence rates using self-reported and symptom-based/criterion-based measures in men and women also varied between NCDs. For example, the criterion-based measure of hypertension was more prevalent among men than women as compared with the self-reported measure in most countries, and a heterogeneous pattern for most of the other NCDs.
Patterns of SES inequality in NCDs also differed by sex and country (see web appendix table 9). In all countries except South Africa, the symptom-based measure of angina was more highly concentrated among lower SES men and women. Furthermore the criterion-based measure of visual impairment was amore among lower SES men and women in most countries, with the exception of higher prevalence among higher SES in China and South Africa. In contrast, the symptoms-based measure of depression was more among lower SES women across countries (except Mexico and Russia) and more among higher SES men across countries (except India).
Variation in SES inequalities between education and wealth groups
Education and wealth-related concentration indices did not always show similar patterns. For instance, both prevalence measures of angina in South Africa showed a concentration among individuals with higher wealth and among the less educated. Furthermore, there was little evidence of concentration of hypertension by education gradient in any country. This was in contrast to the gradient seen for the wealth indicator.
Discussion
Our analysis of NCD inequalities found that self-reported diagnoses of hypertension, angina, visual impairment and depression tended to give rise to positive SES gradients, whereas symptom-based or criterion-based measures tended to display less positive gradients or even negative gradients (concentration in the lower SES groups). These differences in estimated gradients were more pronounced in China, Ghana and India (low-income and lower middle-income countries) than in Mexico, Russia and South Africa (upper-middle-income countries). Moreover, we found higher prevalence rates among women than men for most NCDs across the countries.
These findings must, however, be contextualised by important limitations. First, our data do not include younger people (below 18 years). However, this would have a limited bearing on the findings, except for asthma, as most of the conditions studied occur largely in adults. Second, we could not assess the extent of access to healthcare and other disease specific features across different SES groups as explanations for differences in self-reported diagnoses and symptom-based/criterion-based measures. Third, we incorporated standardised measures to identify NCDs to the extent possible, however, some of our symptom-based measures, namely of angina and depression, were based on self-reports of symptoms, and the reliability of such measures are also limited by lack of comprehensiveness and are subject to their own reporting biases. Another related potential source of variance in the results can arise from the variations in the performance on the standard tests between respondents of different SES groups. Furthermore, most symptoms were measured at a single time point. Individuals with angina, hypertension, visual impairment and depression may not always necessarily experience symptoms due to medication or other related reasons, resulting in incomplete case ascertainment using symptom-based measures. Finally, our symptom-based estimates did not consistently detect a higher prevalence of the NCDs than self-reported diagnoses. For example, the spirometric prevalence estimates of asthma and chronic lung diseases were lower than those of self-reported diagnoses, probably due to a misreporting of recurrent acute respiratory diseases such as asthma or COPD, and/or inability of spirometry to detect asthma that is in remission.
Our study informs methodological development for producing more robust community-based estimates of NCD prevalence in LMIC settings. We used nationally representative data in China, Ghana, India, Mexico, South Africa and Russia, and employed both self-reported diagnoses and symptom-based measures to estimate prevalence of several NCDs across SES groups. Furthermore, we used asset index and education as two distinct SES indicators.
These findings provide salient information for the ongoing debate about whether NCDs in LMICs are concentrated among the rich or the poor, the latter being the case in most high-income countries.2 33–35 Exposure to risk factors—tobacco, high blood pressure, high blood lipids, raised blood glucose and obesity—and consequent NCDs are hypothesised to be initially greater in affluent, urban elites in LMICs.36 Greater exposure to these risk factors among lower SES groups37 may produce a reversal of SES patterning over time. However, the available evidence on SES patterning of NCDs in LMICs shows contrasting results. A study based on the World Health Survey 2004 found that NCDs are relatively more common among the lower SES groups.6 Some studies from India suggest that cardiometabolic diseases are prevalent among the lower SES groups,38 39 whereas other studies reported positive associations between SES and NCDs.33 Evidence of positive associations of specific NCDs were reported in Ghana.40 In China, a higher prevalence of COPD has been reported among the less educated;41 negative association between educational level and obesity but a positive association between household income and central obesity was reported in rural China.42 Evidence from South Africa suggests that NCDs are being increasingly reported among lower SES.43 Furthermore, one study has reported complex intermediate patterns with an interaction between wealth and education in relation to obesity among women in LMICs, which may explain the differences in patterns by education and wealth observed in our study.44 Studies also found that lower SES groups had less screening and knowledge of cardiovascular risk factors, whereas those with the knowledge were more likely to make healthy behavioural changes,45 and educational attainment and health literacy can modify the NCDs and risk factors in LMICs.46 47 Our findings indicated that SES gradients in NCD prevalence qualitatively differed within and between countries by type of prevalence measurement, specific NCDs and SES indicators, and thus NCDs as a category cannot be considered as diseases of affluence or of poverty.
Suggestions for future research and policy
Our study findings require further investigation using data from a greater number of LMICs covering a wider spectrum of economic development. Longitudinal or repeat survey data would enable stronger inferences on whether ‘switching’ from a positive to negative gradient within a country occurs over time (gradient reversal). Future surveys should incorporate more comprehensive and reliable indicators of pathology such as biomarkers, and also more detailed information on the medications of each NCD so that the issue of differential healthcare across SES can be incorporated for more robust estimates of symptom-based/criterion-based measures of NCDs. Though we found that self-reported diagnoses of most NCDs across countries were generally concentrated among higher SES individuals whereas symptom-based measures were either concentrated among lower SES individuals or more evenly distributed, we did observe considerable between-country heterogeneity. The underlying reasons for this heterogeneity are a topic for further investigation. These are likely to include differential access to healthcare, public awareness of NCD symptoms, and potentially important cultural and social differences in reporting.
Our findings suggest that NCD prevalence estimates solely based on self-reported diagnoses may be misleading if used to determine the burden of disease, targeting interventions and exploring social inequalities in NCDs. Standardised diagnostic measures, using clinical assessment augmented by investigations, should be implemented in community surveys to estimate the true prevalence of NCDs and inform policies in LMICs. If this is not feasible due to resource constraints, a more comprehensive set of questions on specific NCDs should be employed to minimise possible bias due to the under-reporting and underdiagnosis among lower SES groups. Better methods of surveillance and monitoring are needed in LMICs to determine trends in incidence and mortality of specific NCDs and to evaluate health programmes for NCDs in terms of their impact on social inequalities in health.48
What is already known on this subject.
Self-reported measures of non-communicable chronic diseases (NCDs) are likely to under-estimate the true magnitude of the problem in lower socioeconomic groups.
What this study adds.
Self-reported diagnoses of angina, hypertension, visual impairment and depression tended to give rise to positive socioeconomic status (SES) gradients, gradients (ie concentrated among higher socioeconomic groups) whereas symptom-based or criterion-based measures of these diseases showed either less positive gradients or even concentrated among lower socioeconomic groups.
These differences in estimated SES gradients were more pronounced in China, Ghana and India (low-middle and lower middle-income countries) than in Mexico, Russia and South Africa (upper-middle-income countries).
Using standardised, symptom-based measures would provide more valid estimates of NCD inequalities.
Supplementary Material
Acknowledgments
The authors are grateful to the two anonymous reviewers and the editor for their very insightful comments and suggestions. This paper used data from the WHO SAGE V.1.1.0. The WHO-SAGE was supported by the U.S National Institute on Aging, Division of Behavioral and Social Research through an Inter-Agency Agreement.
Footnotes
Contributors: SV, CM, SB, DS, SE conceived and designed the experiments. SV, CM, SB, ZK, AA-S, DS, SE performed the experiments. SV, ZK analysed the data. SV, CM, SB, ZK, AA-S, DS, SE contributed reagents/materials/analysis tools. SV, SE involved in the first draft of the paper. SV, CM, SB, ZK, AA-S, DS, SE substantially contributed to the revision of the first draft. SV, CM, SB, ZK, AA-S, DS, SE were reviewed the final draft of the paper.
Funding: SE and SV are supported by a Wellcome Trust Strategic Award (WT084674/Z/08/Z). DS is supported by a Wellcome Trust Investigator Award (100709/Z/12/Z).
Competing interests: None.
Ethics approval: WHO Ethic committee.
Provenance and peer review: Not commissioned; externally peer reviewed.
References
- 1.Sen A. Health: perception versus observation: self reported morbidity has severe limitations and can be extremely misleading. BMJ 2002;324:860–1. [DOI] [PMC free article] [PubMed] [Google Scholar]
- 2.Mackenbach JP, Stirbu I, Roskam AJR, et al. Socioeconomic inequalities in health in 22 European countries. N Engl J Med 2008;358:2468–81. [DOI] [PubMed] [Google Scholar]
- 3.Mackenbach JP, Looman CW, van der Meer JB. Differences in the misreporting of chronic conditions, by level of education: the effect on inequalities in prevalence rates. Am J Public Health 1996;86:706–11. [DOI] [PMC free article] [PubMed] [Google Scholar]
- 4.Andersen RM. Revisiting the behavioral model and access to medical care: does it matter? J Health Soc Behav 1995;36:1–10. [PubMed] [Google Scholar]
- 5.Peters DH, Garg A, Bloom G, et al. Poverty and Access to Health Care in Developing Countries. Ann N Y Acad Sci 2008;1136:161–71. [DOI] [PubMed] [Google Scholar]
- 6.Hosseinpoor AR, Bergen N, Mendis S, et al. Socioeconomic inequality in the prevalence of noncommunicable diseases in low- and middle-income countries: results from the World Health Survey. BMC Public Health 2012;12:474. [DOI] [PMC free article] [PubMed] [Google Scholar]
- 7.Vellakkal S, Subramanian SV, Millett C, et al. Socioeconomic inequalities in non-communicable diseases prevalence in india: disparities between self-reported diagnoses and standardized measures. PLoS ONE 2013;8:e68219. [DOI] [PMC free article] [PubMed] [Google Scholar]
- 8.Levesque J-F, Mukherjee S, Grimard D, et al. Measuring the prevalence of chronic diseases using population surveys by pooling self-reported symptoms, diagnosis and treatments: results from the World Health Survey of 2003 for South Asia. Int J Public Health 2013;58:435–47. [DOI] [PubMed] [Google Scholar]
- 9.World Health Organisation. Chronic health conditions: assessing self-report against a gold standard diagnostic test- SAGE validation sub-studies. World Health Organisation, 2014. [12/03/2014]. http://www.who.int/healthinfo/sage/substudies/en/index2.html [Google Scholar]
- 10.Rose GA. The diagnosis of ischaemic heart pain and intermittent claudication in field surveys. Bull World Health Organ 1962;27:645–58. [PMC free article] [PubMed] [Google Scholar]
- 11.Fischbacher CM, Bhopal R, Unwin N, et al. The performance of the Rose angina questionnaire in South Asian and European origin populations: a comparative study in Newcastle, UK. Int J Epidemiol 2001;30:1009–16. [DOI] [PubMed] [Google Scholar]
- 12.Rahman MA, Spurrier N, Mahmood MA, et al. Rose Angina Questionnaire: validation with cardiologists’ diagnoses to detect coronary heart disease in Bangladesh. Indian Heart J 2012;65:30–9. [DOI] [PMC free article] [PubMed] [Google Scholar]
- 13.To T, Stanojevic S, Moores G, et al. Global asthma prevalence in adults: findings from the cross-sectional world health survey. BMC Public Health 2012;12:204. [DOI] [PMC free article] [PubMed] [Google Scholar]
- 14.Mui A, Burnette D, Chen L. Cross-cultural assessment of geriatric depression: a review of the CES-D and GDS. In: Skinner JH, Teresi JA, Holmes D, et al., eds Multicultural measurement in older populations. New York: Springer Publishing Company, 2002:147–77. [Google Scholar]
- 15.World Health Organisation. World Health Survey, Health Statistics and Health Information Systems. Geneva: World Health Organisation, 2004. http://www.who.int/healthinfo/survey/en/ (accessed 21 Aug 2011). [Google Scholar]
- 16.World Health Organisation. WHO Study on global AGEing and adult health (SAGE), Health statistics and health information systems. World Health Organisation, 2011. http://www.who.int/healthinfo/systems/sage/en/index1.html (accessed 21 Aug 2011). [Google Scholar]
- 17.Yin P, Zhang M, Li Y, et al. Prevalence of COPD and its association with socioeconomic status in China: findings from China Chronic Disease Risk Factor Surveillance 2007. BMC Public Health 2011;11:586. [DOI] [PMC free article] [PubMed] [Google Scholar]
- 18.Leone T, Coast E, Narayanan S, et al. Diabetes and depression comorbidity and socio-economic status in low and middle income countries (LMICs): a mapping of the evidence. Global Health 2012;8:39. [DOI] [PMC free article] [PubMed] [Google Scholar]
- 19.Arokiasamy P, Uttamacharya U, Kowal P. Socioeconomic and age gradients of health of Indian adults: an assessment of self-reported and performance-based measures of health. 2013. [DOI] [PubMed]
- 20.Lloyd-Sherlock P, Beard J, Minicuci N, et al. Hypertension among older adults in low- and middle-income countries: prevalence, awareness and control. Int J Epidemiol 2014;43:116–28. [DOI] [PMC free article] [PubMed] [Google Scholar]
- 21.Kowal P, Chatterji S, Naidoo N, et al. Data resource profile: the World Health Organization Study on global AGEing and adult health (SAGE). Int J Epidemiol. 2012;41:1639–49. [DOI] [PMC free article] [PubMed] [Google Scholar]
- 22.Joint National Committee on Prevention D, Evaluation, and Treatment of High Blood Pressure. The seventh report of the Joint National Committee on Prevention, Detection, Evaluation, and Treatment of High Blood Pressure. NIH Publication No 04-5230 2004.
- 23.World Health Organization/International Society of Hypertension guidelines for the management of hypertension. Guidelines Sub-Committee. J Hypertens 1999;17:151–83. [PubMed] [Google Scholar]
- 24.GOLD. Global Strategy for the Diagnosis, Management and Prevention of COPD, Global Initiative for Chronic Obstructive Lung Disease (GOLD). 2012. http://www.goldcopd.org (accessed 12 Dec 2012).
- 25.World Health Organization. International classification of functioning, disability and health. World Health Organization, 2007. [Google Scholar]
- 26.World Health Organization. 10:International statistical classification of diseases and related health problems, tenth revision. World Health Organisation; 2004. ISBN: 92: 154649. [PubMed] [Google Scholar]
- 27.World Health Organization. The ICD-10 classification of mental and behavioural disorders: diagnostic criteria for research. Geneva: World Health Organization, 1993. http://www.who.int/classifications/icd/en/GRNBOOK.pdf [Google Scholar]
- 28.Ferguson B, Tandon A, Gakidou E, et al. Estimating permanent income using indicator variables. Health systems performance assessment: debates, methods and empiricism. Geneva: World Health Organization, 2003:747–60. [Google Scholar]
- 29.Wagstaff A, Van Doorslaer E. Income inequality and health: what does the literature tell us? Annu Rev Public Health 2000;21:543–67. [DOI] [PubMed] [Google Scholar]
- 30.Van Doorslaer E, Wagstaff A, Van Der Burg H, et al. Equity in the delivery of health care in Europe and the US. J Health Econ 2000;19:553–83. [DOI] [PubMed] [Google Scholar]
- 31.Kakwani N, Wagstaff A, Van Doorslaer E. Socioeconomic inequalities in health: measurement, computation, and statistical inference. J Econ 1997;77:87–103. [Google Scholar]
- 32.Wagstaff A, Paci P, van Doorslaer E. On the measurement of inequalities in health. Soc Sci Med 1991;33:545–57. [DOI] [PubMed] [Google Scholar]
- 33.Subramanian S, Corsi DJ, Subramanyam MA, et al. Jumping the gun: the problematic discourse on socioeconomic status and cardiovascular health in India. Int J Epidemiol 2013;42:1410–26. [DOI] [PubMed] [Google Scholar]
- 34.Gwatkin DR, Guillot M, Heuveline P. The burden of disease among the global poor. Lancet 1999;354:586–9. [DOI] [PubMed] [Google Scholar]
- 35.Reddy KS. The burden of disease among the global poor. Lancet 1999;354:1477. [DOI] [PubMed] [Google Scholar]
- 36.Mathers C, Fat DM, Boerma J. The global burden of disease: 2004 update. World Health Organization, 2008. [Google Scholar]
- 37.Stuckler D, McKee M, Ebrahim S, et al. Manufacturing epidemics: the role of global producers in increased consumption of unhealthy commodities including processed foods, alcohol, and tobacco. PLoS Med 2012;9:e1001235. [DOI] [PMC free article] [PubMed] [Google Scholar]
- 38.Gupta R, Kaul V, Agrawal A, et al. Cardiovascular risk according to educational status in India. Prev Med 2010;51:408–11. [DOI] [PubMed] [Google Scholar]
- 39.Deepa M, Anjana RM, Manjula D, et al. Convergence of prevalence rates of diabetes and cardiometabolic risk factors in middle and low income groups in urban India: 10-year follow-up of the Chennai Urban Population Study. J Diabetes Sci Technol 2011;5:918–27. [DOI] [PMC free article] [PubMed] [Google Scholar]
- 40.Tagoe HA. Household burden of chronic diseases in Ghana. Ghana Med J 2012;46(2 Suppl):54–8. [PMC free article] [PubMed] [Google Scholar]
- 41.Zhong N, Wang C, Yao W, et al. Prevalence of chronic obstructive pulmonary disease in China: a large, population-based survey. Am J Respir Crit Care Med 2007;176:753–60. [DOI] [PubMed] [Google Scholar]
- 42.Cai L, He J, Song Y, et al. Association of obesity with socio-economic factors and obesity-related chronic diseases in rural southwest China. Public Health 2013;127:247–51. [DOI] [PubMed] [Google Scholar]
- 43.Ataguba JE, Akazili J, McIntyre D. Socioeconomic-related health inequality in South Africa: evidence from General Household Surveys. Int J Equity Health 2011;10:48. [DOI] [PMC free article] [PubMed] [Google Scholar]
- 44.Aitsi-Selmi A, Bell R, Shipley MJ, et al. Education modifies the association of wealth with obesity in women in middle-income but not low-income countries: an interaction study using seven national eatasets, 2005–2010. PLoS ONE 2014;9:e90403. [DOI] [PMC free article] [PubMed] [Google Scholar]
- 45.Zaman MJ, Patel A, Jan S, et al. Socio-economic distribution of cardiovascular risk factors and knowledge in rural India. Int J Epidemiol 2012;41:1302–14. [DOI] [PubMed] [Google Scholar]
- 46.Martin-Moreno JM, Apfel F, Sanchez JL, et al. The social nature of chronic noncommunicable diseases and how to tackle them through communication technology, training, and outreach. J Health Commun 2011;16(Suppl 2):94–106. [DOI] [PubMed] [Google Scholar]
- 47.Wang A, Stronks K, Arah OA. Global educational disparities in the associations between body mass index and diabetes mellitus in 49 low-income and middle-income countries. J Epidemiol Community Health 2014;68:705–11. [DOI] [PubMed] [Google Scholar]
- 48.Ebrahim S. Surveillance and monitoring: a vital investment for the changing burdens of disease. Int J Epidemiol 2011;40:1139–43. [DOI] [PubMed] [Google Scholar]
Associated Data
This section collects any data citations, data availability statements, or supplementary materials included in this article.