ABSTRACT
RhoF is a member of the Rho GTPase family that has been implicated in various cell functions including long filopodia formation, adhesion, and migration of cells. Although RhoF is expressed in lymphoid tissues, the roles of RhoF in B cell development remain largely unclear. On the other hand, other members of the Rho GTPase family, such as Cdc42, RhoA, and Rac, have been intensively studied and are known to be required for B cell development in the bone marrow and spleen. We hypothesized that RhoF is also involved in B cell development. To examine our hypothesis, we analyzed B cell development in RhoF knockout (KO) mice and found a significant reduction in marginal zone (MZ) B cells in the spleen, although T cell development in the thymus and spleen was not affected. Consistent with these results, the width of the MZ B cell region in the spleen was significantly reduced in the RhoF KO mice. However, the antigen-specific antibody titer of IgM and IgG3 after MZ B cell-specific antigen (T cell-independent antigen, type I) stimulation was not affected by RhoF deletion. Furthermore, we demonstrated that RhoF was dispensable for stromal cell-derived factor-1α- and B lymphocyte chemoattractant-induced B cell migration. These results suggest that RhoF promotes MZ B cell development in the spleen.
Key Words: RhoF, Rho GTPase family, B cell development, Marginal Zone B cell
INTRODUCTION
Rho family small GTPases such as Cdc42, RhoA, and Rac are involved in the proliferation, survival, and movement of cells through the regulation of actin cytoskeletal remodeling. Hematopoietic stem cell-specific deletion of murine Cdc42 significantly blocked B cell proliferation in the bone marrow (BM), resulting in a reduction in the number of mature B cells and antigen-specific antibody production.1) Similarly, in another study, hematopoietic stem cell-specific deletion of RhoA significantly reduced B cell survival in BM, leading to a marked reduction in the number of splenic B cells.2) Conversely, constitutive deletion of Rac2, a hematopoietic-specific Rho GTPase, in mice revealed that this protein is associated with marginal zone (MZ) B cell development through the regulation of migration activity of lymphocytes.3, 4) Thus, GTPases have been shown to have a strong association with B cell development. RhoF is expressed in hematopoietic and neuronal cells, regulating filopodia formation independently of Cdc42.5) RhoF differs from other Rho GTPases in terms of its function in long filopodia formation through its effectors mDia1 and mDia2.6-8) RhoF promotes axon formation in neuronal cells.9) Furthermore, RhoF is dispensable for platelet function. RhoF−/− platelets form filopodia with normal actin dynamics and spread normally on various agonist surfaces under static conditions and arterial shear. RhoF−/− platelets also aggregate normally and secrete alpha and dense granules in response to collagen-related peptide and thrombin stimulation.10) However, the immunological function of RhoF is not well understood.
In the present study, we hypothesized that RhoF functions in B cell development, particularly in MZ B cell development. The reason we focused on such a specific cell type is that MZ B cells shuttle between MZ and white pulp in the spleen, with dynamic morphological changes including filopodia formation. Moreover, they are believed to have undiscovered retention force, possibly long filopodia, against the white pulp-derived CXC chemokine ligand 13 (CXCL13) chemokine gradient.11) The MZ B cells are atypical B cells that do not recirculate into BM and are localized mainly in the splenic MZ. Splenic MZ B cells rapidly respond to blood-borne antigens as innate-like lymphocytes that mount rapid antibody responses to both T cell-dependent and -independent antigens. In mice, the blood passing through MZ contains sphingosine-1-phosphate (S1P), a lysophospholipid that binds to the S1P receptors S1PR1 and S1PR3 on MZ B cells.12) Signals from these receptors may interfere with the powerful attraction of B cells toward follicles that is exerted through CXC chemokine receptor 5 (CXCR5) in response to CXCL13 produced by follicular dendritic cells.13) Thus, mouse MZ B cells stall in MZ, whereas follicular B cells move toward the follicle along with the CXCL13 gradient.12, 13) However, precise mechanisms underlying MZ B cell development have not been widely investigated. Here we report that RhoF promotes MZ B cell development in the murine spleen.
MATERIALS AND METHODS
Generation of RhoF knockout mice
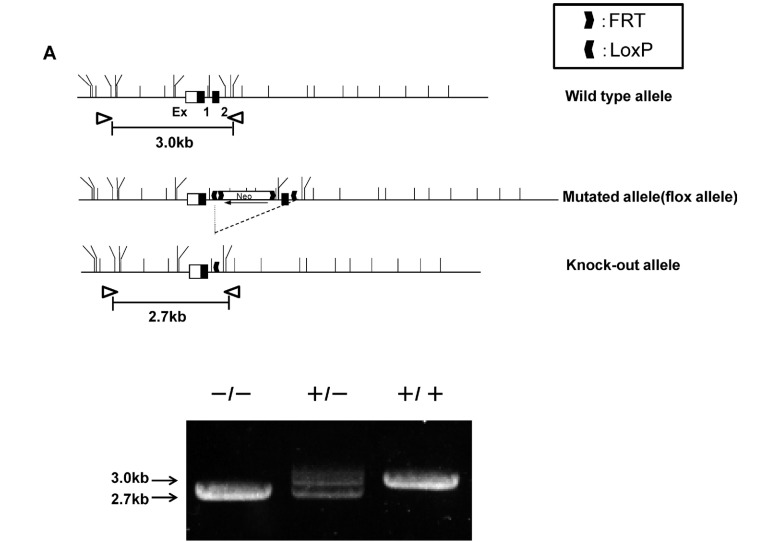
A linearized targeting vector was electroporated into EGR-G01 ES cells14) derived from 129Sv and screened for neomycin resistance. Two homologous recombinant ES clones were established and were independently injected into C57BL/6 blastocysts to generate chimeric mice. Male chimera derived from one ES clone transmitted the recombinant allele to the next generation (RhoF neo/flox allele). Exon 2 of RhoF gene with a FRT-Neo cassette were flanked by loxP sites to allow Cre-mediated deletion between them. Thus RhoF heterozygous knockout (KO) mice (RhoF+/− mice) were generated by crossing to CAG-Cre strain that constitutively expressed Cre recombinase (Fig. 1A).
Fig. 1.
Generation of RhoF KO mice.
A. The targeting vector, the wild-type RhoF allele, the targeted allele before (flox allele) and after Cre-mediated excitation of the loxP franked Neo cassette are schematically represented. Black boxes in the genomic structures represent exon sequences. Exon 2 of RhoF gene and an inserted FRT-Neo selection marker cassette were flanked by loxP sites such that deletion of exon 2 caused a frameshift mutation resulting in the loss of function. A constitutive knock-out was generated after Cre-mediated deletion of exon 2. Correct Cre-mediated excitation of the loxP franked Neo cassette was confirmed by the appearance of a 2.7 kb recombined instead of 3.0 kb targeted fragment in the PCR products.
Polymerase chain reactions (PCRs) were performed using the 5' external sense primer (5'-TGAGGTAGGGCTGGGTGAGTAGGCAGGCTGGAA) and the 3' antisense primer (5'-GCTGGGGAAGGGGGTCCAGAGTTTCACCTCAAT). The committee on Ethics of Animal Experiments of Nagoya University Graduate School of Medicine approved all experimental procedures (permit number: 26400).
Preparation of BM cells, splenocytes, and thymocytes
BM cells were flushed from one femur and tibia with 10% heat-inactivated FBS/RPMI 1640 and mixed with hemolytic buffer (0.15 M NH4Cl, 10 mM KHCO3, and 0.1 mM EDTA). Splenocytes and thymocytes were collected from the spleen and thymus, respectively, by pushing the tissue through a 100-μm cell strainer (352360; BD, Franklin Lakes, NJ, USA) mounted in the 10% FBS/ Roswell Park Memorial Institute (RPMI) 1640 medium (189-02025, Wako, Osaka, Japan) with the piston of a 2.5-ml syringe (SS-02SZ; Terumo, Tokyo, Japan). After hemolysis, the cells were suspended in 1% BSA (BAC62; Equitech-Bio, Kerrville, TX, USA)/PBS and passed through a 30-μm cell strainer (04-0042-2316; Partec, Muenster, Germany). Cell counts were performed with trypan blue (T8154; Sigma, St. Louis, MO, USA) diluted to 0.1% with PBS for dead cell exclusion.
Histological examinations
The spleen and thymus were excised, mounted in OCT compound (4583; Sakura Finetek, Torrance, CA, USA) in a plastic mold (4557; Sakura Finetek), and frozen in acetone that was cooled with liquid nitrogen. The frozen tissues were cut into 5-μm slices, mounted on glass slides (S9441; Matsunami, Osaka, Japan), dried at room temperature for 15 min, and fixed in 4% paraformaldehyde/PBS (163-20145; Wako, Osaka, Japan) in a refrigerator for 10 min. Hematoxylin (3002-2; Muto Pure Chemical, Tokyo, Japan) and eosin (3200-2; Muto Pure Chemical) were used for hematoxylin and eosin (HE) staining. HE-stained images were captured using BIOREVO BZ-9000 (Keyence, Osaka, Japan). For immunohistofluorescence staining, the fixed sections were blocked with 10% FBS/TBST (0.05 M Tris-HCl, pH 7.6, with 0.1% Tween 20) for 10 min at room temperature and reacted with anti-B220/eFluor570 (1:200, 41-0452-80; eBioscience, San Diego, CA, USA) and anti CD169/Fluorescein isothiocyanate (FITC) (1:100, MCA947F; AbD Serotec, Kidlington, Oxford, UK) for 15 min at room temperature. The antibody-reacted sections were incubated with 4’, 6-diamidino-2-phenylindol (final concentration 1 ug/ml, D9564; Sigma) for nuclear staining for 5 m at room temperature and mounted with Vectashield (H-1400; Vector Laboratories, Burlingame, CA, USA) and cover slips (C018181; Matsunami). Fluorescence images were captured using a laser scanning confocal microscope (LSM 700 equipped with an Axio Imager Z2; Carl Zeiss, Jena, Germany).
Phenotypic characterization of B and T lymphocyte populations by flow cytometry
For B cell subsets, the cells (106 cells/tube) derived from BM or the spleen were placed in 1.5-ml tubes with staining buffer (1% BSA/PBS) and treated with anti-CD16/32 (1:100, 14-0161-82; eBioscience) on ice for 5 min for blocking. After this step, the cells were stained with anti-B220-allophycocyanin (APC) (1:160, 103211; BioLegend, San Diego, CA, USA), anti-CD43-FITC (1:1000, 11-0431-81; eBioscience), anti-CD24-biotin (1:300, 13-0242-81; eBioscience), anti-BP1-phycoerythrin (PE) (1:80, 108307; BioLegend), anti-IgM-PE Cy7 (1:400, 406513; BioLegend), anti-IgD-PE (1:500, 405705; BioLegend), anti-CD23-biotin (1:200, 101603; BioLegend), and anti-CD21-PE antibody (1:80, 123409; BioLegend) on ice for 10 min. Streptavidin-PE Cy7 (1:1000, 557598; BD) and streptavidin-APC (1:1000, 17-4317-82; eBioscience) were used to detect CD24 and CD23, respectively. Before analysis, 7-amino-actinomycin D (7AAD) (1:60, 420404; BioLegend) was added to the samples. Analysis was performed using FACS Aria II (BD).
For T cell subsets, the cells derived from the spleen or thymus (2 × 10⁶ cells/tube) were placed in 1.5-ml tubes with staining buffer (5% FCS/0.1% sodium azide/PBS) and stained with anti-TCRβ-PE (1:200, 553172; BD), anti-CD4-FITC (1:100, 553046; BD), and anti-CD8-APC (1:200, 553035; BD) for 10 min at 4 °C. Analysis was performed using FACS Canto II (BD).
Immunization
For immunization, 20 μg of 2,4,6-trinitrophenyl-lipopolysaccharide (TNP-LPS) diluted in 200 μl of PBS/mouse (T-5065-5; Biosearch Technologies, Petaluma, CA, USA) was administered by intraperitoneal injection. Blood was collected before and after immunization at designated time points. After sampling, blood was incubated for 30 min at room temperature and incubated at 4 °C overnight. Serum was collected after centrifugation at 1000 g for 20 min at 4 °C.
Enzyme-Linked Immunosorbent Assay
Enzyme-Linked Immunosorbent Assay (ELISA) was performed with the serum samples diluted 20 times in 1% BSA/PBS (staining buffer). The wells of 96-well plates (9017; Corning Inc., Corning, NY, USA) were coated with 10 μg/ml of TNP-BSA (45 μl/well, T-5050-10; Biosearch Technologies) and incubated for 1 h at room temperature. All incubation procedures were performed in 96-well plates covered with plastic wraps. After coating, the plates were washed six times with tap water before the staining buffer was added (200 μl/well) for blocking. Following 30 min of blocking at room temperature, the diluted serum samples were added to the wells (45 μl/well, in duplicate for one sample). The staining buffer was used as a blank. The reaction was performed for 30 min at 37 °C. Anti-IgM-biotin (1:1000, 406503; BioLegend) or anti-IgG3-biotin (1:1000, 406803; BioLegend) was added to the wells (45 μl/well) and incubated for 30 min at 37 °C (after washing six times with tap water), followed by streptavidin-alkaline phosphatase for 30 min at room temperature (1:3000, 7100-04; Southern Biotech, Birmingham, AL, USA). Finally, alkaline phosphatase substrate (172-1063; BioRad, Hercules, CA, USA) was added to the wells (45 μl/well), and absorbance was recorded using a microplate reader (405-nm filter, iMark; BioRad, Hercules, CA, USA) at 4, 8, 16, and 32 min. The antigen-specific antibody titer was determined by calculating optical density at 405 nm.
Migration Assay
Migration assay was performed as described previously.3, 15) In brief, total splenocytes were suspended in 10% FBS/RPMI1640 at 107 cells/ml, and 100 µl (106 cells) of the cell suspension was added to the upper chamber of Transwell (3421; Corning). In the lower chamber, 600 μl of 10% FBS/RPMI1640 with or without 800 ng/ml of CXCL13 (470-BC-025/CF; R&D systems, Minneapolis, MN, USA) or 200 ng/ml of stromal cell-derived factor-1α (SDF-1α; 460-SD-010/CF; R&D systems) was added. After 3 h of incubation at 37 °C in 5% CO2, cells collected from the lower chamber and 106 cells from the input were stained with anti-IgM-PE-Cy7 (1:400, 406513; BioLegend), anti-CD21-PE (1:80, 123409; BioLegend), and anti-CD23-biotin (1:200, 101603; BioLegend) and then reacted with anti-CD16/32 antibody (1:100, 101302; BioLegend) as described above. Streptavidin-APC (1:1000, 17-4317-82; eBioscience) and 7AAD (1:60, 420404; BioLegend) were used as a secondary reagent and for dead cell exclusion, respectively. In FACS analysis, 60-sec recording was performed (at a flow rate of 5) using FACS Aria II (BD). Finally, the number of MZ B cells in the lower chamber was divided by the number in the input.
Statistical Analysis
Data are presented as mean ± standard deviation. The difference in the average values between two groups was analyzed using the unpaired (for MZ B cell region) or paired (for other data) t-test (gender- and age-matched). For ELISA data, two-way ANOVA with Bonferroni’s multiple comparison was applied. The P value of <0.05 was considered as significant. Analysis was performed using Prism 5.0 (Version 5.02; GraphPad Software, La Jolla, CA, USA).
RESULTS
Generation of RhoF KO mice
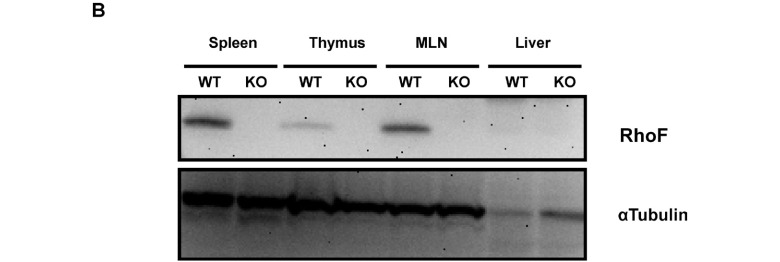
To investigate the function of RhoF in lymphocytes, we deleted exon 2 of RhoF gene using the Cre-loxP system as described above. The constitutive RhoF KO mice were viable and healthy with no external phenotypic abnormalities. The mice were obtained in the expected Mendelian ratio; of 154 offspring of heterozygote pairings, 40 were wild-type (WT) (40/154, 26.0%), 74 were heterozygous (74/154, 48.0%), and 40 were RhoF KO (40/154, 26.0%). We also examined RhoF protein expression in the WT mouse spleen, thymus, and mesenteric lymph node. RhoF was not expressed in the WT mouse liver. Absence of RhoF protein (21 kDa) in the KO tissues was confirmed by immunoblotting (Fig. 1B).
Fig. 1.
Generation of RhoF KO mice.
B. Western blot analysis of the immune tissues in the wild-type (WT) or RhoF KO mice (7 weeks old, female). RhoF expression was observed in the spleen, thymus, and mesenteric lymph node (MLN) of the WT mice. On the other hand, the expression was absent in the KO mice. RhoF was not expressed in the liver both in WT and RhoF KO mice. α-tubulin was used as a loading control. Thirty micrograms of protein/lane was loaded. Representative figures are shown from one of the two independent experiments.
HE staining of the thymus and spleen
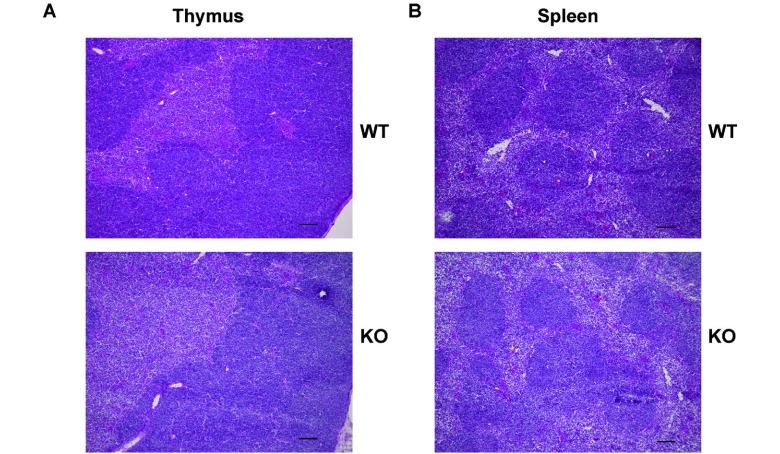
HE staining of the thymus (Fig. 2A) revealed no significant difference in histological features between the WT and KO mice. Similarly, HE staining of the spleen (Fig. 2B) showed neither lymphoid hyperplasia nor loss of the white pulp architecture (Fig. 2B). These results indicate that RhoF is not associated with the formation of the fundamental architecture of the thymus and spleen.
Fig. 2.
HE staining of the thymus and spleen.
A. HE staining of the thymus from the WT and KO mice (9 weeks old, female). Frozen sections were fixed in 4% PFA and stained with HE. The figures are representatives of two samples (from two mice in each group). Scale bars: 100 μm.
B. HE staining of the spleen from WT and KO mice (6 weeks old, female). Frozen sections were fixed in 4% PFA and stained with HE. The figures are representatives of two samples (from two mice in each group). Scale bars: 100 μm.
Effects of RhoF deletion on T cell development
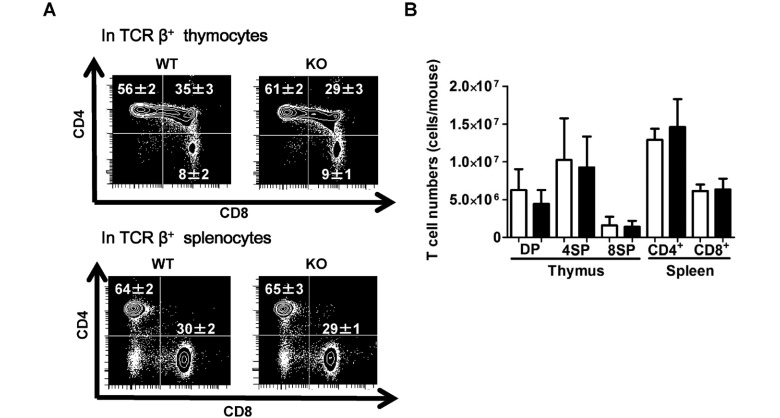
No significant differences were observed between the WT and RhoF KO mice in terms of the numbers of thymocytes and splenocytes. In FACS analysis, the percentage of CD4+ CD8− T cells was significantly increased and that of CD4+ CD8+ T cells was significantly decreased in TCRβ+ thymocytes (Fig. 3A), whereas no significant difference was observed in the percentage of T cell subsets in TCRβ+ splenocytes (Fig. 3A). However, the number of each T cell subset in both tissues was not different between the WT and KO mice (Fig. 3B). These results indicate that RhoF has no effect on T cell development in the thymus and kinetics in the spleen.
Fig. 3.
Analysis of T cell development in thymus and spleen.
A. FACS analysis of T cell subsets. Thymocytes (upper) and splenocytes (lower) from the WT and RhoF KO mice (6 weeks old, n = 4, male: 50%) were stained with antibodies against TCRβ, CD4, and CD8 and analyzed by flow cytometry. The numbers show the percentage (mean ± standard deviation) of the target subpopulation within the indicated parent population. The dot plots are representatives from two independent experiments.
B. The number of each T cell subset was calculated by multiplying the total number of viable (trypan blue negative) thymocytes (DP: TCRβ+ CD4+ CD8+ cells, 4SP: TCRβ+ CD4+ CD8− cells, 8SP: TCRβ+ CD4− CD8+ cells) or viable splenocytes (CD4+: TCRβ+ CD4+ CD8− cells, CD8+: TCRβ+ CD4− CD8+ cells) by the fraction of the target population in thymocytes using the data from FACS analysis. The data are shown as mean ± standard deviation (6 weeks old, n = 4, male: 50%). White bars: WT. Black bars: RhoF KO.
Effects of RhoF deletion on B cell development
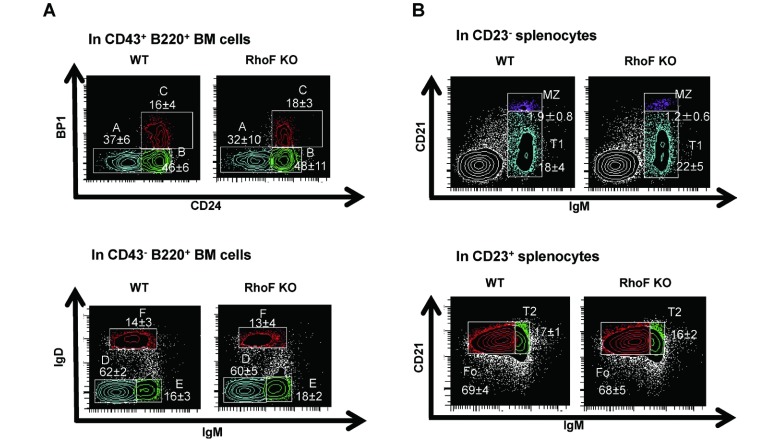
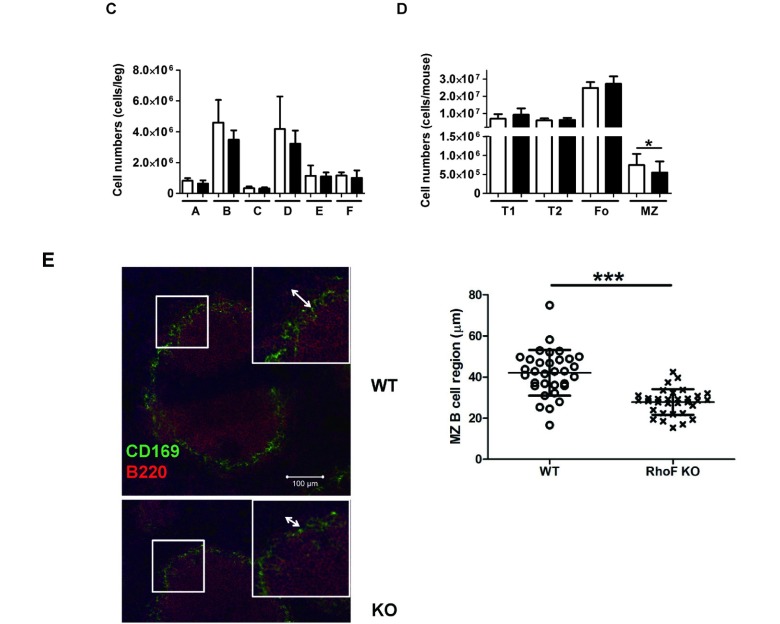
In FACS analysis, no significant difference was observed in the percentage and the cell number of germline proB cells (BP1− CD24−), DJ rearranged-proB cells (BP1− CD24+), or early preB cells (BP1+ CD24+) in CD43+ B220+ BM cells between the groups. Similarly, no significant difference was observed in late preB cells (IgD− IgM−), newly formed B cells (IgD− IgM+), or follicular-type recirculating B cells (IgD+ IgM+) in CD43− B220+ BM cells (Fig. 4A, 4C). However, a significant reduction was observed in the percentage (in CD23− cells) and the number of MZ B cells (CD21+ IgM+ CD23−) in the RhoF KO spleen, although Transitional 1 (T1) (CD21− IgM+ CD23−), Transitional 2 (T2) (CD21+ IgM+ CD23+), and mature follicular (Fo) (CD21+ IgM− CD23+) B cells were not affected (Fig. 4B, 4D). In support of these observations, immunohistostaining for CD169 and B220 in the RhoF KO spleen sections revealed narrowing of the MZ B cell region (B220+ region outside CD169+ MZ macrophages) compared with that in the WT spleen (Fig. 4E). These results strongly suggest that RhoF promotes MZ B cell development in the murine spleen.
Fig. 4.
Analysis of B cell development in bone marrow and spleen.
A. FACS analysis of BM B cells. BM cells from WT and RhoF KO mice (6–7 weeks old, n = 5, male: 40%) were stained with antibodies against CD43, B220, BP1, and CD24 and analyzed by flow cytometry. The number shows the percentage (mean ± standard deviation) of the indicated subpopulation within the parent population; Fraction A (germline pro-B cells), fraction B (DJ-rearranged pro-B cells), fraction C (Early pre-B cells), fraction D (Late pre-B cells), fraction E (newly formed B cells), and fraction F (follicular-type recirculating B cells). The figures are representatives of three independent experiments.
B. FACS analysis of B cells from the spleen. Splenocytes from WT and RhoF KO mice (6–7 weeks old, n = 6, male: 33%) were stained with antibodies against CD23, CD21, and IgM and analyzed by flow cytometry. The number shows the percentage (mean ± standard deviation) of the indicated subpopulation within the parent population; T1 (Transitional 1), T2 (Transitional 2), Fo (mature follicular B cells), and MZ (MZ B cells).
C. The number of B cell subsets in BM was calculated by multiplying the total number of viable (trypan blue negative) BM cells by the fraction of the target population in viable (7AAD negative) cells. The data are shown as mean ± standard deviation (6–7 weeks old, n = 5, male: 40%). White bars: WT. Black bars: RhoF KO.
D. The number of B cell subsets in the spleen was also calculated by multiplying the total number of viable (trypan blue negative) splenocytes by the fraction of the target population in viable (7AAD negative) cells. The data were shown as mean ± standard deviation (6–7 weeks old, n = 6, male: 33%). White bars: WT. Black bars: RhoF KO. *: P < 0.05, WT vs. RhoF KO
E. Immunohistostaining of CD169 (Green, MZ metallophilic macrophages) and B220 (Red, B cells) in WT (upper left panel) and RhoF KO (lower left panel) spleen. Scale bars: 100 μm. The widths of the MZ B cell region (B220-positive region outside CD169-positive cells) in the WT and RhoF KO mice are summarized (right panel, n = 32). Four MZ B cell regions per section were captured for four individual sections per mouse, and two mice per group were used for this experiment. Circles: WT. Crosses: RhoF KO. ***: P< 0.0001, WT vs. RhoF KO
Effect of RhoF deletion on immune response
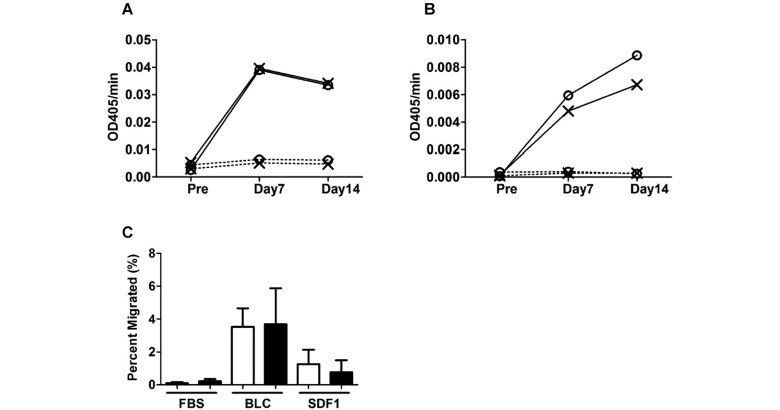
Given that RhoF deficiency led to a reduction in MZ B cells, we next investigated whether antibody production from those cells after antigen stimulation was reduced. Antigen(TNP-LPS)-specific antibody titers of IgM and IgG3 were not different between the WT and KO mice (Fig. 5A, 5B). These results imply that RhoF does not function in the immune response against TNP-LPS.
Fig. 5.
Immune response and migration of B cells.
A. Littermate WT control and RhoF KO mice were immunized with 20 μg of TNP-LPS (200 μl/mouse; WT, 6–8 weeks old, n = 7, male: 86%, KO, 6–9 weeks old, n = 5, male: 80%) or PBS (200 μl/mouse; WT, 6–15 weeks old, n = 9, male: 78%, KO, 6–18 weeks old, n = 9, male: 78%) by injection into the peritoneal cavity and bled at designated time points. Antibody titers of TNP-specific IgM were measured by ELISA. Circles: WT. Crosses: RhoF KO.
B. Antibody titers of TNP-specific IgG3 at the indicated time point were measured by ELISA. The samples were same as those for TNP-specific IgM in Figure 5A. Circles: WT. Crosses: RhoF KO.
C. Migration assay of MZ B cells. Total splenocytes (106 cells/well) were placed in the upper chamber of Transwell, which was set on the lower chamber with 10% FBS/RPMI 1640 medium with or without BLC (800 ng/ml, BLC) or SDF-1α (200 ng/ml, SDF1). In this experiment, FACS analysis (with anti-CD21, IgM, and CD23) was performed using the input cells and cells in the lower chamber after incubation, to calculate the percentage of MZ B cells that migrated into the lower chamber. The data are shown as mean ± standard deviation (11–12 weeks old, n = 4, male: 50%) from two independent experiments. White bars: WT. Black bars: RhoF KO.
Effects of RhoF deletion on B cell migration
The decrease in the number of MZ B cells in the KO spleen suggested that RhoF could be important for chemokine-directed migration of MZ B cells. Therefore, we analyzed the migration activity of the RhoF KO MZ B cells against B lymphocyte chemoattractant (BLC) and SDF-1α. Contrary to our expectations, the results showed that the migration activities of RhoF KO MZ B cells toward BLC and SDF-1α were not different compared with those of WT MZ B cells (Fig. 5C). These results indicate that RhoF is not associated with the migration of MZ B cells toward BLC and SDF-1α. Next, we investigated whether the localization of the MZ B cells was normal (Fig. 4E). In this part of the experiment, we stained spleen sections derived from the WT or RhoF KO mice with anti-B220 (a B cell marker) and anti-CD169 (a MZ metallophilic macrophage marker) antibodies. As shown in Fig. 4E, the length of the MZ B cell region in the KO mice was significantly reduced compared with that in the WT mice.
DISCUSSION
In this study, we confirmed that RhoF is expressed in immune tissues (Fig. 1B). We also confirmed removal of exon 2 of RhoF gene by PCR (Fig. 1A) and deletion of RhoF protein by immunoblotting in the RhoF KO mice (Fig. 1B). Neither tissue architecture of the thymus nor the fraction of T cell subsets in the thymus and spleen were affected by RhoF deletion (Fig. 2A, 3A, 3B ). On the other hand, the RhoF KO mice showed a significant reduction in MZ B cells in the spleen (Fig. 4B, 4D, 4E). The MZ B cells play important roles in T cell-independent antigen responses.1, 11) For example, Rac2 KO mice have fewer MZ B cells than WT mice and display altered antibody production after T cell-independent antigen stimulation.3) Therefore, the RhoF KO mice were believed to display abnormal antibody production. However, the RhoF KO mice responded normally to T cell-independent antigen (type I, TNP-LPS) in this study (Fig. 5A, 5B). These results demonstrate that RhoF promotes MZ B cell development in mice but is not associated with the immune response against T cell-independent antigen (type I). One possible explanation for the lack of major phenotype in RhoF KO mice is that RhoF plays redundant roles in immune systems for which other GTPases can compensate.
In the present study, MZ B cells were reduced in number and a thin layer of MZ B cells formed in the KO spleen (Fig. 4E). In the splenic follicular area, BLC gradients were formed and follicular B cells were attracted to the follicular area along the chemokine gradient.11, 13, 16) On the other hand, the MZ B cells were localized around MZ by interfering with the chemokine gradient via the expression of integrins and Rho GTPase-associated genes.11) Accordingly, we proposed that reduction in MZ B cells in the KO spleen might be caused by the altered migration of these cells into the follicular area along the BLC–CXCR5 axis. To investigate this, we performed a migration assay with BLC for the MZ B cells. As shown in Fig. 5C, we observed no significant difference in the migration activity of the MZ B cells between the WT and KO mice. Thus, the reduction in the MZ B cell area may be caused by a reduction in MZ B cell numbers and not by the altered migration activity of RhoF KO MZ B cells.
Previous studies have demonstrated that MZ B cell development is impaired in Cdc42, Rac2, and RhoA KO mice through various mechanisms such as altered B cell proliferation, migration, survival, and motility.1-4) In this study, we have shown that RhoF is also associated with MZ B cell development through as yet unknown mechanisms. It is possible that the proliferation and/or survival of B cells in the KO mice may be attributable to the reduction in MZ B cells because our data showed that migratory activity and motility seem to be normal (Fig. 5C). In vitro examination of the proliferation and/or survival of B cells is warranted to clarify the precise function of RhoF in MZ B cell development, and Notch and toll-like receptor (TLR) signals should also be considered.11) Signals from Bruton’s tyrosine kinase (BTK) block the differentiation of mouse T2 B cells into MZ B cells by inhibiting inductive signals from Notch2.11, 17-23) Accordingly, relatively strong B-cell receptor (BCR) signals and BTK inhibitory signals are required for the generation of mature follicular B cells, while relatively weak BCR and Notch2 signals with NF-κB signaling are essential for MZ B cell formation.20, 21) In addition, MZ B cells can develop from T2 cells in the spleen through TLR signaling without BCR activation.24, 25) Thus, two scenarios are possible. First, RhoF might positively regulate BCR, Notch2, or BTK signaling, possibly through actin cytoskeletal remodeling. Second, RhoF might activate TLR signaling to promote MZ B cell production from T2 cells. To examine these ideas, experiments that assess signaling molecules (and also phosphorylated products) in the spleen and/or T2 cells derived from RhoF KO mice are warranted in the future. These experiments will help explain precise mechanisms underlying MZ B cell reduction in RhoF KO mice.
ACKNOWLEDGMENTS
We would like to thank Dr. Y. Naoe for FACS analysis of the T cell subsets and valuable advice and suggestions. We wish to acknowledge the technical assistance of Mses. Y. Esaki, and K. Kawata for producing RhoF mutant chimeric mice. We are also grateful to Mses. K. Sannodo, T. Hayakawa, N. Matsui, and E. Kikuchi for mouse breeding, genotyping and secretarial work, respectively. This work was supported by JSPS KAKENHI Grant Number 24591416, MEXT/JSPS KAKENHI Grant Number 26750350, and by the Research Funding for Longevity Sciences (25-5&26-22) from the National Centre for Geriatrics and Gerontology, Japan.
REFERENCES
- 1).Guo F, Velu CS, Grimes HL, Zheng Y. Rho GTPase Cdc42 is essential for B-lymphocyte development and activation. Blood, 2009; 114: 2909–2916. [DOI] [PMC free article] [PubMed]
- 2).Zhang S, Zhou X, Lang RA, Guo F. RhoA of the Rho family small GTPases is essential for B lymphocyte development. PLoS One, 2012; 7: e33773. [DOI] [PMC free article] [PubMed]
- 3).Croker BA, Tarlinton DM, Cluse LA, Tuxen AJ, Light A, Yang FC, Williams DA, Roberts AW. The Rac2 guanosine triphosphatase regulates B lymphocyte antigen receptor responses and chemotaxis and is required for establishment of B-1a and marginal zone B lymphocytes. J Immunol, 2002; 168: 3376–3386. [DOI] [PubMed]
- 4).Walmsley MJ, Ooi SK, Reynolds LF, Smith SH, Ruf S, Mathiot A, Vanes L, Williams DA, Cancro MP, Tybulewicz VL. Critical roles for Rac1 and Rac2 GTPases in B cell development and signaling. Science, 2003; 302: 459–462. [DOI] [PubMed]
- 5).Pellegrin S, Mellor H. The Rho family GTPase Rif induces filopodia through mDia2. Curr Biol, 2005; 15: 129–133. [DOI] [PubMed]
- 6).Aspenstrom P, Fransson A, Saras J. Rho GTPases have diverse effects on the organization of the actin filament system. Biochem J, 2004; 377: 327–337. [DOI] [PMC free article] [PubMed]
- 7).Melendez J, Stengel K, Zhou X, Chauhan BK, Debidda M, Andreassen P, Lang RA, Zheng Y. RhoA GTPase is dispensable for actomyosin regulation but is essential for mitosis in primary mouse embryonic fibroblasts. J Biol Chem, 2011; 286: 15132–15137. [DOI] [PMC free article] [PubMed]
- 8).Fan L, Mellor H. The small Rho GTPase Rif and actin cytoskeletal remodelling. Biochem Soc Trans, 2012; 40: 268–272. [DOI] [PubMed]
- 9).Goh WI, Sudhaharan T, Lim KB, Sem KP, Lau CL, Ahmed S. Rif-mDia1 interaction is involved in filopodium formation independent of Cdc42 and Rac effectors. J Biol Chem, 2011; 286: 13681–13694. [DOI] [PMC free article] [PubMed]
- 10).Goggs R, Savage JS, Mellor H, Poole AW. The small GTPase Rif is dispensable for platelet filopodia generation in mice. PLoS One, 2013; 8: e54663. [DOI] [PMC free article] [PubMed]
- 11).Cerutti A, Cols M, Puga I. Marginal zone B cells: virtues of innate-like antibody-producing lymphocytes. Nat Rev Immunol, 2013; 13: 118–132. [DOI] [PMC free article] [PubMed]
- 12).Cinamon G, Matloubian M, Lesneski MJ, Xu Y, Low C, Lu T, Proia RL, Cyster JG. Sphingosine 1-phosphate receptor 1 promotes B cell localization in the splenic marginal zone. Nat Immunol, 2004; 5: 713–720. [DOI] [PubMed]
- 13).Cinamon G, Zachariah MA, Lam OM, Foss FW, Jr., Cyster JG. Follicular shuttling of marginal zone B cells facilitates antigen transport. Nat Immunol, 2008; 9: 54–62. [DOI] [PMC free article] [PubMed]
- 14).Fujihara Y, Kaseda K, Inoue N, Ikawa M, Okabe M. Production of mouse pups from germline transmission-failed knockout chimeras. Transgenic Res, 2013; 22: 195–200. [DOI] [PubMed]
- 15).Reif K, Ekland EH, Ohl L, Nakano H, Lipp M, Forster R, Cyster JG. Balanced responsiveness to chemoattractants from adjacent zones determines B-cell position. Nature, 2002; 416: 94–99. [DOI] [PubMed]
- 16).Cyster JG. Chemokines, sphingosine-1-phosphate, and cell migration in secondary lymphoid organs. Annu Rev Immunol, 2005; 23: 127–159. [DOI] [PubMed]
- 17).Martin F, Kearney JF. Positive selection from newly formed to marginal zone B cells depends on the rate of clonal production, CD19, and btk. Immunity, 2000; 12: 39–49. [DOI] [PubMed]
- 18).Wen L, Brill-Dashoff J, Shinton SA, Asano M, Hardy RR, Hayakawa K. Evidence of marginal-zone B cell-positive selection in spleen. Immunity, 2005; 23: 297–308. [DOI] [PubMed]
- 19).Cariappa A, Tang M, Parng C, Nebelitskiy E, Carroll M, Georgopoulos K, Pillai S. The follicular versus marginal zone B lymphocyte cell fate decision is regulated by Aiolos, Btk, and CD21. Immunity, 2001; 14: 603–615. [DOI] [PubMed]
- 20).Pillai S, Cariappa A. The follicular versus marginal zone B lymphocyte cell fate decision. Nat Rev Immunol, 2009; 9: 767–777. [DOI] [PubMed]
- 21).Cariappa A, Boboila C, Moran ST, Liu H, Shi HN, Pillai S. The recirculating B cell pool contains two functionally distinct, long-lived, posttransitional, follicular B cell populations. J Immunol, 2007; 179: 2270–2281. [DOI] [PubMed]
- 22).Allman D, Pillai S. Peripheral B cell subsets. Curr Opin Immunol, 2008; 20: 149–157. [DOI] [PMC free article] [PubMed]
- 23).Thomas MD, Srivastava B, Allman D. Regulation of peripheral B cell maturation. Cell Immunol, 2006; 239: 92–102. [DOI] [PubMed]
- 24).Genestier L, Taillardet M, Mondiere P, Gheit H, Bella C, Defrance T. TLR agonists selectively promote terminal plasma cell differentiation of B cell subsets specialized in thymus-independent responses. J Immunol, 2007; 178: 7779–7786. [DOI] [PubMed]
- 25).Viau M, Zouali M. B-lymphocytes, innate immunity, and autoimmunity. Clin Immunol, 2005; 114: 17–26. [DOI] [PubMed]


