

Abstract
Background
Data are sparse regarding the impacts of habitual physical activity (PA) and sedentary behavior on cardiovascular (CV) risk in older adults with mobility limitations.
Methods and Results
This study examined the baseline, cross‐sectional association between CV risk and objectively measured PA among participants in the Lifestyle Interventions and Independence for Elders (LIFE) study. The relationship between accelerometry measures and predicted 10‐year Hard Coronary Heart Disease (HCHD) risk was modeled by using linear regression, stratified according to CVD history. Participants (n=1170, 79±5 years) spent 642±111 min/day in sedentary behavior (ie, <100 accelerometry counts/min). They also spent 138±43 min/day engaging in PA registering 100 to 499 accelerometry counts/min and 54±37 min/day engaging in PA ≥500 counts/min. Each minute per day spent being sedentary was associated with increased HCHD risk among both those with (0.04%, 95% CI 0.02% to 0.05%) and those without (0.03%, 95% CI 0.02% to 0.03%) CVD. The time spent engaging in activities 100 to 499 as well as ≥500 counts/min was associated with decreased risk among both those with and without CVD (P<0.05). The mean number of counts per minute of daily PA was not significantly associated with HCHD risk in any model (P>0.05). However, a significant interaction was observed between sex and count frequency (P=0.036) for those without CVD, as counts per minute was related to HCHD risk in women (β=−0.94, −1.48 to −0.41; P<0.001) but not in men (β=−0.14, −0.59 to 0.88; P=0.704).
Conclusions
Daily time spent being sedentary is positively associated with predicted 10‐year HCHD risk among mobility‐limited older adults. Duration, but not intensity (ie, mean counts/min), of daily PA is inversely associated with HCHD risk score in this population—although the association for intensity may be sex specific among persons without CVD.
Clinical Trial Registration
URL: www.clinicaltrials.gov Unique identifier: NCT01072500
Keywords: accelerometry, aging, CVD, Framingham, physical activity
Introduction
Cardiovascular (CV) disease (CVD) is the leading cause of death in the United States and worldwide.1 In the United States, >2200 Americans die every day from CV causes. Physical activity (PA) is one of the best known interventions to improve health and decrease the risk of CVD events in a variety of populations.2–3 However, most studies focus on engagement in programs consisting of moderate‐ to vigorous‐intensity PA. Less is known about how lower‐intensity activities influence the risk of CV events. Data in this area could have important implications for making PA recommendations, particularly among populations with health issues that limit their ability to engage in higher volumes or intensities of PA.
Older adults represent a particularly relevant population. Persons >65 years old account for nearly 70% of CVD‐related deaths4 and for nearly 75% of CV health care expenditures.5 Although associations between the quantity of PA and CV risk factors have been reported in older adults, few have made these connections by using objective measurements of PA. To date, most studies have relied on self‐reported measures of PA. As such, these data lack reliability in a clinical setting6 and do not accurately classify the volume and/or intensity of PA. Moreover, although moderate‐ to vigorous‐intensity PA has been shown to have an inverse relationship with CV risk factors and morbidity,2 it is unknown to what extent lower‐intensity activities reduce CV risk. Many older adults are sedentary and have physical limitations that impair their ability to engage in PA, particularly at higher intensities. Determining if lower‐intensity activities influence CV risk could have important implications for sedentary and physically limited older adults.
Interest is also emerging in the potentially deleterious effects of sedentary behavior on CV risk—independent of engagement in PA. However, how this association manifests in older adults with physical limitations is currently unknown. Studies in middle‐aged adults suggest that moderate to vigorous PA may not fully protect against the adverse health consequences of prolonged sedentary behavior,7–8 while others claim that low‐intensity PA can ameliorate some of the cardiometabolic risk of sedentary behavior.9–10 To date, no studies have examined whether time spent performing lower‐intensity activities mitigates the risks of sedentary behavior in older adults with physical limitations.
Accordingly, the objective of the present study was to evaluate associations among objectively measured PA, sedentary behavior, and CV risk factors in older adults with mobility limitations. This study is a cross‐sectional analysis of data collected at baseline in the Lifestyle Interventions and Independence for Elders (LIFE) Study. LIFE was a multisite, phase 3 randomized clinical trial designed to determine if long‐term PA prevents mobility disability among sedentary older adults.11 The present analysis examined associations of indices of objectively measured PA and sedentary behavior with individual CV risk factors as well as predicted risk of cardiac events using the Framingham risk score for Hard Coronary Heart Disease (HCHD).
Methods
Participants and Study Entry
The LIFE Study team recruited a total of 1635 participants from 8 locations throughout the United States.12 Details about specific study inclusion and exclusion criteria of the LIFE Study have been reported previously.13 Briefly, participants were eligible for the study if they (1) were between the ages of 70 and 89 years, (2) were at a high risk for mobility disability based on objectively measured lower extremity functional limitations, (3) able to walk 400 m in ≤15 minutes, (4) reported spending <20 min/wk in moderate to vigorous PA, (5) displayed satisfactory cognitive function, and (6) were able to safely participate in the PA or health education intervention. The LIFE Study was registered with www.clinicaltrials.gov before enrollment in the trial (NCT01072500).
A thorough medical screening was performed to ensure the safety of potential participants. The screening included an initial telephone screening, a prescreening visit where the study was presented to the participant, a question and answer session, a prescreening consent form, tests of physical performance, and the Community Healthy Activities Model Program for Seniors (CHAMPS) PA questionnaire.14 Additional procedures relevant to the present study included the collection of demographic information and administration of the Modified Mini‐Mental State (3MS) Examination,15 Pittsburgh Sleep Quality Index (PSQI),16 and the Center for Epidemiologic Studies–Depression Scale (CES‐D).17 All participants provided written informed consent, and the study protocol was approved by the institutional review boards of all participating institutions.
Accelerometry
Sedentary behavior and PA were objectively measured by using a hip‐worn, solid‐state triaxial accelerometer (ActiGraph GT3X). Participants were asked to wear the device at all times—except while bathing, sleeping at night, or swimming—for a minimum of 7 consecutive days. Accelerometry data were collected at baseline, before randomization. Movement was captured along the vertical axis in 1‐second epochs, and nonwear time was classified by using a previous published algorithm18 that flags areas where there is a 90‐minute time window of 0 counts/min after allowing a 2‐minute interval of nonzero counts for artifactual movement detection. In the present study, we limited our analyses to participants who wore the device for at least 10 hours per day for a minimum of 3 days. Currently, there are no well‐accepted, evidence‐based accelerometry cutpoints for sedentary behavior and PA in mobility‐limited older adults. Therefore, cutpoints were chosen based on initial evaluation of data collected during a LIFE Study PA session,14 and current best practices from the literature. Sedentary behavior was defined as <100 counts/min9 and PA was categorized into 2 incremental intensity categories identified by accelerometer‐detected ranges of 100 to 499 counts/min and activities registering ≥500 counts/min. The latter cutpoint was selected based on the relatively narrow range of activity intensities given the overall reduced activity level of the study population. For example, we found that no participants engaged in behaviors producing accelerometer values >2020 counts/min—a value used by the National Health and Nutrition Examination Survey (NHANES) to categorize moderate‐ to vigorous‐intensity PA in a general population.2
Framingham Score
Predicted CV risk was calculated by using the Framingham HCHD risk prediction model. The Framingham Risk Score assesses the sex‐specific risk for adverse CV health incidents. In general, the sex‐specific Framingham predictions perform well among whites and blacks in different settings and can be applied to other ethnic groups after recalibration.19 Based on risk of experiencing a myocardial infarction or coronary death, the HCHD prediction was chosen for its applicability to the LIFE Study population. Predicted 10‐year HCHD risk was calculated according to a previously established equation in the Executive Summary of the Third Report of the National Cholesterol Education Program.20 The risk score reflects the percent risk of experiencing a HCHD event within the next 10 years. Variables used to calculate the risk score include age, total cholesterol, high‐density lipoprotein (HDL) cholesterol, systolic blood pressure, smoking status, and use of antihypertensive medications.
Statistical Analysis
The present study includes cross‐sectional data collected at baseline from a total of 1170 participants in the LIFE Study. Data were excluded from a total of 465 individuals to achieve the final sample size (n=29 individuals missing data on smoking status, n=15 individuals missing information on medication use, and n=421 without sufficient accelerometry data as determined by using wear time criteria) to achieve the final sample size. Linear regression models were used to investigate the relationship of each of the accelerometer‐based variables to the predicted 10‐year Framingham HCHD risk score. Regression models were stratified according to the prevalence of known prior history of CVD. Standardized coefficients and 95% confidence intervals were estimated for 4 models controlling for potential confounders. The first model was adjusted for wear time only. A second model adjusted for wear time and prevalent diabetes. A third model adjusted for model 2 adjustments as well as mediation use (ie, antihypertensive and lipid‐lowering drugs) and demographic characteristics not already controlled for in the HCHD risk score (race, education, income, marital status, and living alone). Finally, a fourth model adjusted for all prior adjustments and additional non‐CVD comorbidities (ie, 3MS, PSQI, and CES‐D scores). The relationship between modifiable components of the predicted 10‐year Framingham HCHD risk score and accelerometer‐based variables were also estimated for those with and without prevalent CVD using separate linear regression models that include the model 4 adjustments. In a sensitivity analysis, because the 10‐year HCHD risk score had a skewed distribution, we examined the impact of the log transforming the HCHD risk scores on our conclusions. The residuals were more nearly normally distributed but the conclusions did not change (data not shown).
Results
Data from a total of 1170 LIFE Study participants were included in the present study. Demographic characteristics of the included and excluded participants are displayed in Table 1. The mean (±SD) age of included participants was 78.7±5.3 years, 66.1% were women, and 22.5% were racial/ethnic minorities. Just under half of participants reported living alone (47.9%), corresponding with a large proportion (40.2%) who self‐reported being widowed (38.2% reported being currently married). The majority of participants reported having a college education (64.0%) with current incomes between $15 000 and $75 000/year (63.3%). Approximately 10.5% of individuals did not provide income data. In general, participants were cognitively intact based on scores on the 3MS examination (91.9±5.2 points). On average, participants showed low levels of depressive symptoms according to CES‐D score (9.4±9.0) and had relatively poor sleep quality according to the PSQI score (6.4±3.8). Additional detail regarding included participant risk factors and medical history is provided in Table 2. Notably, age (P=0.086) and sex (P=0.138) characteristics were similar between participants with and without accelerometry data. However, a significant difference was observed for race (P=0.009) between those with and without accelerometry data, as the relative proportion of nonwhites was significantly higher among those without accelerometry data (28.6%) compared with those with accelerometry data in the present analysis (22.5%). The proportion of individuals living alone was significantly higher (P=0.029) among those without accelerometry data (53.9%) compared with those with accelerometry data (47.9%).
Table 1.
Demographic Characteristics of LIFE Participants Included in and Excluded From Present Analysis
| Included (n=1170) | Excluded (n=465) | |
|---|---|---|
| Female | 773 (66.1) | 325 (69.9) |
| Male | 397 (33.9) | 140 (30.1) |
| Age, y | 78.8±5.3 | 79.2±5.0 |
| White | 907 (77.5) | 332 (71.4) |
| Nonwhite | 263 (22.5)* | 133 (28.6)* |
| Income | ||
| $0 to $15 000 | 128 (12.2) | 52 (13.1) |
| $15 000 to $25 000 | 197 (18.8) | 85 (21.4) |
| $25 000 to $35 000 | 168 (16.1) | 54 (13.6) |
| $35 000 to $50 000 | 204 (19.5) | 84 (21.2) |
| $50 000 to $75 000 | 173 (16.5) | 60 (15.1) |
| >$75 000 | 177 (16.9) | 62 (15.6) |
| Living alone | 560 (47.9)* | 253 (53.9)* |
| Marital status | ||
| Divorced | 171 (14.6)* | 76 (16.6)* |
| Married | 447 (38.3) | 136 (29.7) |
| Other | 550 (47.0) | 246 (52.9) |
| CES‐D score | 8.45±7.8 | 8.91±7.8 |
| PSQI score | 5.9±3.8 | 6.0±3.7 |
| 3MS score | 91.9±5.2* | 90.7±5.8* |
| Self‐reported history of CV‐related conditions | ||
| Myocardial infarction | 90 (7.7) | 39 (8.2) |
| Congestive heart failure | 50 (4.3) | 21 (4.5) |
| Stroke | 88 (7.5)* | 21 (4.5)* |
| Lung disease | 191 (16.3) | 62 (13.4) |
| Diabetes | 294 (25.1) | 121 (26.1) |
Data reflect baseline characteristics of older adults (≥70 years) at risk for mobility disability participating in the Lifestyle Interventions and Independence for Elders (LIFE) Study. Data expressed as mean±SD or n (%). 3MS indicates Modified Mini‐Mental State Examination; CES‐D, Center for Epidemiologic Studies Depression Scale; CV, cardiovascular; PSQI, Pittsburgh Sleep Quality Index.
P<0.05 between groups.
Table 2.
Participant Cardiovascular Risk Factors and Activity Patterns by CVD History
| Prevalent CVD | Yes (n=354) | No (n=818) | Total |
|---|---|---|---|
| Body mass index, kg/m2 | 29.4±5.9 | 30.7±6.1 | 30.3±6.1 |
| Systolic blood pressure, mm Hg | 128.34±18.2 | 127.5±17.8 | 127.8±17.9 |
| Diastolic blood pressure, mm Hg | 67.1±10.2 | 68.9±10.2 | 68.3±10.2 |
| Fasting blood glucose, mg/dL | 106.7±28.5 | 102.7±20.9 | 103.9±23.5 |
| Total cholesterol, mg/dL | 172.7±42.9 | 180.1±37.8 | 177.9±39.6 |
| HDL cholesterol, mg/dL | 59.8±17.5 | 61.8±18.1 | 61.2±18.0 |
| Smoking status | |||
| Current | 19 (5.4) | 17 (2.1) | 36 (3.0) |
| Former | 176 (49.7) | 351 (42.9) | 526 (45.0) |
| Never | 159 (44.9) | 450 (55.0) | 608 (52.0) |
| Accelerometer wear time, min/day | 833.6±115.5 | 832.6±100.4 | 832.9±105.1 |
| Time spent <100 counts/min, min/day | 654.2±120.2 | 637.1±106.7 | 642.3±111.2 |
| Time spent 100 to 499 counts/min, min/day | 133.5±45.2 | 139.9±41.2 | 138.0±43.0 |
| Time spent >500 counts/min, min/day | 45.9±31.5 | 55.6±38.4 | 53.7±36.7 |
| Activity counts/min* | 395.7±101.6 | 425.7±126.7 | 416.7±120.4 |
Data reflect a cross‐sectional analysis of baseline characteristics of 1170 older adults (≥70 years) at risk for mobility disability participating in the Lifestyle Interventions and Independence for Elders (LIFE) Study. Data expressed as mean±SD or n (%). CVD indicates cardiovascular disease; HDL, high‐density lipoprotein.
For all activity >100 accelerometry counts/min.
Predicted 10‐year HCHD risk among study participants was 12.9±8.7%, with considerable heterogeneity in risk scores (Figure 1). Participants wore accelerometers for a mean of 8.1±3.2 valid wear days (ie, ≥10 h/day) and 832.8±105.1 min/day. For all wear time, participants registered 109.2±9.0 accelerometry counts/min. Participants spent 77.0±8.2% (642±111 min/day) of their wear time being sedentary (ie, <100 counts/min). The remaining non‐sedentary time was spent in activity registering 100 to 499 counts/min (16.6±5.0%, 137±43 min/day) with a smaller portion (6.4±4.4%, 53±37 min/day) spent performing activities registering ≥500 counts/min. Excluding time spent sedentary (190.4±8.2 min/day), the mean activity count was 416.6±120.3 counts/min.
Figure 1.
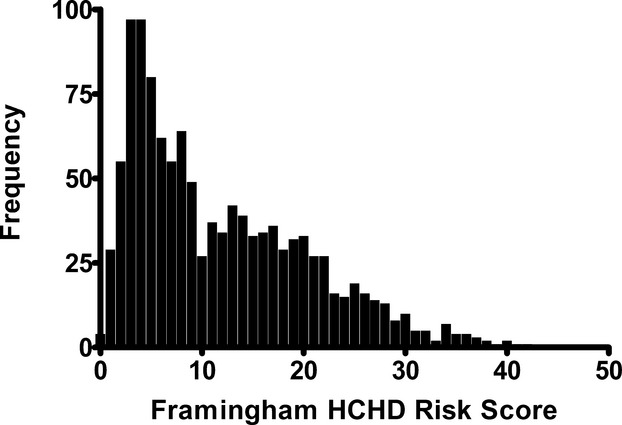
Distribution frequency of baseline 10‐year Framingham Hard Coronary Heart Disease (HCHD) risk scores among 1170 sedentary older adults (70 to 89 years) at risk of mobility disability enrolled in the Lifestyle Interventions and Independence for Elders (LIFE) study.
Across all activity categories, time (minutes per day) spent in activity was significantly associated with 10‐year HCHD risk score (Figure 2A through 2C). These associations remained significant after adjustment for those with and without CVD (Table 3). After adjustment, each minute spent being sedentary was associated with a 0.04% increase in 10‐year HCHD risk among participants with CVD and a 0.03% increase in 10‐year HCHD risk among participants without CVD. Each additional minute spent in activity registering 100 to 499 counts/min and activity registering ≥500 counts/min was associated with a significant decrease in 10‐year HCHD risk. Regardless of CVD status, the mean counts per minute were not significantly associated with HCHD risk (Table 3). However, in a post hoc analysis, a significant sex×activity counts interaction was observed (P=0.036) among those without CVD indicating that the mean counts/min of daily PA was related to HCHD risk in women (β=−0.94, 95% CI −1.48 to −0.41; P<0.001) but not in men (β=−0.14, 95% CI −0.59 to 0.88; P=0.704). This interaction was not significant among participants with a history of CVD. No differences were observed for any variable between whites and nonwhite populations.
Figure 2.
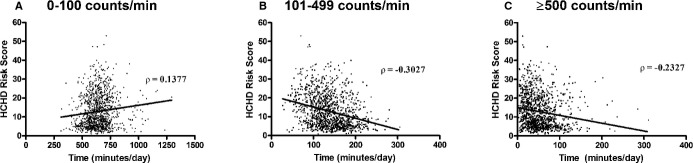
Bivariate association between objectively measured indices of habitual activity and predicted Hard Coronary Heart Disease (HCHD) risk measured at baseline among 1170 older adults at risk of mobility disability. Frames indicate association of calculated HCHD risk score with minutes of daily activity measured by triaxial accelerometry registering (A) 0 to 100 accelerometry counts/min, (B) 100 to 499 counts/min, and (C) >500 counts/min.
Table 3.
Association of Individual Accelerometry Measures With Estimated 10‐Year HCHD Risk Among Adults At Risk for Mobility Disability
| CVD Status | Model 1 | Model 2 | Model 3 | Model 4 |
|---|---|---|---|---|
| CVD | ||||
| Min/day <100 counts/min | 0.05 (0.03 to 0.06) | 0.05 (0.03 to 0.06) | 0.03 (0.02 to 0.05) | 0.04 (0.02 to 0.05) |
| Min/day 100 to 499 counts/min | −0.07 (−0.09 to −0.05) | −0.07 (−0.09 to −0.05) | −0.05 (−0.08 to −0.03) | −0.05 (−0.08 to −0.03) |
| Mins/day ≥500 counts/min | −0.07 (−0.10 to −0.04) | −0.07 (−0.09 to −0.05) | −0.06 (−0.09 to −0.03) | −0.06 (−0.09 to −0.03) |
| Activity counts/min* | −0.01 (−0.02 to 0.00) | −0.01 (−0.02 to 0.00) | −0.01 (−0.02 to 0.00) | −0.01 (−0.02 to 0.00) |
| No CVD | ||||
| Min/day <100 counts/min | 0.03 (0.02 to 0.04) | 0.03 (0.02 to 0.04) | 0.03 (0.02 to 0.03) | 0.03 (0.02 to 0.03) |
| Mins/day 100 to 499 counts/min | −0.06 (−0.07 to −0.04) | −0.06 (−0.07 to −0.04) | −0.05 (−0.06 to −0.03) | −0.05 (−0.06 to −0.03) |
| Mins/day ≥500 counts/min | −0.03 (−0.05 to −0.02) | −0.03 (−0.05 to −0.02) | −0.03 (−0.04 to −0.01) | −0.03 (−0.04 to −0.01) |
| Activity counts/min* | 0.00 (−0.00 to 0.00) | 0.00 (−0.00 to 0.01) | 0.00 (−0.00 to 0.01) | 0.00 (−0.00 to 0.01) |
Data reflect a cross‐sectional analysis of baseline characteristics of 1170 older adults (≥70 years) at risk for mobility disability participating in the Lifestyle Interventions and Independence for Elders (LIFE) Study. Values stratified by self‐reported CVD history and expressed as percent change in HCHD risk (95% CI) per unit change in the accelerometry measure. Model 1 is adjusted for accelerometer wear time; model 2 was adjusted for wear time and prevalent diabetes. Model 3 was adjusted for model 2, demographics not already included in the HCHD risk score, and the use of antihypertensive and lipid lowering medications. Model 4 was adjusted for model 3 and non‐CVD comorbidities (3MS, PSQI, and CES‐D). 3MS indicates Modified Mini‐Mental State Examination; CES‐D, Center for Epidemiologic Studies Depression Scale; CVD, cardiovascular disease; HCHD, hard coronary heart disease; PSQI, Pittsburgh Sleep Quality Index.
For all activity >100 accelerometry counts/min. All values rounded to 2 decimal places.
The association of accelerometry‐based variables with individual HCHD risk factors is shown in Table 4. Differences in HDL cholesterol, particularly for the lower levels of activity, appeared to be the primary driver of changes in HCHD risk, although a trend toward significance was observed for total cholesterol in association with sedentary behavior. Each minute spent being sedentary was associated with a 0.03 mg/dL lower (95% CI −0.06 to 0.00) HDL cholesterol level among participants with CVD and a 0.02 mg/dL lower (95% CI −0.04 to 0.00) HDL cholesterol level among participants without CVD. Blood pressure did not appear as significant in association with any of the evaluated accelerometry variables.
Table 4.
Difference in Modifiable HCHD Risk Factors Per Unit Change in Accelerometry
| CVD Status | Systolic BP (mm Hg) | Diastolic BP (mm Hg) | Total Cholesterol (mg/dL) | HDL Cholesterol (mg/dL) |
|---|---|---|---|---|
| CVD | ||||
| Minutes/day <100 counts/min | −0.01 (−0.05 to 0.02) | −0.01 (−0.02 to 0.01) | −0.01 (−0.08 to 0.00) | −0.03 (−0.06 to 0.00) |
| Minutes/day 100 to 499 counts/min | 0.02 (−0.02 to 0.07) | 0.01 (−0.00 to 0.02) | 0.04 (−0.07 to 0.14) | 0.05 (0.00 to 0.10) |
| Minutes/day ≥500 counts/min | 0.02 (−0.04 to 0.09) | 0.03 (−0.01 to 0.11) | −0.03 (−0.18 to 0.11) | 0.03 (−0.04 to 0.09) |
| Activity counts/min* | 0.00 (−0.02 to 0.02) | 0.01 (−0.00 to 0.02) | −0.02 (−0.07 to 0.03) | −0.00 (−0.02 to 0.02) |
| No CVD | ||||
| Min/day <100 counts/min | −0.01 (−0.03 to 0.01) | −0.02 (−0.01 to 0.01) | −0.04 (−0.08 to 0.00) | −0.02 (−0.04 to 0.00) |
| Min/day 100 to 499 counts/min | 0.01 (−0.02 to 0.05) | 0.00 (−0.02 to 0.02) | 0.06 (−0.00 to 0.13) | 0.04 (0.01 to 0.08) |
| Min/day ≥500 counts/min | 0.01 (−0.03 to 0.04) | 0.01 (−0.01 to 0.03) | 0.04 (−0.03 to 0.12) | 0.01 (−0.03 to 0.04) |
| Activity counts/min* | 0.00 (−0.01 to 0.04) | 0.00 (−0.00 to 0.01) | −0.00 (−0.03 to 0.02) | −0.01 (−0.02 to 0.01) |
Data reflect a cross‐sectional analysis of baseline characteristics of 1170 older adults (≥70 years) at risk for mobility disability participating in the Lifestyle Interventions and Independence for Elders (LIFE) Study. Values stratified by self‐reported CVD history and expressed as unit change in the risk factor per unit change in the accelerometry measure. Data are adjusted for accelerometer wear time, prevalent diabetes, relevant medication use (systolic and diastolic BP adjusted for antihypertensive use; total and HDL cholesterol adjusted for use of lipid‐lowering medications), demographics, and non‐CVD comorbidities not included in the HCHD risk score (3MS, PSQI, and CES‐D). 3MS indicates Modified Mini‐Mental State Examination; BP, blood pressure; CES‐D, Center for Epidemiologic Studies–Depression Scale; CVD, cardiovascular disease; HCHD, hard coronary heart disease; HDL, high‐density lipoprotein; PSQI, Pittsburgh Sleep Quality Index.
For all activity >100 accelerometry counts/min. All values rounded to 2 decimal places.
Discussion
Regular engagement in PA is an important factor in maintaining CV health. Indeed, regular moderate‐ to vigorous‐intensity PA has been widely demonstrated to show generally dose‐dependent protective effects against the development of CVD. As a result of these general benefits, several scientific and public health bodies have created minimum PA guidelines for improving CV health.3,21–22 Although these guidelines were created to apply to all adults, the gradations of CV risk among mobility‐limited older adults who are unable to meet these recommendations are unknown. Therefore, it is currently unclear exactly what level of daily PA is able to reduce CV risk in this largely sedentary population. The primary findings of the present study indicate that among sedentary older adults with mobility limitations, objectively measured time spent engaging in PA was associated with lower predicted HCHD risk. Conversely, increased time spent in sedentary behavior was associated with higher HCHD risk. These findings add to the growing body of knowledge to inform PA recommendations for older persons, including those with mobility limitations.
Most PA guidelines recommend “moderate‐intensity” PA on ≥3 days/wk. Prior analyses have used a threshold of 2020 accelerometry counts/min for moderate PA.2 Recently, Rejeski et al14 reported that even during supervised LIFE Study exercise sessions where individuals were challenged to engage in moderate‐ to vigorous‐intensity activity, older persons with mobility impairments exercised at levels well below the threshold of 2020 counts/min (eg, 1000 to 1300 counts/min). Notably, these accelerometry counts were significantly influenced by the frequent need to stop and rest during activity sessions. Accordingly, this threshold of 2020 counts/min may not be realistic for sedentary older adults with mobility limitations.23
Consideration of these cutpoints is important when interpreting the meaning of home‐based accelerometry data from sedentary, mobility‐limited older adults in the context of predicting CV risk. Participants in the present study spent <7% of their time in activities registering ≥500 counts/min, and the 99th percentile for all activity periods was represented by an activity count of only 845 counts/min. Thus, no one in this cohort participated in moderate‐intensity PA when defined using current cutpoint guidelines. Yet the findings here suggest that, among mobility‐limited older adults, CVD event risk may be mitigated by even lower‐intensity activities that counteract sedentary behavior. Our findings may also be directly applicable to a broader group of adults unable to engage in moderate PA by the traditional classifications.
The present findings indicate that relatively more time spent being sedentary is associated with higher CV risk among mobility‐limited older adults. Although this association has been reported previously in middle‐aged adults,24–27 we are the first to demonstrate that the association extends to predicting risk of major CV events in older adults—particularly among those with mobility limitations that limit their engagement in PA. The present data indicate that HCHD risk increases by 0.03% to 0.04% for each minute spent being sedentary. These values translate to a 1% increase in predicted HCHD risk for every 25 to 30 minutes of sedentary behavior per day. These data are extremely concerning as older adults in the United States spend ≈60% of their waking hours being sedentary28—a value that was even higher (77%) in the present cohort of seniors with mobility limitations. Accordingly, the development of methods to reduce the daily duration of “sedentariness” by mobility‐limited older adults, and consequently increase the duration of activity, may have tremendous public health implications.
Importantly, recent developments in the field have indicated that sedentary behavior is a more complex phenomenon than simply the absence of PA. As such, sedentary behavior is increasingly being conceived as a unique risk factor for a variety of health outcomes. Time spent in sedentary behavior has been associated with obesity,29 elevations in metabolic risk factors,30–31 as well as heart failure,32 all‐cause mortality and CV death.26 Most of these associations have been made using data of self‐reported sedentary behavior and moderate‐to vigorous‐intensity PA. However, Gennuso et al33 analyzed accelerometry‐based data to explore the interaction between sedentary behavior and moderate‐ to vigorous‐intensity PA in relation to cardiometabolic risk factors. They reported no interactions between sedentary behavior and PA and that a sufficient level of PA was not able to provide a protective effect against sedentary behavior, for cardiometabolic risk. Accordingly, it is important to note that, although the results of the present study indicate that findings for PA and sedentary behavior (based on chosen cutpoints) are consistent with one another, disparate findings have been noted in the literature. This can be attributed to the present study measuring the total volume of PA as opposed to the more limited volume of activity above the moderate to vigorous PA threshold.
The present data do not indicate that the relative intensity of activity categorized herein influenced HCHD risk score across both sexes. Although higher intensities of PA have been widely hypothesized to decrease CV risk, conclusive evidence of this hypothesis is lacking for many populations. Previously, Foulds et al reported an association between activity intensity and triglycerides, yet found no association between activity intensity and total cholesterol, LDL cholesterol, HDL cholesterol, small artery compliance, or larger artery compliance.34 Additionally, Mohr et al35 concluded that the positive effects on CV health were similar in moderate‐intensity and high‐intensity intervention groups among postmenopausal women. Moreover, high‐ and low‐intensity exercise interventions decreased CV risk similarly among obese adolescents.36 Thus, the present data regarding the relative intensity of low‐level activity are in line with several prior reports, although discrepancies do exist.37 It should be noted that the present findings may be limited by the narrow range of intensities performed by the present cohort. Moreover, these results may be applicable only to lower‐intensity activities and differential results may be observed with participation in regular, structured PA or exercise interventions.
Notably, the present findings indicate that the influence counts/min of low‐level activities may be sex specific as this variable was associated with reduced HCHD risk in women but not men without CVD. Although the underlying cause of this association is currently unclear, several potential explanations exist. For instance, this difference may be explained by factors related to the study design such as the smaller proportion of men or by the use of the sex‐specific HCHD equations. However, there may be a biologic mechanism that underlines this association that remains to be determined. It also remains to be seen why this interaction might manifest only among those without a prior history of CVD.
The present study had several strengths including a clinically relevant study population, multisite design, relatively large sample size, and use of an objective measurement of PA. Limitations include the inability to make causal inferences from the cross‐sectional data, and that these data only provide a projection of actual CV risk. Prospective studies are needed to examine the temporal relationship between PA, sedentary behavior, and incident CV risk in this high‐risk population. Additionally, the lack of established guidelines for classifying accelerometry measures in this population limits the ability to immediately translate these findings into public health recommendations.
In conclusion, the present study indicates that older, mobility‐limited men and women who spend less time being sedentary and more time engaging in PA have a lower predicted risk of experiencing an HCHD event (ie, myocardial infarction or coronary death). The relative intensity of these activities did not significantly influence HCHD risk scores, though the data do suggest that this association may differ based on sex and CVD history. There are several potential implications of the present findings. First, the CV risk of mobility‐limited older adults may be decreased by increasing the amount of time spent in PA of any intensity and reducing time spent in sedentary behavior. Put another way, replacing sedentary behavior with any intensity of PA seems beneficial for this population. For mobility‐limited older adults, this may be achieved simply by being intentional about moving around or leaving the home more often. Second, the observed difference in the association of activity intensity on CVD risk between sexes may have implications for the development of sex‐specific activity recommendations for this population.
Supplementary Material
Appendix Research Investigators for the LIFE Study.
Sources of Funding
The Lifestyle Interventions and Independence for Elders Study is funded by a National Institutes of Health (NIH)/National Institute on Aging Cooperative Agreement UO1 AG22376 and a supplement from the National Heart, Lung, and Blood Institute 3U01AG022376‐05A2S, and sponsored in part by the Intramural Research Program, National Institute on Aging, NIH. The research is also partially supported by the Claude D. Pepper Older Americans Independence Centers at the University of Florida (1 P30 AG028740), Tufts University (1P30AG031679), University of Pittsburgh (P30 AG024827), Wake Forest University (P30AG021332), Yale University (P30AG021342), and the NIH/NCRR CTSA at Stanford University (UL1 RR025744). Tufts University is also supported by the Boston Rehabilitation Outcomes Center (1R24HD065688‐01A1). LIFE investigators are also partially supported by the following: Dr Thomas Gill (Yale University) is the recipient of an Academic Leadership Award (K07AG3587) from the National Institute on Aging. Dr Carlos Fragoso (Spirometry Reading Center, Yale University) is the recipient of a Career Development Award from the Department of Veterans Affairs. Dr Roger Fielding (Tufts University) is partially supported by the US Department of Agriculture, under agreement No. 58‐1950‐0‐014. Any opinions, findings, conclusion, or recommendations expressed in this publication are those of the author(s) and do not necessarily reflect the view of the US Department of Agriculture.
Disclosures
None.
References
- Go AS, Mozaffarian D, Roger VL, Benjamin EJ, Berry JD, Blaha MJ, Dai S, Ford ES, Fox CS, Franco S, Fullerton HJ, Gillespie C, Hailpern SM, Heit JA, Howard VJ, Huffman MD, Judd SE, Kissela BM, Kittner SJ, Lackland DT, Lichtman JH, Lisabeth LD, Mackey RH, Magid DJ, Marcus GM, Marelli A, Matchar DB, McGuire DK, Mohler ER, III, Moy CS, Mussolino ME, Neumar RW, Nichol G, Pandey DK, Paynter NP, Reeves MJ, Sorlie PD, Stein J, Towfighi A, Turan TN, Virani SS, Wong ND, Woo D, Turner MBAmerican Heart Association Statistics Committee and Stroke Statistics Subcommittee. Heart disease and stroke statistics—2013 update: a report from the American Heart Association. Circulation. 2013; 127:e6-e245. [DOI] [PMC free article] [PubMed] [Google Scholar]
- Luke A, Dugas LR, Durazo‐Arvizu RA, Cao G, Cooper RS. Assessing physical activity and its relationship to cardiovascular risk factors: NHANES 2003–2006. BMC Public Health. 2011; 11:387. [DOI] [PMC free article] [PubMed] [Google Scholar]
- US Department of Health and Human Services. Physical Activity Guidelines Advisory Committee report, 2008. To the Secretary of Health and Human Services. Nutr Rev. 2009; 67:114-120. [DOI] [PubMed] [Google Scholar]
- Roger VL, Go AS, Lloyd‐Jones DM, Benjamin EJ, Berry JD, Borden WB, Bravata DM, Dai S, Ford ES, Fox CS, Fullerton HJ, Gillespie C, Hailpern SM, Heit JA, Howard VJ, Kissela BM, Kittner SJ, Lackland DT, Lichtman JH, Lisabeth LD, Makuc DM, Marcus GM, Marelli A, Matchar DB, Moy CS, Mozaffarian D, Mussolino ME, Nichol G, Paynter NP, Soliman EZ, Sorlie PD, Sotoodehnia N, Turan TN, Virani SS, Wong ND, Woo D, Turner MBAmerican Heart Association Statistics Committee and Stroke Statistics Subcommittee. Executive summary: Heart disease and stroke statistics—2012 update: a report from the American Heart Association. Circulation. 2012; 125:188-197. [DOI] [PubMed] [Google Scholar]
- Hodgson TA, Cohen AJ. Medical care expenditures for selected circulatory diseases: opportunities for reducing national health expenditures. Med Care. 1999; 37:994-1012. [DOI] [PubMed] [Google Scholar]
- Troiano RP, Berrigan D, Dodd KW, Masse LC, Tilert T, McDowell M. Physical activity in the United States measured by accelerometer. Med Sci Sports Exerc. 2008; 40:181-188. [DOI] [PubMed] [Google Scholar]
- Hu FB, Li TY, Colditz GA, Willett WC, Manson JE. Television watching and other sedentary behaviors in relation to risk of obesity and type 2 diabetes mellitus in women. JAMA. 2003; 289:1785-1791. [DOI] [PubMed] [Google Scholar]
- Healy GN, Matthews CE, Dunstan DW, Winkler EA, Owen N. Sedentary time and cardio‐metabolic biomarkers in US adults: NHANES 2003‐06. Eur Heart J. 2011; 32:590-597. [DOI] [PMC free article] [PubMed] [Google Scholar]
- Ekelund U, Luan J, Sherar LB, Esliger DW, Griew P, Cooper AInternational Children's Accelerometry Database (ICAD) Collaborators. Moderate to vigorous physical activity and sedentary time and cardiometabolic risk factors in children and adolescents. JAMA. 2012; 307:704-712. [DOI] [PMC free article] [PubMed] [Google Scholar]
- Maher C, Olds T, Mire E, Katzmarzyk PT. Reconsidering the sedentary behaviour paradigm. PLoS One. 2014; 9:e86403. [DOI] [PMC free article] [PubMed] [Google Scholar]
- Pahor M, Guralnik JM, Ambrosius WT, Blair S, Bonds DE, Church TS, Espeland MA, Fielding RA, Gill TM, Groessl EJ, King AC, Kritchevsky SB, Manini TM, McDermott MM, Miller ME, Newman AB, Rejeski WJ, Sink KM, Williamson JDLIFE study investigators. Effect of structured physical activity on prevention of major mobility disability in older adults: the LIFE study randomized clinical trial. JAMA. 2014; 311:2387-2396. [DOI] [PMC free article] [PubMed] [Google Scholar]
- Marsh AP, Lovato LC, Glynn NW, Kennedy K, Castro C, Domanchuk K, McDavitt E, Rodate R, Marsiske M, McGloin J, Groessl EJ, Pahor M, Guralnik JMLIFE Study Research Group. Lifestyle interventions and independence for elders study: recruitment and baseline characteristics. J Gerontol A Biol Sci Med Sci. 2013; 68:1549-1558. [DOI] [PMC free article] [PubMed] [Google Scholar]
- Fielding RA, Rejeski WJ, Blair S, Church T, Espeland MA, Gill TM, Guralnik JM, Hsu FC, Katula J, King AC, Kritchevsky SB, McDermott MM, Miller ME, Nayfield S, Newman AB, Williamson JD, Bonds D, Romashkan S, Hadley E, Pahor MLIFE Research Group. The lifestyle interventions and independence for elders study: design and methods. J Gerontol A Biol Sci Med Sci. 2011; 66:1226-1237. [DOI] [PMC free article] [PubMed] [Google Scholar]
- Rejeski WJ, Axtell R, Fielding R, Katula J, King AC, Manini TM, Marsh AP, Pahor M, Rego A, Tudor‐Locke C, Newman M, Walkup MP, Miller MELIFE Study Investigator Group. Promoting physical activity for elders with compromised function: the lifestyle interventions and independence for elders (LIFE) study physical activity intervention. Clin Interv Aging. 2013; 8:1119-1131. [DOI] [PMC free article] [PubMed] [Google Scholar]
- Teng EL, Chui HC. The modified mini‐mental state (3MS) examination. J Clin Psychiatry. 1987; 48:314-318. [PubMed] [Google Scholar]
- Buysse DJ, Reynolds CF, III, Monk TH, Hoch CC, Yeager AL, Kupfer DJ. Quantification of subjective sleep quality in healthy elderly men and women using the Pittsburgh Sleep Quality Index (PSQI). Sleep. 1991; 14:331-338. [PubMed] [Google Scholar]
- Radloff LS. The CES‐D scale: a self‐report depression scale for research in the general population. Appl Psychol Meas. 1977; 1:385-401. [Google Scholar]
- Choi L, Liu Z, Matthews CE, Buchowski MS. Validation of accelerometer wear and nonwear time classification algorithm. Med Sci Sports Exerc. 2011; 43:357-364. [DOI] [PMC free article] [PubMed] [Google Scholar]
- D’ Agostino RB, Grundy S, Sullivan LM, Wilson PCHD Risk Prediction Group. Validation of the Framingham coronary heart disease prediction scores: results of a multiple ethnic groups investigation. JAMA. 2001; 286:180-187. [DOI] [PubMed] [Google Scholar]
- Expert Panel on Detection Evaluation, and Treatment of High Blood Cholesterol in Adults. Executive summary of the third report of the National Cholesterol Education Program (NCEP) expert panel on detection, evaluation, and treatment of high blood cholesterol in adults (adult treatment panel III). JAMA. 2001; 285:2486-2497. [DOI] [PubMed] [Google Scholar]
- Anonymous. Exercise for health. WHO/FIMS Committee on Physical Activity for Health. Bull World Health Organ. 1995; 73:135-136. [PMC free article] [PubMed] [Google Scholar]
- Eckel RH, Jakicic JM, Ard JD, Hubbard VS, de Jesus JM, Lee IM, Lichtenstein AH, Loria CM, Millen BE, Miller NH, Nonas CA, Sacks FM, Smith SC, Jr, Svetkey LP, Wadden TW, Yanovski SZ. 2013 AHA/ACC guideline on lifestyle management to reduce cardiovascular risk: a report of the American College of Cardiology/American Heart Association task force on practice guidelines. Circulation. 2014; 129:S76-S99. [DOI] [PubMed] [Google Scholar]
- Tudor‐Locke C, Craig CL, Aoyagi Y, Bell RC, Croteau KA, De Bourdeaudhuij I, Ewald B, Gardner AW, Hatano Y, Lutes LD, Matsudo SM, Ramirez‐Marrero FA, Rogers LQ, Rowe DA, Schmidt MD, Tully MA, Blair SN. How many steps/day are enough? For older adults and special populations. Int J Behav Nutr Phys Act. 2011; 8:80. [DOI] [PMC free article] [PubMed] [Google Scholar]
- Wijndaele K, Brage S, Besson H, Khaw KT, Sharp SJ, Luben R, Wareham NJ, Ekelund U. Television viewing time independently predicts all‐cause and cardiovascular mortality: the EPIC norfolk study. Int J Epidemiol. 2011; 40:150-159. [DOI] [PubMed] [Google Scholar]
- Thorp AA, Healy GN, Owen N, Salmon J, Ball K, Shaw JE, Zimmet PZ, Dunstan DW. Deleterious associations of sitting time and television viewing time with cardiometabolic risk biomarkers: Australian Diabetes, Obesity and Lifestyle (AusDiab) study 2004–2005. Diabetes Care. 2010; 33:327-334. [DOI] [PMC free article] [PubMed] [Google Scholar]
- Katzmarzyk PT, Church TS, Craig CL, Bouchard C. Sitting time and mortality from all causes, cardiovascular disease, and cancer. Med Sci Sports Exerc. 2009; 41:998-1005. [DOI] [PubMed] [Google Scholar]
- Matthews CE, George SM, Moore SC, Bowles HR, Blair A, Park Y, Troiano RP, Hollenbeck A, Schatzkin A. Amount of time spent in sedentary behaviors and cause‐specific mortality in US adults. Am J Clin Nutr. 2012; 95:437-445. [DOI] [PMC free article] [PubMed] [Google Scholar]
- Matthews CE, Chen KY, Freedson PS, Buchowski MS, Beech BM, Pate RR, Troiano RP. Amount of time spent in sedentary behaviors in the United States, 2003‐2004. Am J Epidemiol. 2008; 167:875-881. [DOI] [PMC free article] [PubMed] [Google Scholar]
- Inoue S, Sugiyama T, Takamiya T, Oka K, Owen N, Shimomitsu T. Television viewing time is associated with overweight/obesity among older adults, independent of meeting physical activity and health guidelines. J Epidemiol. 2012; 22:50-56. [DOI] [PMC free article] [PubMed] [Google Scholar]
- Healy GN, Wijndaele K, Dunstan DW, Shaw JE, Salmon J, Zimmet PZ, Owen N. Objectively measured sedentary time, physical activity, and metabolic risk: the Australian Diabetes, Obesity and Lifestyle Study (AusDiab). Diabetes Care. 2008; 31:369-371. [DOI] [PubMed] [Google Scholar]
- Healy GN, Dunstan DW, Salmon J, Shaw JE, Zimmet PZ, Owen N. Television time and continuous metabolic risk in physically active adults. Med Sci Sports Exerc. 2008; 40:639-645. [DOI] [PubMed] [Google Scholar]
- Young DR, Reynolds K, Sidell M, Brar S, Ghai NR, Sternfeld B, Jacobsen SJ, Slezak JM, Caan B, Quinn VP. Effects of physical activity and sedentary time on the risk of heart failure. Circ Heart Fail. 2014; 7:21-27. [DOI] [PubMed] [Google Scholar]
- Gennuso KP, Gangnon RE, Mathews CE, Thraen‐Borowski KM, Colbert LH. Sedentary behavior, physical activity, and markers of health in older adults. Med Sci Sports Exerc. 2013; 45:1493-1500. [DOI] [PMC free article] [PubMed] [Google Scholar]
- Foulds HJ, Bredin SS, Charlesworth SA, Ivey AC, Warburton DE. Exercise volume and intensity: a dose‐response relationship with health benefits. Eur J Appl Physiol. 2014; 114:1563-1571. [DOI] [PubMed] [Google Scholar]
- Mohr M, Nordsborg NB, Lindenskov A, Steinholm H, Nielsen HP, Mortensen J, Weihe P, Krustrup P. High‐intensity intermittent swimming improves cardiovascular health status for women with mild hypertension. Biomed Res Int. 2014; 2014:728289. [DOI] [PMC free article] [PubMed] [Google Scholar]
- Gomes Silva HJ, Andersen LB, Lofrano‐Prado MC, Barros MVG, Freitas IF, Jr, Hill J, do Prado WL. Improvements on cardiovascular diseases risk factors in obese adolescents: a randomized exercise intervention study. J Phys Act Health. 2014 [DOI] [PubMed] [Google Scholar]
- Tanasescu M, Leitzmann MF, Rimm EB, Willett WC, Stampfer MJ, Hu FB. Exercise type and intensity in relation to coronary heart disease in men. JAMA. 2002; 288:1994-2000. [DOI] [PubMed] [Google Scholar]
Associated Data
This section collects any data citations, data availability statements, or supplementary materials included in this article.
Supplementary Materials
Appendix Research Investigators for the LIFE Study.