

Abstract
Background
Reactive oxygen species (ROS) are associated with development of coronary artery disease (CAD). However, there's no useful biomarker of ROS in CAD.
Methods and Results
We recruited 395 consecutive CAD patients who were performed coronary angiography (262 male and 133 female, age 70.2±10), and we measured serum derivatives of reactive oxidative metabolites (DROM) were measured. Two hundred twenty‐seven non‐CAD patients were also enrolled. We performed follow‐up study in these 395 CAD patients and case‐control study after risk factor and 1:1 pair matching (both, n=163). As subgroup analysis, DROM were also measured at the aortic root and the coronary sinus in 59 CAD patients. DROM were significantly higher in CAD patients (n=163, median [inter‐quartile range, IQR]=338 [302 to 386]) than in risk factor‐matched non‐CAD patients (n=163, 311 [282 to 352.5], effect size=0.33, P<0.001). During a mean follow‐up period of 20 months of 395 CAD patients, 83 cardiovascular events were recorded. Kaplan‐Meier analysis showed a higher probability of cardiovascular events in the high‐DROM group (>346 U.CARR) than in the low‐DROM group (≤346 U.CARR) (P=0.001 [log‐rank test]). Multivariate Cox hazard analysis identified ln‐DROM as an independent predictor for cardiovascular events (hazard ratio: 10.8, 95% confidence interval: 2.76 to 42.4, P=0.001). The transcardiac gradient of DROM was significantly higher in CAD patients than in non‐CAD patients (−2.0 [−9.0 to 9.0] versus 8 [−8.0 to 28.3], effect size=0.21, P=0.04), indicating that DROM production in coronary circulation is associated with development of CAD.
Conclusion
DROM are increased in CAD patients and associated with future cardiovascular events. DROM might provide clinical benefits for risk stratification of CAD.
Clinical Trial Registration
URL: http://www.umin.ac.jp/ctr/. Unique identifier: UMIN000012990.
Keywords: cardiovascular events, coronary artery disease, coronary circulation, follow‐up study, reactive oxygen species
Introduction
Coronary artery disease (CAD) is now the leading cause of death worldwide, and it is accelerated by the aging of the population, the prevalence of obesity, type 2 diabetes mellitus (DM), and metabolic syndrome.1 Cardiovascular events are the main cause of death in CAD patients. Therefore, risk stratification for future cardiovascular events in patients with CAD is clinically important.
Oxidative stress is caused by the presence of reactive oxygen species (ROS). Excessive ROS production represents endothelial and smooth muscle dysfunction, which leads to the progression of atherosclerosis.2–3 Increased ROS production is associated with various cardiovascular diseases and cardiovascular events.4–6 Kummerow et al reported that lipid hydroperoxides are correlated with the severity of stenosis in patients with CAD.7 Furthermore, Mary et al recently reported that lipid hydroperoxides predict cardiovascular events in patients with CAD.8 However, ROS, such as hydroperoxide, are not an established prognostic factor of cardiovascular events in patients with CAD because of the small amount of evidence. One of the reasons for this may be the difficulty of assessment of ROS in clinical practice because of their instability. However, a technique of direct evaluation of hydroperoxide has recently been developed. The derivatives of reactive oxygen metabolites (DROM) test can directly assay total oxidant capacity, which is mainly composed of hydroperoxide levels as a marker of ROS.9–10
In the present study, we tested the hypothesis that oxidative status as assessed by DROM is associated with the presence of CAD, and is a prognostic factor for future cardiovascular events in patients with CAD.
Methods
Study Subjects and Protocol
A total of 523 consecutive stable patients with suspected CAD who were referred and scheduled for hospitalization at Kumamoto University Hospital between January 2007 and August 2013 for coronary angiography (CAG) were registered. Based on the results of CAG, patients with atherosclerotic organic coronary artery stenosis (≥75%) were diagnosed as having CAD (diameter of stenosis in vessels ≥1.5 mm). We excluded 128 patients for the following reasons: heart failure (n=45), history of a coronary artery bypass graft (n=27), active infective disease (n=6), history of malignancy (n=15), and the end stage of renal disease (estimated glomerular filtration rate <15 mL/min per 1.73 m2, [n=35]). Finally, we enrolled 395 patients in this study. Serum DROM levels were measured for evaluation of reactive oxygen metabolites. We also measured serum DROM levels in patients without CAD who were hospitalized in Kumamoto University hospital because of suspected CAD and confirmed the absence of CAD by CAG and/or coronary computed tomography and did not meet exclusion criteria (n=227). DROM levels were further compared between patients with CAD and those with non‐CAD after matching risk factors, including the number of patients, age, sex, and equal incidence of hypertension, DM, and dyslipidemia. We made risk factor‐matched non‐CAD patients (n=163) and risk factor‐matched CAD patients (n=163) using nearest neighbor matching, no replacement, and 1‐to‐1 pair matching (Figure 1).
Figure 1.
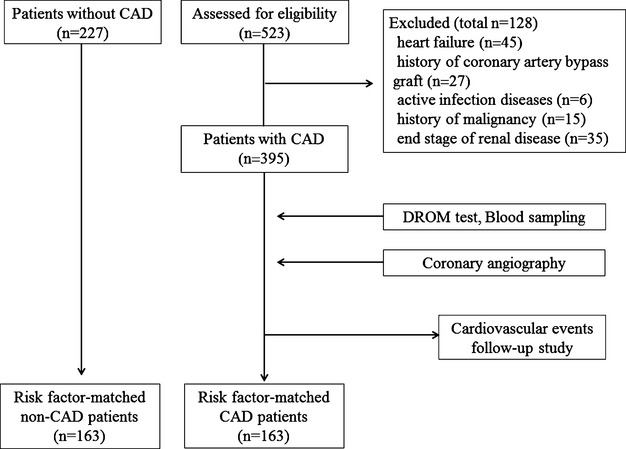
Flow chart showing the protocol used for this study. CAD indicates coronary artery disease; DROM, derivatives of reactive oxygen metabolites.
The study protocol conformed to the principles of the Declaration of Helsinki and the study has been approved by an institutional review committee at Kumamoto University Hospital. Written informed consent was obtained from all of the patients. This study is registered at the University Hospital Medical Information Network (UMIN) Clinical Trials Registry (UMIN000012990).
Definition of Coronary Risk Factors
We defined DM as symptoms of diabetes and a casual plasma glucose concentration ≥200 mg/dL, fasting plasma glucose concentration ≥126 mg/dL, 2‐hours plasma glucose concentration ≥200 mg/dL from a 75‐g oral glucose tolerance test, or taking medication for DM. Hypertension was defined as >140/90 mm Hg or taking antihypertensive medication. Current smoking was defined as smoking at the time of admission. Dyslipidemia was defined as high‐density lipoprotein cholesterol <40 mg/dL or low‐density lipoprotein cholesterol >140 mg/dL, triglycerides >150 mg/dL, or taking medication for dyslipidemia.
Measurement of Blood Parameters and DROM
We performed a blood test early in the morning in the fasting state before taking any medications. Blood tests were performed to measure levels of plasma B‐type natriuretic peptide (BNP), high‐sensitivity troponin T (hs‐troponin T), serum high‐sensitivity C‐reactive protein (hs‐CRP), and other biochemical markers. The blood samples were kept frozen −80°C until analysis.
The principle of the DROM test has been described previously.9–10 We measured hydroperoxide levels as serum DROM levels in patients with or without CAD in a stable condition using F.R.E.E. carpe diem (Diacron srl, Grosseto, Italy). The DROM test spectrophotometrically detects the oxidization of N,N‐diethyl‐para‐phenylenediamine as a chromogenic substrate by radicals converted from hydroperoxide. Measurements are expressed as an arbitrary unit called the Carratelli unit (U.CARR). The normal reference level of DROM was 250 to 300 U.CARR.9–10
We also measured DROM levels at the aortic root and the coronary sinus in 90 patients (non‐CAD patients; n=31, CAD; n=59) who received cardiac catheterization during the study period. Serum was isolated at room temperature, and after centrifugation it was kept frozen at −80°C. We also confirmed that DROM values can be measured by using frozen serum samples.
Severity and Complexity of CAD
After performing CAG, we classified CAD patients into single‐vessel disease (SVD) or multiple‐vessel disease (MVD) according to the number of diseased vessels for evaluating the severity of CAD.
We also classified CAD patients into simple plaques and complex plaques according to the Ambrose criteria for evaluating the complexity of CAD.11–12 Plaques with concentric type and eccentric type I were distributed into simple plaques, and eccentric type II and multiple irregularities were distributed into complex plaques.
Follow‐Up and Cardiovascular Events
Patients were followed up with until February 2014 or until the occurrence of cardiovascular events. We defined cardiovascular events as cardiovascular death, non‐fatal myocardial infarction, unstable angina pectoris, non‐fatal ischemic stroke, hospitalization for heart failure decompensation, or coronary revascularization. Cardiovascular death was defined as death due to myocardial infarction (within 28 days of onset), heart failure, or documented sudden death in the absence of non‐cardiovascular causes. Myocardial infarction was diagnosed by the rise or fall of cardiac biomarkers (plasma creatine kinase‐MB and cardiac troponin‐T) above the 99th percentile of the upper limit of the normal range with evidence of myocardial ischemia, as indicated by at least one of the following: electrocardiogram changes (new ST‐T changes, left bundle branch block, pathological Q‐wave) or imaging evidence of new loss of viable myocardium or new abnormalities of regional wall motion. Unstable angina pectoris was diagnosed by new or accelerating symptoms of myocardial ischemia accompanied by new ischemic ST‐T changes. Ischemic stroke was diagnosed by focal neurological deficits with radiological evidence of brain infraction excluding intracranial hemorrhage. Hospitalization for heart failure decompensation was diagnosed if the patient was admitted with symptoms typical of heart failure and had objective signs of worsening heart failure requiring intravenous drug administration. Coronary revascularization was diagnosed if the patient underwent percutaneous coronary intervention or coronary artery bypass grafting with evidence of myocardial ischemia, with the exception of expected at first coronary angiography. Cardiovascular events were ascertained from a review of medical records and confirmed by direct contact with the patients, their families, and physicians. We used the median value of DROM (346 U.CARR) to divide CAD patients into low‐ and high‐DROM groups.
Statistical Analyses
Non‐normally distributed data are expressed by the median (25% to 75%). Continuous variables with normal distribution are expressed as the mean±standard deviation. The Kolmogorov‐Smirnov test was used to assess normal distribution of continuous data. Categorical data were presented by frequencies and percentages. Differences between 2 groups were tested with Fisher's exact test for categorical variables. Differences between 2 groups in risk factor matching data were tested with McNemar test for categorical variables. Differences in continuous variables were analyzed by the unpaired t test, or Mann‐Whitney U test, as appropriate. Differences in continuous variables in risk factor matching data were analyzed by the paired t test, or Wilcoxon signed‐rank test, as appropriate. Because our study was an observational study, the reasons of drug usages were varied according to cause or effect of CAD. Hence, we omitted utilized drugs from the logistic regression analysis. Kaplan‐Meier analysis was performed by using the median value of DROM (346 U.CARR) in CAD patients and we compared cardiovascular event incidence with the log‐rank test. The Cox proportional hazard model was used to estimate the cardiovascular event hazard ratio and its 95% confidence interval in CAD patients by simple and multivariate analysis with direct inclusion models. Significant clinical parameters associated with cardiovascular events in crude Cox hazard analysis were entered into multivariate Cox hazard analysis. In consideration of the internal correlation of hs‐CRP with DROM, we made 3 direct inclusion models with/without hs‐CRP and DROM. Because DROM levels were not normally distributed, we calculated the natural logarithmic transformed DROM as ln‐DROM to use for regression analyses. A P value of <0.05 was considered statistically significant. Statistical analyses were performed using The Statistical Package for Social Sciences version 22 (IBM Japan, Ltd, Tokyo, Japan).
Results
Baseline Characteristics of 163 Risk Factor‐Matched CAD Patients and 163 Risk Factor‐Matched Non‐CAD Patients
To investigate whether DROM levels are increased only by the effect of CAD, we divided patients into the risk factor‐matched CAD group (n=163) and the risk factor‐matched non‐CAD group (n=163). DROM levels were significantly higher in risk factor‐matched CAD patients than in risk factor‐matched non‐CAD patients (338 [302.0 to 386.0] U.CARR versus 311.0 [282.0 to 352.5] U.CARR, effect size=0.33, P<0.001, Figure 2A). The proportions of patients with treatment with aspirin, clopidogrel, β‐blockers, and hydroxymethylglutaryl coenzyme A reductase inhibitors were significantly higher in risk factor‐matched CAD patients than in risk factor‐matched non‐CAD patients (all P<0.001, Table 1).
Figure 2.
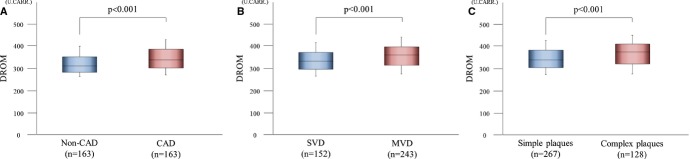
Serum DROM levels in CAD patients. A, Serum DROM levels in 163 CAD patients compared with 163 non‐CAD patients after risk matching for the number of patients, age, sex, and equal incidence of hypertension, DM, and dyslipidemia. B, Association between DROM levels with the severity of CAD. We classified CAD patients into SVD or MVD groups according to the number of diseased coronary vessels for evaluating the severity of CAD. Serum DROM levels were compared between 152 CAD patients with SVD and 243 CAD patients with MVD. C, Association between DROM levels with the complexity of CAD. We classified CAD patients into simple plaques or complex plaques groups according to the Ambrose criteria for evaluating the complexity of CAD. Plaques with concentric type and eccentric type I were distributed into simple plaques group, and eccentric type II and multiple irregularities were distributed into complex plaques group. Serum DROM levels were compared between 267 CAD patients with simple plaques and 128 CAD patients with complex plaques. The graphs show DROM using box‐and‐whisker plots. In these plots, lines within the boxes represent median values. The upper and lower lines of the boxes represent the 25th and 75th percentiles, respectively. The upper and lower bars outside the boxes represent the 90th and 10th percentiles, respectively. CAD indicates coronary artery disease; DM, diabetes mellitus; DROM, derivatives of reactive oxygen metabolites; MVD, multiple‐vessel disease; SVD, single‐vessel disease.
Table 1.
Baseline Characteristics of All CAD Patients, All Non‐CAD Patients, 163 Risk Factor‐Matched Non‐CAD Patients, and 163 Risk Factor‐Matched CAD Patients
| Full Data | Matched Data | ||||
|---|---|---|---|---|---|
| Non‐CAD (n=227) | CAD (n=395) | Non‐CAD (n=163) | CAD (n=163) | P Value* | |
| Age, y | 65.3 (13.0) | 70.2 (10.0) | 68.9 (10.2) | 69.0 (10.1) | 0.26 |
| Sex (male, %) | 64.8 | 66.3 | 69.3 | 69.3 | >0.99 |
| BMI, kg/m2 | 24.1 (3.9) | 24.2 (3.4) | 24.4 (3.7) | 24.2 (3.1) | 0.65 |
| Hypertension (yes, %) | 80.2 | 88.6 | 88.3 | 88.3 | >0.99 |
| DM (yes, %) | 27.3 | 50.6 | 31.9 | 31.9 | >0.99 |
| Dyslipidemia (yes, %) | 68.3 | 90.9 | 85.3 | 85.3 | >0.99 |
| Current smoking (yes, %) | 14.5 | 12.2 | 10.4 | 9.8 | >0.99 |
| Family history of CAD (yes, %) | 23.8 | 24.4 | 22.7 | 27.0 | 0.4 |
| LVEF, % | 61.7 (8.5) | 62.8 (6.3) | 61.9 (8.4) | 63.2 (6.1) | 0.12 |
| DROM, U.CARR | 312.0 (282.0 to 352.5) | 346.0 (306.0 to 391.5) | 311.0 (282.0 to 352.5) | 338.0 (302.0 to 386.0) | <0.001 |
| Hs‐CRP, mg/L | 0.6 (0.3 to 0.9) | 0.7 (0.3 to 1.4) | 0.6 (0.3 to 1.0) | 0.6 (0.3 to 1.1) | 0.59 |
| BNP, pg/mL | 32.6 (17.3 to 83.1) | 37.2 (17.2 to 73.0) | 33.6 (19.3 to 79.3) | 31.3 (12.0 to 64.3) | 0.17 |
| eGFR, mL/min per 1.73 m2 | 64.9 (17.5) | 63.9 (16.7) | 62.0 (16.7) | 64.0 (18.5) | 0.34 |
| Aspirin, % | 37.0 | 97.7 | 49.1 | 96.3 | <0.001 |
| Clopidogrel, % | 2.2 | 56.7 | 1.2 | 50.9 | <0.001 |
| β‐blockers, % | 43.2 | 74.9 | 47.2 | 72.4 | <0.001 |
| ACE‐I or ARB, % | 59.5 | 74.2 | 65.6 | 70.6 | 0.38 |
| CCB, % | 60.8 | 65.3 | 63.2 | 64.4 | 0.91 |
| HMG‐CoA‐I, % | 52.9 | 96.2 | 66.9 | 96.3 | <0.001 |
Data are mean (standard deviation), median (25th to 75th percentile range), or numbers (percentages). ACE‐I indicates angiotensin‐converting enzyme inhibitors; ARB, angiotensin II receptor blockers; BMI, body mass index; BNP, B‐type natriuretic peptide; CAD, coronary artery disease; CCB, calcium channel blockers; DM, diabetes mellitus; DROM, derivatives of reactive oxygen metabolites; eGFR, estimated glomerular filtration rate; HMG‐CoA‐I, hydroxy methylglutaryl coenzyme A reductase inhibitors; Hs‐CRP, high‐sensitivity C‐reactive protein; LVEF, left ventricular ejection fraction.
Compared between 163 risk factor‐matched non‐CAD patients and 163 risk factor‐matched CAD patients.
Baseline Characteristics and Logistic Regression Analysis for the Severity of 395 CAD Patients
Baseline characteristics of 395 CAD patients are shown in Table 2. CAD patients were classified into the low‐DROM (≤346 U.CARR, n=197) and high‐DROM (>346 U.CARR, n=198) groups using the median value of DROM. CAD patients with high‐DROM had a higher proportion of women, and higher hs‐CRP levels (both P<0.001) compared with those with low‐DROM (Table 2).
Table 2.
Baseline Characteristics of 395 CAD Patients
| Variables | All CAD Patients (n=395) | Low‐DROM Group (n=197) | High‐DROM Group (n=198) | P Value* |
|---|---|---|---|---|
| Age, y | 70.2 (10.0) | 69.3 (10.0) | 71.1 (9.8) | 0.07 |
| Sex (male, %) | 66.3 | 77.2 | 55.6 | <0.001 |
| BMI, kg/m2 | 24.2 (3.4) | 24.4 (3.1) | 24.0 (3.7) | 0.29 |
| Hypertension (yes, %) | 88.6 | 87.8 | 89.4 | 0.64 |
| DM (yes, %) | 50.6 | 50.8 | 50.5 | >0.99 |
| Dyslipidemia (yes, %) | 90.9 | 90.4 | 91.4 | 0.73 |
| Current smoking (yes, %) | 12.2 | 13.7 | 10.6 | 0.36 |
| Family history of CAD (yes, %) | 24.4 | 25.4 | 23.4 | 0.73 |
| LVEF, % | 62.8 (6.3) | 62.7 (6.1) | 62.9 (6.5) | 0.77 |
| DROM, U.CARR | 346.0 (306.0 to 391.5) | 306.0 (278.0 to 330.0) | 391.5 (370.3 to 423.0) | <0.001 |
| Hs‐CRP, mg/L | 0.7 (0.3 to 1.4) | 0.6 (0.3 to 1.0) | 0.8 (0.4 to 1.8) | <0.001 |
| BNP, pg/mL | 37.2 (17.2 to 73.0) | 29.6 (12.3 to 59.5) | 46.6 (24.5 to 86.3) | 0.10 |
| Hs‐troponin T, ng/mL | 0.008 (0.004 to 0.01) | 0.008 (0.003 to 0.01) | 0.009 (0.004 to 0.02) | 0.28 |
| eGFR, mL/min per 1.73 m2 | 63.9 (16.7) | 65.0 (16.7) | 62.8 (16.7) | 0.19 |
| Aspirin, % | 97.7 | 97.5 | 98.0 | 0.75 |
| Clopidogrel, % | 56.7 | 56.9 | 56.6 | 0.92 |
| β‐blockers, % | 74.9 | 73.1 | 76.8 | 0.42 |
| ACE‐I or ARB, % | 74.2 | 72.1 | 76.3 | 0.36 |
| CCB, % | 65.3 | 63.5 | 67.1 | 0.46 |
| HMG‐CoA‐I, % | 96.2 | 96.4 | 96.0 | >0.99 |
Data are mean (standard deviation), median (25th to 75th percentile range), or numbers (percentages). ACE‐I indicates angiotensin‐converting enzyme inhibitors; ARB, angiotensin II receptor blockers; BMI, body mass index; BNP, B‐type natriuretic peptide; CAD, coronary artery disease; CCB, calcium channel blockers; DM, diabetes mellitus; DROM, derivatives of reactive oxygen metabolites; eGFR, estimated glomerular filtration rate; HMG‐CoA‐I, hydroxy methylglutaryl coenzyme A reductase inhibitors; Hs‐CRP, high‐sensitivity C‐reactive protein; Hs‐troponin T, high‐sensitivity troponin T; LVEF, left ventricular ejection fraction.
Compared between the 197 patients with low‐DROM (≤346 U.CARR) and the 198 patients with high‐DROM (>346 U.CARR).
Furthermore, CAD patients were classified into CAD with SVD (n=152) or CAD with MVD (n=243). DROM levels were significantly higher in CAD patients with MVD than in those with SVD (360.0 [313.5 to 397.0] U.CARR versus 332.0 [296.0 to 371.8] U.CARR, effect size=0.17, P<0.001, Figure 2B). The prevalence of DM and dyslipidemia were significantly higher (both P=0.01), and the use of aspirin, clopidogrel, β‐blockers, and angiotensin‐converting enzyme inhibitors or angiotensin II receptor blockers were significantly higher in CAD patients with MVD than in those with SVD (P=0.03, 0.001, 0.003, 0.05, respectively). CAD patients with complex plaques were significantly more in MVD group than in SVD group (P<0.001, Table 3).
Table 3.
Baseline Characteristics and Logistic Regression Analysis for the Severity of 395 CAD Patients
| Variables | SVD (n=152) | MVD (n=243) | P Value* | Coding | Simple Regression | Multivariable Regression | |||
|---|---|---|---|---|---|---|---|---|---|
| OR | 95% CI | OR | 95% CI | P Value | |||||
| Age, y | 69.8 (9.9) | 70.5 (10.0) | 0.52 | Per 1 year | 1.01 | 0.99 to 1.03 | — | — | — |
| Sex (male, %) | 66.0 | 67.0 | 0.91 | Male (vs female) | 1.04 | 0.68 to 1.60 | — | — | — |
| BMI, kg/m2 | 24.3 (3.4) | 24.1 (3.5) | 0.53 | Per 1 kg/m2 | 0.98 | 0.92 to 1.04 | — | — | — |
| Hypertension (yes, %) | 86.2 | 90.1 | 0.26 | Yes (vs no) | 1.46 | 0.78 to 2.73 | — | — | — |
| DM (yes, %) | 42.1 | 56.0 | 0.01 | Yes (vs no) | 1.75 | 1.16 to 2.63 | 1.63 | 1.06 to 2.51 | 0.03 |
| Dyslipidemia (yes, %) | 86.2 | 93.8 | 0.01 | Yes (vs no) | 2.44 | 1.21 to 4.89 | 2.09 | 1.01 to 4.30 | 0.05 |
| Current smoking (yes, %) | 13.8 | 11.1 | 0.43 | Yes (vs no) | 0.78 | 0.42 to 1.44 | — | — | — |
| Family history of CAD (yes, %) | 27.0 | 22.7 | 0.34 | Yes (vs no) | 0.80 | 0.50 to 1.27 | — | — | — |
| LVEF, % | 62.7 (6.4) | 62.8 (6.3) | 0.88 | Per 1% | 1.00 | 0.97 to 1.02 | — | — | — |
| DROM, U.CARR | 332.0 (296.0 to 371.8) | 360.0 (313.5 to 397.0) | <0.001 | Per 1 ln‐DROM | 6.79 | 2.15 to 21.4 | 6.15 | 1.87 to 20.3 | 0.003 |
| Hs‐CRP, mg/L | 0.7 (0.3 to 1.1) | 0.7 (0.3 to 1.4) | 0.27 | Per 1 ln‐Hs‐CRP | 1.15 | 0.96 to 1.38 | — | — | — |
| BNP, pg/mL | 33.9 (16.4 to 63.2) | 41.3 (18.7 to 77.6) | 0.58 | Per 1 ln‐BNP | 1.06 | 0.93 to 1.20 | — | — | — |
| Hs‐troponin T, ng/mL | 0.008 (0.003 to 0.01) | 0.009 (0.004 to 0.01) | 0.28 | Per 1 ln‐Hs‐troponin T | 1.03 | 0.93 to 1.15 | — | — | — |
| eGFR, mL/min per 1.73 m2 | 65.1 (18.3) | 63.2 (15.7) | 0.28 | Per 1 mL/min per 1.73 m2 | 0.99 | 0.98 to 1.01 | — | — | — |
| Aspirin, % | 95.4 | 99.2 | 0.03 | — | — | — | — | — | — |
| Clopidogrel, % | 46.1 | 63.3 | 0.001 | — | — | — | — | — | — |
| β‐blockers, % | 66.4 | 80.2 | 0.003 | — | — | — | — | — | — |
| ACE‐I or ARB, % | 68.4 | 77.8 | 0.05 | — | — | — | — | — | — |
| CCB, % | 62.5 | 67.1 | 0.39 | — | — | — | — | — | — |
| HMG‐CoA‐I, % | 94.7 | 97.1 | 0.28 | — | — | — | — | — | — |
| Complex plaques (yes, %) | 20.4 | 39.9 | <0.001 | Complex (vs simple) | 2.59 | 1.62 to 4.15 | 2.11 | 1.30 to 3.44 | 0.003 |
| Hosmer–Lemeshow χ2 | 7.89 | ||||||||
| P value | 0.45 | ||||||||
Data are mean (standard deviation), median (25th to 75th percentile range), or numbers (percentages). We classified CAD patients into SVD or MVD group according to the number of diseased vessels for evaluating the severity of CAD. For regression analysis, not normally distributed variables were calculated the natural logarithmic transformed levels (ln‐DROM, ln‐hs‐CRP, ln‐BNP, ln‐hs‐troponin T). ACE‐I indicates angiotensin‐converting enzyme inhibitors; ARB, angiotensin II receptor blockers; BMI, body mass index; BNP, B‐type natriuretic peptide; CAD, coronary artery disease; CCB, calcium channel blockers; DM, diabetes mellitus; DROM, derivatives of reactive oxygen metabolites; eGFR, estimated glomerular filtration rate; HMG‐CoA‐I, hydroxy methylglutaryl coenzyme A reductase inhibitors; Hs‐CRP, high‐sensitivity C‐reactive protein; Hs‐troponin T, high‐sensitivity troponin T; LVEF, left ventricular ejection fraction; MVD, multiple‐vessel‐disease; SVD, single‐vessel‐disease.
Compared between patients with SVD and patients with MVD.
Simple logistic regression analysis showed that the prevalence of DM, dyslipidemia, ln‐DROM, and the existence of complex plaques were significantly correlated with the severity of CAD. Multivariate logistic regression analysis, including significant factors in simple regression, identified ln‐DROM as an independent and significant factor associated with the severity of CAD (odds ratio [OR]: 6.15, 95% confidence interval [CI]: 1.87 to 20.3, P=0.003, Table 3).
Baseline Characteristics and Logistic Regression Analysis for the Complexity of 395 CAD Patients
CAD patients were also classified into those with simple plaques (n=267) and complex plaques (n=128). DROM levels were significantly higher in CAD patients with complex plaques than in those with simple plaques (373.0 [318.8 to 408.3] U.CARR versus 337.0 [302.0 to 381.0] U.CARR, effect size=0.18, P<0.001, Figure 2C). The levels of hs‐CRP and the prevalence of DM and dyslipidemia were significantly higher (P=0.03, 0.01, 0.01, respectively), and the proportion of patients with a family history of CAD was significantly lower in CAD patients with complex plaques than in those with simple plaques (P=0.02). The use of clopidogrel was significantly higher in CAD patients with complex plaques than in those with simple plaques (P=0.05). CAD patients with MVD were significantly more in complex plaques group than in simple plaques group (P<0.001, Table 4).
Table 4.
Baseline Characteristics and Logistic Regression Analysis for the Complexity of 395 CAD Patients
| Variables | Simple Plaques (n=267) | Complex Plaques (n=128) | P Value* | Coding | Simple Regression | Multivariable Regression | |||
|---|---|---|---|---|---|---|---|---|---|
| OR | 95% CI | OR | 95% CI | P Value | |||||
| Age, y | 70.1 (9.9) | 70.3 (10.1) | 0.88 | Per 1 year | 1.00 | 0.98 to 1.02 | — | — | — |
| Sex (male, %) | 68.0 | 63.0 | 0.43 | Male (vs female) | 0.82 | 0.53 to 1.27 | — | — | — |
| BMI, kg/m2 | 24.0 (3.3) | 24.6 (3.7) | 0.14 | Per 1 kg/m2 | 1.05 | 0.99 to 1.11 | — | — | — |
| Hypertension (yes, %) | 89.1 | 87.5 | 0.62 | Yes (vs no) | 0.85 | 0.45 to 1.63 | — | — | — |
| DM (yes, %) | 46.1 | 60.1 | 0.01 | Yes (vs no) | 1.77 | 1.15 to 2.71 | 1.15 | 0.88 to 2.27 | 0.15 |
| Dyslipidemia (yes, %) | 88.3 | 96.1 | 0.01 | Yes (vs no) | 3.23 | 1.23 to 8.52 | 2.59 | 0.85 to 7.94 | 0.10 |
| Current smoking (yes, %) | 10.1 | 16.4 | 0.10 | Yes (vs no) | 1.75 | 0.94 to 3.22 | — | — | — |
| Family history of CAD (yes, %) | 27.8 | 17.2 | 0.02 | Yes (vs no) | 0.54 | 0.32 to 0.92 | 0.65 | 0.36 to 1.17 | 0.16 |
| LVEF, % | 63.0 (6.3) | 62.5 (6.4) | 0.47 | Per 1% | 0.99 | 0.96 to 1.02 | — | — | — |
| DROM, U.CARR | 337.0 (302.0 to 381.0) | 373.0 (318.8 to 408.3) | <0.001 | Per 1 ln‐DROM | 6.99 | 2.12 to 23.1 | 5.08 | 1.42 to 18.2 | 0.01 |
| Hs‐CRP, mg/L | 0.6 (0.3 to 1.2) | 0.8 (0.4 to 1.5) | 0.03 | Per 1 ln‐Hs‐CRP | 1.24 | 1.03 to 1.49 | — | — | — |
| BNP, pg/mL | 35.6 (15.0 to 67.2) | 45.2 (21.3 to 77.3) | 0.10 | Per 1 ln‐BNP | 1.16 | 1.00 to 1.35 | — | — | — |
| Hs‐troponin T, ng/mL | 0.007 (0.003 to 0.01) | 0.01 (0.006 to 0.02) | 0.92 | Per 1 ln‐Hs‐troponin T | 1.12 | 1.06 to 1.36 | 1.17 | 1.03 to 1.33 | 0.02 |
| eGFR, mL/min per 1.73 m2 | 64.7 (16.6) | 62.2 (16.9) | 0.16 | Per 1 mL/min per 1.73 m2 | 0.99 | 0.98 to 1.00 | — | — | — |
| Aspirin, % | 97.8 | 97.7 | >0.99 | — | — | — | — | — | — |
| Clopidogrel, % | 53.2 | 64.1 | 0.05 | — | — | — | — | — | — |
| β‐blockers, % | 73.4 | 78.1 | 0.32 | — | — | — | — | — | — |
| ACE‐I or ARB, % | 74.9 | 72.7 | 0.63 | — | — | — | — | — | — |
| CCB, % | 66.7 | 62.5 | 0.43 | — | — | — | — | — | — |
| HMG‐CoA‐I, % | 96.3 | 96.1 | >0.99 | — | — | — | — | — | — |
| MVD (yes, %) | 54.7 | 75.9 | <0.001 | MVD (vs SVD) | 2.59 | 1.62 to 4.15 | 2.03 | 1.22 to 3.40 | 0.007 |
| Hosmer–Lemeshow χ2 | 4.54 | ||||||||
| P value | 0.81 | ||||||||
Data are mean (standard deviation), median (25th to 75th percentile range), or numbers (percentages). We classified CAD patients into simple plaques or complex plaques group according to the Ambrose criteria for evaluating the complexity of CAD. Plaques with concentric type and eccentric type I were distributed into simple plaques, and eccentric type II and multiple irregularities were distributed into complex plaques. For regression analysis, not normally distributed variables were calculated the natural logarithmic transformed levels (ln‐DROM, ln‐hs‐CRP, ln‐BNP, ln‐hs‐troponin T). ACE‐I indicates angiotensin‐converting enzyme inhibitors; ARB, angiotensin II receptor blockers; BMI, body mass index; BNP, B‐type natriuretic peptide; CAD, coronary artery disease; CCB, calcium channel blockers; DM, diabetes mellitus; DROM, derivatives of reactive oxygen metabolites; eGFR, estimated glomerular filtration rate; HMG‐CoA‐I, hydroxy methylglutaryl coenzyme A reductase inhibitors; Hs‐CRP, high‐sensitivity C‐reactive protein; Hs‐troponin T, high‐sensitivity troponin T; LVEF, left ventricular ejection fraction; MVD, multiple‐vessel‐disease; SVD, single‐vessel‐disease.
Compared between patients with simple plaques and patients with complex plaques.
Furthermore, simple logistic regression analysis showed that the prevalence of DM and dyslipidemia, MVD and family history of CAD, ln‐DROM, ln‐hs‐CRP, ln‐hs‐Troponin T were significantly correlated with the complexity of CAD. In consideration of the internal correlation with ln‐DROM (correlation coefficient; r=0.34), ln‐hs‐CRP was excluded from multivariate logistic regression analysis. Multivariate logistic regression analysis, including significant factors in simple regression, except for ln‐hs‐CRP, identified ln‐DROM as an independent and significant factor associated with the complexity of CAD (OR: 5.08, 95% CI: 1.42 to 18.2, P=0.01, Table 4).
Association of DROM With Other Biomarkers and Echocardiographic Parameter
We also investigated the correlations between ln‐DROM and other biomarkers in patients with CAD. Ln‐DROM levels had a weak but significant positive correlation with levels of ln‐BNP (correlation coefficient; r=0.16, P=0.001, Figure 3A). Ln‐DROM levels also had a relatively strong and significant positive correlation with ln‐hs‐CRP (correlation coefficient; r=0.34, P<0.001, Figure 3B) in patients with CAD.
Figure 3.
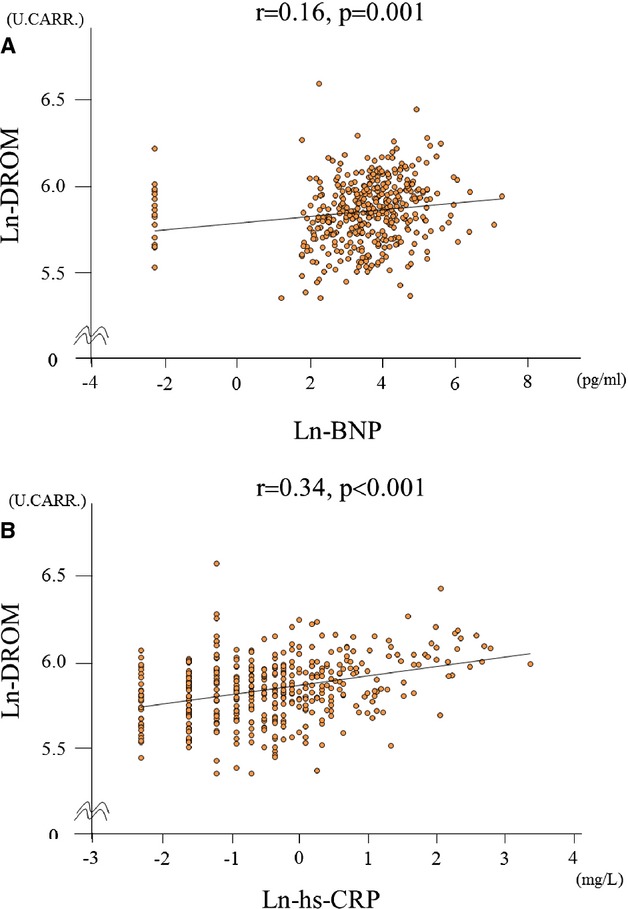
Correlation between ln‐DROM and other biomarkers. A, Correlation between ln‐DROM and ln‐BNP. B, Correlation between ln‐DROM and ln‐hs‐CRP. BNP indicates B‐type natriuretic peptide; DROM, derivatives of reactive oxygen metabolites; hs‐CRP, high‐sensitivity C‐reactive protein.
We also investigated the correlation of ln‐DROM levels with one other ROS biomarker; urinary 8‐hydroxy‐2′‐deoxyguanosine levels and found that there was no significant correlation (correlation coefficient; r=0.09, P=0.16). Furthermore, we demonstrated that there wasn't significant correlation between ln‐DROM and left ventricular ejection fraction on echocardiogram (correlation coefficient; r=−0.01, P=0.83).
Follow‐Up of Cardiovascular Events in 395 CAD Patients
The data from 393 CAD patients were available for the analysis of cardiovascular events. Two patients were lost to follow‐up. Eighty‐three cardiovascular events were recorded in CAD patients during a mean follow‐up of 20 months (range, 1 to 50 months). Details of cardiovascular events are shown in Table 5. Total cardiovascular events and coronary revascularization were significantly higher in the high‐DROM group than in the low‐DROM group. Receiver‐operating characteristics analysis showed that DROM correlated significantly with the occurrence of cardiovascular events (area under the curve: 0.64, 95% CI: 0.57 to 0.71, P<0.001, Figure 4). Kaplan‐Meier analysis showed that the high‐DROM group (n=197) had a higher probability of cardiovascular events than did the low‐DROM group (n=196) (cut‐off value of DROM=346 U.CARR; median value of 393 CAD patients; log‐rank test, P=0.001, Figure 5A). DROM levels were significantly higher in CAD patients with cardiovascular events than in those without cardiovascular events (374.0 [328.5 to 422.0] U.CARR versus 340.0 [301.3 to 384.8] U.CARR, P<0.001, Figure 5B). The sensitivity, specificity, positive predictive value, and negative predictive value of DROM (cut‐off value of DROM= 346 U.CARR) for the occurrence of cardiovascular events were 66.3%, 54.2%, 27.9%, and 78.9%, respectively.
Table 5.
Detailed Cardiovascular Events in 393 CAD Patients With Low‐ or High‐DROM Levels
| Low‐DROM Group (n=196) | High‐DROM Group (n=197) | P Value* | |
|---|---|---|---|
| Total cardiovascular events | 28 (14.3) | 55 (27.9) | 0.001 |
| Cardiovascular death | 2 (1.0) | 3 (1.5) | >0.99 |
| Non‐fatal myocardial infarction | 1 (0.5) | 2 (1.0) | >0.99 |
| Unstable angina pectoris | 7 (3.6) | 5 (2.5) | 0.58 |
| Non‐fatal ischemic stroke | 0 (0) | 4 (2.0) | — |
| Coronary revascularization | 14 (7.1) | 29 (14.7) | 0.02 |
| Hospitalization for heart failure decompensation | 4 (2) | 12 (6.1) | 0.07 |
Among 395 CAD patients, 393 CAD patients were available for the analysis of cardiovascular events (2 patients were lost to follow‐up). CAD indicates coronary artery disease; DROM, derivatives of reactive oxygen metabolites.
Compared between the 196 CAD patients with low‐DROM (≤346 U.CARR) and 197 CAD patients with high‐DROM (>346 U.CARR).
Figure 4.
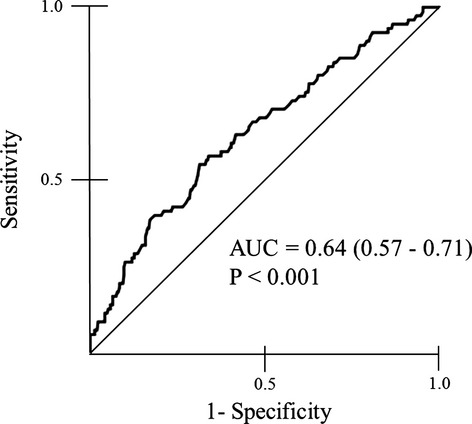
Receiver‐operating‐characteristic ana‐lysis. Significant positive correlation between DROM levels and the occurrence of cardiovascular events in CAD patients. AUC indicates area under the curve; CAD, coronary artery disease; DROM, derivatives of reactive oxygen metabolites.
Figure 5.
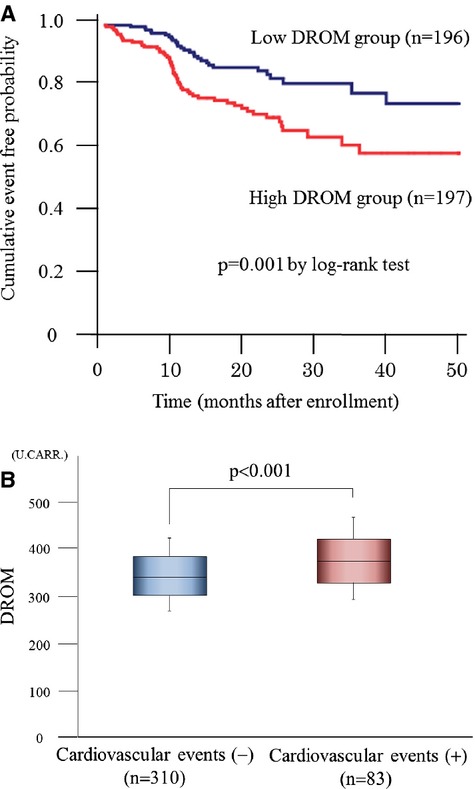
Follow‐up analysis in 393 CAD patients. A, Kaplan–Meier analysis for the probability of cardiovascular events in CAD patients with low‐ or high‐ln‐DROM (n=196, 197, respectively). CAD patients were divided into 2 groups using the median value of DROM (346 U.CARR). B, Serum ln‐DROM levels without or with cardiovascular events (n=310, 83, respectively). The graph shows DROM using box‐and‐whisker plots. In these plots, lines within the boxes represent median values. The upper and lower lines of the boxes represent the 25th and 75th percentiles, respectively. The upper and lower bars outside the boxes represent the 90th and 10th percentiles, respectively. CAD indicates coronary artery disease; DROM, derivatives of reactive oxygen metabolites.
Cox Proportional Hazard Analysis of Cardiovascular Events in 393 CAD Patients
Crude Cox hazard analysis identified 8 variables as significant predictors (age, sex, DM, ln‐DROM, ln‐hs‐CRP, ln‐BNP, coexisting complex plaques, and MVD, Table 6). In consideration of the internal correlation with ln‐DROM (correlation coefficient; r=0.34), we made 3 direct inclusion models; model 1: all significant factors in crude Cox proportional hazards analysis, model 2: significant factors in crude Cox proportional hazards analysis without ln‐hs‐CRP, model 3: significant factors in crude Cox proportional hazards analysis without ln‐DROM. In all these direct inclusion models, ln‐DROM still significantly predicted cardiovascular events (Table 7).
Table 6.
Crude Cox Proportional Hazards Analysis for Cardiovascular Events in 393 CAD Patients
| Variables | Coding | Simple Regression | ||
|---|---|---|---|---|
| HR | 95% CI | P Value | ||
| Age | Per 1 year | 1.03 | 1.00 to 1.05 | 0.03 |
| Sex | Male (vs female) | 0.59 | 0.38 to 0.91 | 0.02 |
| BMI | Per 1 kg/m2 | 0.98 | 0.92 to 1.04 | 0.50 |
| Hypertension | Yes (vs no) | 1.13 | 0.57 to 2.27 | 0.72 |
| DM | Yes (vs no) | 1.87 | 1.20 to 2.93 | 0.006 |
| Dyslipidemia | Yes (vs no) | 0.84 | 0.43 to 1.63 | 0.61 |
| Current smoking | Yes (vs no) | 0.83 | 0.40 to 1.72 | 0.62 |
| Family history of CAD | Yes (vs no) | 1.15 | 0.71 to 1.88 | 0.57 |
| LVEF | Per 1% | 1.00 | 0.97 to 1.04 | 0.99 |
| Ln‐DROM | Per 1 ln‐DROM | 13.3 | 4.25 to 41.8 | <0.001 |
| Ln‐Hs‐CRP | Per 1 ln‐Hs‐CRP | 1.26 | 1.05 to 1.51 | 0.01 |
| Ln‐BNP | Per 1 ln‐BNP | 1.43 | 1.18 to 1.74 | <0.001 |
| Ln‐hs‐troponin T | Per 1 ln‐Hs‐troponin T | 1.12 | 0.99 to 1.26 | 0.08 |
| eGFR | Per 1 mL/min per 1.73 m2 | 1.00 | 0.98 to 1.01 | 0.61 |
| Complex plaques | Complex (vs simple) | 2.34 | 1.51 to 3.60 | <0.001 |
| MVD | MVD (vs SVD) | 1.64 | 1.02 to 2.63 | 0.04 |
BMI indicates body mass index; BNP, B‐type natriuretic peptide; CAD, coronary artery disease; DM, diabetes mellitus; DROM, derivatives of reactive oxygen metabolites; eGFR, estimated glomerular filtration rate; HR, hazard ratio; Hs‐CRP, high‐sensitivity C‐reactive protein; Hs‐troponin T, high‐sensitivity troponin T; LVEF, left ventricular ejection fraction; MVD, multiple‐vessel‐disease; SVD, single‐vessel‐disease.
Table 7.
Multivariable Cox Proportional Hazards Analysis for Cardiovascular Events in 393 CAD Patients
| Variables | Coding | Model 1 | Model 2 | Model 3 | ||||||
|---|---|---|---|---|---|---|---|---|---|---|
| HR | 95% CI | P Value | HR | 95% CI | P Value | HR | 95% CI | P Value | ||
| Age | Per 1 year | 1.01 | 0.99 to 1.04 | 0.30 | 1.01 | 0.99 to 1.04 | 0.29 | 1.01 | 0.99 to 1.04 | 0.36 |
| Sex | Male (vs female) | 0.83 | 0.53 to 1.30 | 0.42 | 0.84 | 0.54 to 1.31 | 0.44 | 0.72 | 0.46 to 1.13 | 0.15 |
| BMI | Per 1 kg/m2 | — | — | — | — | — | — | — | — | — |
| Hypertension | Yes (vs no) | — | — | — | — | — | — | — | — | — |
| DM | Yes (vs no) | 1.81 | 1.12 to 2.90 | 0.01 | 1.84 | 1.15 to 2.92 | 0.01 | 1.58 | 1.00 to 2.52 | 0.05 |
| Dyslipidemia | Yes (vs no) | — | — | — | — | — | — | — | — | — |
| Current smoking | Yes (vs no) | — | — | — | — | — | — | — | — | — |
| Family history of CAD | Yes (vs no) | — | — | — | — | — | — | — | — | — |
| LVEF | Per 1% | — | — | — | — | — | — | — | — | — |
| Ln‐DROM | Per 1 ln‐DROM | 10.0 | 2.41 to 41.7 | 0.002 | 10.8 | 2.76 to 42.4 | 0.001 | — | — | — |
| Ln‐Hs‐CRP | Per 1 ln‐Hs‐CRP | 1.04 | 0.86 to 1.25 | 0.71 | — | — | — | 1.13 | 0.94 to 1.36 | 0.18 |
| Ln‐BNP | Per 1 ln‐BNP | 1.30 | 1.06 to 1.60 | 0.01 | 1.31 | 1.07 to 1.60 | 0.01 | 1.32 | 1.08 to 1.62 | 0.006 |
| Ln‐hs‐troponin T | Per 1 ln‐Hs‐troponin T | — | — | — | — | — | — | — | — | — |
| eGFR | Per 1 mL/min per 1.73 m2 | — | — | — | — | — | — | — | — | — |
| Complex plaques | Complex (vs simple) | 1.73 | 1.10 to 2.72 | 0.02 | 1.73 | 1.12 to 2.72 | 0.02 | 1.85 | 1.18 to 2.91 | 0.007 |
| MVD | MVD (vs SVD) | 1.08 | 0.65 to 1.77 | 0.77 | 1.08 | 0.66 to 1.77 | 0.77 | 1.26 | 0.77 to 2.05 | 0.35 |
Model 1: significant factors in crude Cox proportional hazards analysis. Model 2: significant factors in crude Cox proportional hazards analysis without ln‐hs‐CRP. Model 3: significant factors in crude Cox proportional hazards analysis without ln‐DROM. BMI indicates body mass index; BNP, B‐type natriuretic peptide; CAD, coronary artery disease; DM, diabetes mellitus; DROM, derivatives of reactive oxygen metabolites; eGFR, estimated glomerular filtration rate; HR, hazard ratio; Hs‐CRP, high‐sensitivity C‐reactive protein; Hs‐troponin T, high‐sensitivity troponin T; LVEF, left ventricular ejection fraction; MVD, multiple‐vessel‐disease; SVD, single‐vessel‐disease.
Production of DROM in the Coronary Circulation
In 31 non‐CAD patients and 59 CAD patients who received CAG, we examined DROM levels at the aortic root and the coronary sinus to examine the DROM production in the coronary circulation. DROM levels at the aortic root were not significantly different between non‐CAD patients and CAD patients (316.0 [266.0 to 355.5] U.CARR versus 318.0 [272.0 to 364.5] U.CARR, P=0.36, Figure 6A). By contrast, DROM levels at the coronary sinus in CAD patients were significantly higher compared with those in non‐CAD patients (309.0 [266.0 to 355.0] U.CARR versus 327.0 [293.0 to 376.5] U.CARR, P=0.05, Figure 6B). Accordingly, the transcardiac gradient of DROM (ΔDROM=DROM levels at the coronary sinus−DROM levels at the aortic root) in CAD patients was significantly higher than that in non‐CAD patients (−2.0 [−9.0 to 9.0] U.CARR versus 8 [−8.0 to 28.3] U.CARR, effect size=0.21, P=0.04, Figure 6C).
Figure 6.
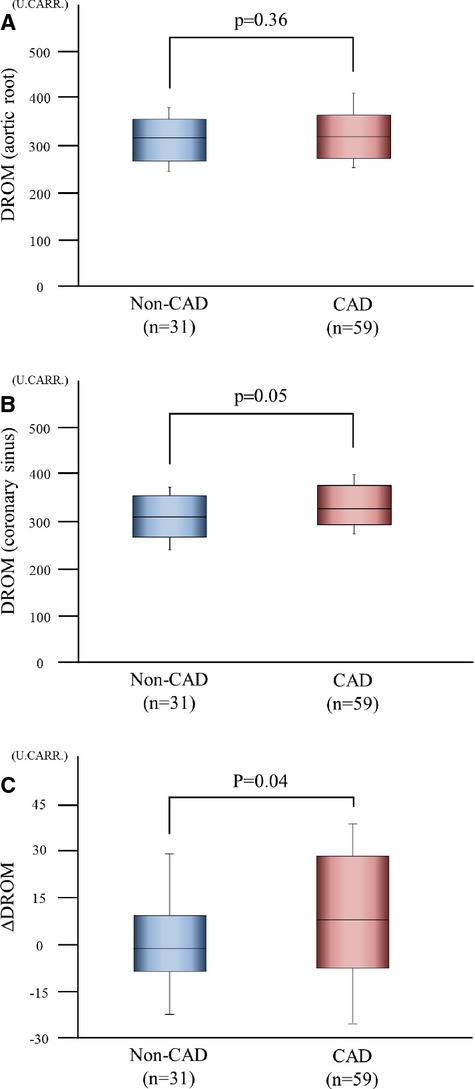
Production of DROM in the coronary circulation. DROM levels at the aortic root and the coronary sinus were measured in 31 non‐CAD patients and 59 CAD patients. A, Serum DROM levels at the aortic root in 31 non‐CAD patients and 59 CAD patients. B, Serum DROM levels at the coronary sinus in 31 non‐CAD patients and 59 CAD patients. C, Transcardiac gradients of DROM levels (ΔDROM=coronary sinus−aortic root) in 31 non‐CAD patients and 59 CAD patients. The graphs show DROM using box‐and‐whisker plots. In these plots, lines within the boxes represent median values. The upper and lower lines of the boxes represent the 25th and 75th percentiles, respectively. The upper and lower bars outside the boxes represent the 90th and 10th percentiles, respectively. CAD indicates coronary artery disease; DROM, derivatives of reactive oxygen metabolites.
Discussion
This study showed the following: (1) DROM were significantly higher in patients with CAD than in those with risk factor‐matched non‐CAD patients; (2) DROM levels were significantly higher in CAD patients with MVD than in those with SVD, and were also significantly higher in CAD patients with complex plaques than in those with simple plaques; (3) Kaplan‐Meier analysis showed that the probability of cardiovascular events was significantly higher in the high‐DROM group than in the low‐DROM group; (4) multivariate Cox hazard analysis identified ln‐DROM as a significant and independent predictor of cardiovascular events in CAD patients; and (5) DROM were produced in the coronary circulation in patients with CAD.
Using various types of hypertensive rats, the useful model of not only hypertension but also vascular injury including atherosclerosis, we previously reported that ROS are closely associated with the pathogenesis of atherosclerosis.13–15 Coronary atherosclerosis develops into obstructive CAD, and previous clinical studies actually have reported that ROS were involved in the occurrence and development of CAD.7–8 Furthermore, several clinical studies have investigated the role of ROS in cardiovascular diseases as a therapeutic target, although initial trials had limited success.16–18 However, direct measurement of ROS is difficult because of their biochemical instability, and few biomarkers of ROS have been adopted for clinical examination. The DROM test is a simple, novel, and relatively inexpensive, integrated analytical system used to measure ROS in a small quantity of serum or plasma.19–20 Based on our results, DROM, which reflect oxidative status, could be a useful biomarker for evaluating the presence of CAD. We also demonstrated that serum DROM levels were correlated with the severity and complexity of angiographically verified CAD. To the best of our knowledge, this is the first report to show a significant association of the DROM test with the presence and severity of CAD.
The presence of CAD has a critical risk of death, and patients with severe CAD have a poor prognosis.21 However, the relationships between biomarkers of ROS and the prognosis of patients with CAD remain unclear. In the present study, we further examined the prognostic importance of DROM in patients with CAD. We found that CAD patients with high DROM levels had a poor prognosis, and that DROM were significant and independent predictor of cardiovascular events in CAD patients. Coronary revascularization, such as percutaneous coronary intervention and coronary artery bypass grafts, was the main cause of cardiovascular events in the present study. This suggests that DROM are more predictive of coronary‐related events than of other vascular‐related events in patients with CAD. Furthermore, we proposed the cut‐off value as 346 U.CARR (median value in 395 patients with CAD) for DROM. The negative predictive value of DROM for the occurrence of cardiovascular events was 78.9% at 346 U.CARR, indicating that CAD patients who have DROM levels less than 346 U.CARR would avoid cardiovascular events with a probability of 78.9%. Thus, this is also the first report to show a significant association between serum DROM levels and adverse cardiovascular outcomes in patients with CAD.
Furthermore, the present study confirmed a strong positive correlation of serum DROM levels with hs‐CRP, a representative inflammatory marker and an established predictor of cardiovascular events in patients with CAD. These findings suggest that the coexistence of inflammation and oxidative stress has occurred and leads to higher cardiovascular risk in patients with CAD, as is the case in high‐risk patients for cardiovascular diseases.22 Previous reports demonstrated that inflammatory molecules such as CRP are present in heart and vasculature23 and increase intracellular ROS production in various cardiovascular diseases.24 In the vasculature, moreover, intracellular ROS induces inflammation,25 indicating a malignant cycle between CRP and oxidative stress. Further investigations are needed to examine whether the measurement of a combination of DROM and hs‐CRP can provide useful information for risk stratification of CAD patients in clinical practice.
As described above, ROS are well known to play a crucial role in the development of several cardiovascular diseases. In support of this fact, DROM levels have been reported to be increased in patients with hypertension,26 chronic kidney disease27 and periodontitis,28 all of which are atherosclerotic risk factors in humans. In the present study, we measured DROM levels at the aortic root and the coronary sinus to examine whether DROM is produced locally by the coronary artery or/and atherosclerotic lesions in patients with CAD. Interestingly, we found that DROM were produced in the coronary circulation in patients with CAD, but not in those with non‐CAD. Therefore, small but significant differences in DROM levels between the aortic root and the coronary sinus could contribute to the increased DROM levels in the peripheral circulation in patients with CAD. Excessive ROS production in the coronary circulation might be closely involved in the development of coronary atherosclerosis.
There are several limitations to our study. First, this study was a one‐center design with a relatively small patient population. However, even in this small population, serum DROM levels were closely related with the severity and complexity of CAD. Further large multicenter studies involving larger numbers of patients will be required to determine the importance of DROM in CAD. Second, this study was observational and was not interventional by antioxidative drugs. The benefits of antioxidative therapy for cardiovascular diseases still remain unclear. Therefore, additional interventional studies in CAD patients in a large‐scale population are necessary. Determining which drug treatment can reduce ROS as assessed by DROM measurement might be useful, as well as determining whether a reduction of DROM levels by any drug therapy contributes to the suppression of cardiovascular events in CAD patients. Third, our method for measuring oxidative stress reflects the overall oxidative status and excludes non‐hydroperoxide‐related ROS mediated biomarkers. We compared serum DROM levels with one other oxidative marker, urinary 8‐hydroxy‐2′‐deoxyguanosine levels, and found that they were not significantly correlated.
However, despite these limitations, our study provides the first evidence for the diagnostic and prognostic significance of DROM in CAD patients. The measurement of serum DROM levels might provide clinical benefits for risk stratification in patients with CAD. A large‐scale multicenter trial is warranted to further examine the pathological role and clinical significance of DROM in patients with CAD.
Acknowledgment
The authors are grateful to Ayuko Tateishi from the Department of Cardiovascular Medicine, Faculty of Life Sciences, Kumamoto University, for her skillful technical assistance and data collection.
Sources of Funding
This work was supported in part by Grants‐in Aid for Scientific Research (grant number: B24790770 to Yamamoto) from the Japanese Ministry of Education, Science, and Culture, SENSHIN Medical Research Foundation (to Yamamoto), and Japan Cardiovascular Research Foundation (to Ogawa).
Disclosures
Dr Ogawa received lecture fees and research grants from Astellas, AstraZeneca, Bayer, Boehringer Ingelheim, Chugai, Daiichi Sankyo, Dainippon Sumitomo Pharma, Eisai, Kowa, Kyowa Hakko Kirin, Mitsubishi Tanabe, MSD, Novartis, Otsuka, Pfizer, Sanofi, Sionogi, Takeda, and Mochida.
References
- Bonow RO, Smaha LA, Smith SC, Jr, Mensah GA, Lenfant C. World Heart Day 2002: the international burden of cardiovascular disease: responding to the emerging global epidemic. Circulation. 2002; 106:1602-1605. [DOI] [PubMed] [Google Scholar]
- Griendling KK, FitzGerald GA. Oxidative stress and cardiovascular injury: part I: basic mechanisms and in vivo monitoring of ROS. Circulation. 2003; 108:1912-1916. [DOI] [PubMed] [Google Scholar]
- Griendling KK, FitzGerald GA. Oxidative stress and cardiovascular injury: part II: animal and human studies. Circulation. 2003; 108:2034-2040. [DOI] [PubMed] [Google Scholar]
- Ashfaq S, Abramson JL, Jones DP, Rhodes SD, Weintraub WS, Hooper WC, Vaccarino V, Harrison DG, Quyyumi AA. The relationship between plasma levels of oxidized and reduced thiols and early atherosclerosis in healthy adults. J Am Coll Cardiol. 2006; 47:1005-1011. [DOI] [PubMed] [Google Scholar]
- Vichova T, Motovska Z. Oxidative stress: predictive marker for coronary artery disease. Exp Clin Cardiol. 2013; 18:e88-e91. [PMC free article] [PubMed] [Google Scholar]
- Mills BJ, Weiss MM, Lang CA, Liu MC, Ziegler C. Blood glutathione and cysteine changes in cardiovascular disease. J Lab Clin Med. 2000; 135:396-401. [DOI] [PubMed] [Google Scholar]
- Kummerow FA, Olinescu RM, Fleischer L, Handler B, Shinkareva SV. The relationship of oxidized lipids to coronary artery stenosis. Atherosclerosis. 2000; 149:181-190. [DOI] [PubMed] [Google Scholar]
- Walter MF, Jacob RF, Bjork RE, Jeffers B, Buch J, Mizuno Y, Mason RPPREVENT Investigators. Circulating lipid hydroperoxides predict cardiovascular events in patients with stable coronary artery disease: the PREVENT study. J Am Coll Cardiol. 2008; 51:1196-1202. [DOI] [PubMed] [Google Scholar]
- Cesarone MR, Belcaro G, Carratelli M, Cornelli U, De Sanctis MT, Incandela L, Barsotti A, Terranova R, Nicolaides A. A simple test to monitor oxidative stress. Int Angiol. 1999; 18:127-130. [PubMed] [Google Scholar]
- Iamele L, Fiocchi R, Vernocchi A. Evaluation of an automated spectrophotometric assay for reactive oxygen metabolites in serum. Clin Chem Lab Med. 2002; 40:673-676. [DOI] [PubMed] [Google Scholar]
- Ambrose JA, Winters SL, Stern A, Eng A, Teichholz LE, Gorlin R, Fuster V. Angiographic morphology and the pathogenesis of unstable angina pectoris. J Am Coll Cardiol. 1985; 5:609-616. [DOI] [PubMed] [Google Scholar]
- Ambrose JA, Israel DH. Angiography in unstable angina. Am J Cardiol. 1991; 68:78B-84B. [DOI] [PubMed] [Google Scholar]
- Yamamoto E, Yamashita T, Tanaka T, Kataoka K, Tokutomi Y, Lai ZF, Dong YF, Matsuba S, Ogawa H, Kim‐Mitsuyama S. Pravastatin enhances beneficial effects of olmesartan on vascular injury of salt‐sensitive hypertensive rats, via pleiotropic effects. Arterioscler Thromb Vasc Biol. 2007; 27:556-563. [DOI] [PubMed] [Google Scholar]
- Yamamoto E, Kataoka K, Shintaku H, Yamashita T, Tokutomi Y, Dong YF, Matsuba S, Ichijo H, Ogawa H, Kim‐Mitsuyama S. Novel mechanism and role of angiotensin II‐induced vascular endothelial injury in hypertensive diastolic heart failure. Arterioscler Thromb Vasc Biol. 2007; 27:2569-2575. [DOI] [PubMed] [Google Scholar]
- Yamamoto E, Tamamaki N, Nakamura T, Kataoka K, Tokutomi Y, Dong YF, Fukuda M, Matsuba S, Ogawa H, Kim‐Mitsuyama S. Excess salt causes cerebral neuronal apoptosis and inflammation in stroke‐prone hypertensive rats, through angiotensin II‐induced NADPH oxidase activation. Stroke. 2008; 39:3049-3056. [DOI] [PubMed] [Google Scholar]
- Salonen RM, Nyyssönen K, Kaikkonen J, Porkkala‐Sarataho E, Voutilainen S, Rissanen TH, Tuomainen TP, Valkonen VP, Ristonmaa U, Lakka HM, Vanharanta M, Salonen JT, Poulsen HEAntioxidant Supplementation in Atherosclerosis Prevention Study. Six‐year effect of combined vitamin C and E supplementation on atherosclerotic progression: the Antioxidant Supplementation in Atherosclerosis Prevention (ASAP) Study. Circulation. 2003; 107:947-953. [DOI] [PubMed] [Google Scholar]
- Dietary supplementation with n‐3 polyunsaturated fatty acids and vitamin E after myocardial infarction: results of the GISSI‐Prevenzione trial. Gruppo Italiano per lo Studio della Sopravvivenza nell'Infarto miocardico. Lancet. 1999; 354:447-455. [PubMed] [Google Scholar]
- Brown BG, Zhao XQ, Chait A, Fisher LD, Cheung MC, Morse JS, Dowdy AA, Marino EK, Bolson EL, Alaupovic P, Frohlich J, Albers JJ. Simvastatin and niacin, antioxidant vitamins, or the combination for the prevention of coronary disease. N Engl J Med. 2001; 345:1583-1592. [DOI] [PubMed] [Google Scholar]
- Shimano M, Shibata R, Inden Y, Yoshida N, Uchikawa T, Tsuji Y, Murohara T. Reactive oxidative metabolites are associated with atrial conduction disturbance in patients with atrial fibrillation. Heart Rhythm. 2009; 6:935-940. [DOI] [PubMed] [Google Scholar]
- Leufkens AM, van Duijnhoven FJ, Woudt SH, Siersema PD, Jenab M, Jansen EH, Pischon T, Tjønneland A, Olsen A, Overvad K, Boutron‐Ruault MC, Clavel‐Chapelon F, Morois S, Palli D, Pala V, Tumino R, Vineis P, Panico S, Kaaks R, Lukanova A, Boeing H, Aleksandrova K, Trichopoulou A, Trichopoulos D, Dilis V, Peeters PH, Skeie G, González CA, Argüelles M, Sánchez MJ, Dorronsoro M, Huerta JM, Ardanaz E, Hallmans G, Palmqvist R, Khaw KT, Wareham N, Allen NE, Crowe FL, Fedirko V, Norat T, Riboli E, Bueno‐de‐Mesquita HB. Biomarkers of oxidative stress and risk of developing colorectal cancer: a cohort‐nested case‐control study in the European Prospective Investigation Into Cancer and Nutrition. Am J Epidemiol. 2012; 175:653-663. [DOI] [PubMed] [Google Scholar]
- Emond M, Mock MB, Davis KB, Fisher LD, Holmes DR, Jr, Chaitman BR, Kaiser GC, Alderman E, Killip T., III Long‐term survival of medically treated patients in the Coronary Artery Surgery Study (CASS) Registry. Circulation. 1994; 90:2645-2657. [DOI] [PubMed] [Google Scholar]
- Kamezaki F, Yamashita K, Kubara T, Suzuki Y, Tanaka S, Rkouzuma R, Okazaki M, Tasaki H, Otuji Y. Derivatives of reactive oxygen metabolites correlates with high‐sensitivity C‐reactive protein. J Atheroscler Thromb. 2008; 15:206-212. [DOI] [PubMed] [Google Scholar]
- Yasojima K, Schwab C, McGeer EG, McGeer PL. Generation of C‐reactive protein and complement components in atherosclerotic plaques. Am J Pathol. 2001; 158:1039-1051. [DOI] [PMC free article] [PubMed] [Google Scholar]
- Kobayashi S, Inoue N, Ohashi Y, Terashima M, Matsui K, Mori T, Fujita H, Awano K, Kobayashi K, Azumi H, Ejiri J, Hirata K, Kawashima S, Hayashi Y, Yokozaki H, Itoh H, Yokoyama M. Interaction of oxidative stress and inflammatory response in coronary plaque instability: important role of C‐reactive protein. Arterioscler Thromb Vasc Biol. 2003; 23:1398-1404. [DOI] [PubMed] [Google Scholar]
- Higashi Y, Noma K, Yoshizumi M, Kihara Y. Endothelial function and oxidative stress in cardiovascular diseases. Circ J. 2009; 73:411-418. [DOI] [PubMed] [Google Scholar]
- Digiesi V, Oliviero C, Giannò V, Rossetti M, Fiorillo C, Oradei A, Lenuzza M, Nassi P. Reactive metabolites of oxygen, lipid peroxidation, total antioxidant capacity and vitamin E in essential arterial hypertension. Clin Ter. 1997; 148:515-519. [PubMed] [Google Scholar]
- Gerardi G, Usberti M, Martini G, Albertini A, Sugherini L, Pompella A, Di LD. Plasma total antioxidant capacity in hemodialyzed patients and its relationships to other biomarkers of oxidative stress and lipid peroxidation. Clin Chem Lab Med. 2002; 40:104-110. [DOI] [PubMed] [Google Scholar]
- D'Aiuto F, Nibali L, Parkar M, Patel K, Suvan J, Donos N. Oxidative stress, systemic inflammation, and severe periodontitis. J Dent Res. 2010; 89:1241-1246. [DOI] [PMC free article] [PubMed] [Google Scholar]