

Abstract
Background
The results of studies on the association between prehypertension (blood pressure 120 to 139/80 to 89 mm Hg) and coronary heart disease (CHD) remain controversial. Furthermore, it is unclear whether prehypertension affects the risk of CHD in Asian and Western populations differently. This meta‐analysis evaluated the risk of CHD associated with prehypertension and its different subgroups.
Methods and Results
The PubMed and Embase databases were searched for prospective cohort studies with data on prehypertension and the risk of CHD. Studies were included if they reported multivariate‐adjusted relative risks (RRs) with 95% CIs of CHD from prehypertension. A total of 591 664 participants from 17 prospective cohort studies were included. Prehypertension increased the risk of CHD (RR 1.43, 95% CI 1.26 to 1.63, P<0.001) compared with optimal blood pressure (<120/80 mm Hg). The risk of CHD was higher in Western than in Asian participants (Western: RR 1.70, 95% CI 1.49 to 1.94; Asian: RR 1.25, 95% CI 1.12 to 1.38; ratio of RRs 1.36, 95% CI 1.15 to 1.61). The population‐attributable risk indicated that 8.4% of CHD in Asian participants was attributed to prehypertension, whereas this proportion was 24.1% in Western participants.
Conclusions
Prehypertension, even at the low range, is associated with an increased risk of CHD. This risk is more pronounced in Western than in Asian populations. These results supported the heterogeneity of target‐organ damage caused by prehypertension and hypertension among different ethnicities and underscore the importance of prevention of CHD in Western patients with prehypertension.
Keywords: cardiovascular disease, coronary heart disease, prehypertension, risk
Introduction
Hypertension is a major cause of cardiovascular disease (CVD). The excess risk of CVD may extend to those with prehypertension (blood pressure [BP] 120–139/80–89 mm Hg).1 Our prior studies showed that prehypertension was associated with increased risks of composite CVD and stroke.2–3 The risks were increased if BP was low, as in low‐range prehypertension (120 to 129/80 to 84 mm Hg), and were further increased with high‐range prehypertension (130 to 139/85 to 89 mm Hg).2–3 The effects of abnormal BP on coronary and cerebral arteries are not identical, and the risk of coronary heart disease (CHD) associated with prehypertension is still controversial.4–6 Furthermore, the risks of damage to target organs through hypertension vary significantly among different ethnic groups. Stroke, for example, is more common in Asian patients with hypertension, whereas CHD is more prevalent in American and European patients (traditionally defined as Western) with hypertension.7 This difference may be influenced by the environment and by dietary and lifestyle habits7; however, it remains unclear whether prehypertension affects the risk of CHD for Asian and Western patients differently.
In view of the substantial implications for public health of ethnic differences in the association between prehypertension and CHD risk, we performed a systematic review and meta‐analysis of all available prospective data to examine the association between prehypertension and CHD and to estimate the relative effect of prehypertension on CHD risk in Western and Asian populations.
Methods
Search Strategy and Selection Criteria
The study was approved by the institutional review committees of the participating hospitals. Following the recommendations of the Meta‐analysis of Observational Studies in Epidemiology (MOOSE) group,8 we systematically searched PubMed and Embase for reports published between January 1, 1966, and June 30, 2014, using a combined text and MeSH heading search strategy with the following terms: prehypertension, prehypertensive, pre‐hypertension, pre‐hypertensive, blood pressure, arterial pressure, borderline hypertension, and cardiovascular disease, cardiovascular events, coronary artery disease, coronary heart disease, ischemic heart disease, myocardial ischemia, myocardial infarction, angina. We restricted the search to human studies. There were no restrictions on language or publication form. We also reviewed the reference lists of identified reports for other potentially relevant studies. The detailed search strategy for PubMed is presented in Table 1. The strategies for other databases were similar but were adapted as necessary.
Table 1.
Literature Search Strategy for PubMed
| 1 | (“Blood Pressure”[Mesh] OR “Arterial Pressure”[Mesh]) OR “Prehypertension”[Mesh] |
| 2 | (((((prehypertension[Text Word] OR pre‐hypertension[Text Word]) OR prehypertensive[Text Word]) OR pre‐hypertensive[Text Word]) OR “borderline hypertension”[Text Word]) OR “blood pressure”[Text Word]) OR “Arterial Pressure”[Text Word] |
| 3 | 1 OR 2 |
| 4 | (((((“Cardiovascular Diseases”[Mesh]) OR “Coronary Artery Disease”[Mesh]) OR “Myocardial Ischemia”[Mesh]) OR “Myocardial Infarction”[Mesh]) OR “Angina Pectoris”[Mesh] |
| 5 | (((((((cardiovascular disease[Text Word]) OR cardiovascular events[Text Word]) OR coronary artery disease[Text Word]) OR coronary heart disease[Text Word]) OR ischemic heart disease[Text Word]) OR myocardial ischemia[Text Word]) OR myocardial infarction[Text Word]) OR angina[Text Word] |
| 6 | 4 OR 5 |
| 7 | 3 AND 6 |
| 8 | (“Epidemiologic Studies”[Mesh]) OR ((((((((“epidemiologic study”[Text Word]) OR epidemiology[Text Word]) OR “cohort study”[Text Word]) OR “longitudinal study”[Text Word]) OR “follow up”[Text Word]) OR “followed up”[Text Word]) OR “observational study”[Text Word]) OR prospective) |
| 9 | 7 AND 8 |
| 10 | (“Cross‐Sectional Studies”[Mesh] OR “Cross‐Sectional”[Text Word] |
| 11 | 9 NOT 10 |
| 12 | ((((Clinical Trial[Publication Type]) OR Case Reports[Publication Type]) OR Comment[Publication Type]) OR Editorial[Publication Type]) OR Review[Publication Type] |
| 13 | 11 NOT 12 |
| 14 | animals[MeSH Terms] |
| 15 | humans[MeSH Terms] |
| 16 | 14 NOT 15 |
| 17 | 13 NOT 16 |
Prospective studies were included if they met the following criteria: (1) All participants were aged ≥18 years, (2) BP and other cardiovascular risk factors were assessed at baseline, (3) multivariate‐adjusted relative risks (RRs) or hazard ratios for the events (ie, CHD) associated with prehypertension versus the reference category (optimal BP of <120/80 mm Hg) were reported.
Studies were excluded (1) if the RRs were unadjusted or adjusted only for age and sex, (2) if enrollment depended on having specific pathologic disorders (eg, diabetes mellitus or other baseline chronic diseases), or (3) if data were derived from the same cohort or meta‐analysis of other cohort studies.
When duplicate publications from the same cohort were identified, only the most recent data were included for analysis.
Data Extraction and Quality Assessment
Two investigators (Y. H. and X. C.) independently used the search strategy to identify potentially relevant reports. Complete articles of potentially relevant reports were obtained and reviewed according to predefined criteria. Information on study and participant characteristics, follow‐up duration, and outcome assessment was abstracted and transferred to specially designed, pretested forms. When the primary outcome data were unpublished, we contacted the principal author for additional information.
The quality of each study was evaluated following the guidelines developed by the US Preventive Services Task Force and a modified checklist.9–10 This checklist assessed (1) prospective study design, (2) maintenance of comparable groups, (3) adequate adjustment of potential confounders (at least 5 of 6 factors: age, sex, diabetes mellitus, body mass index or other measure of overweight or obesity, cholesterol, and smoking), (4) documented rate of loss to follow‐up, (5) outcome assessed blind to baseline status, (6) clear definition of exposures (prehypertension) and outcomes (CHD), (7) temporality (BP measured at baseline, not at the time of outcome assessment), and (8) follow‐up of at least 2 years. Study quality was graded as good if the study met 7 or 8 criteria, as fair for 4 to 6 criteria, and as poor for <4 criteria.
Data Synthesis and Analysis
The primary outcome was the RR of CHD in participants with prehypertension. The secondary outcomes were the RRs of CHD in American and European participants (defined as Western) in comparison with Asian participants. Subgroup analyses of the primary outcome were conducted according to BP (low‐range versus high‐range prehypertension), specific end points (fatal versus fatal plus nonfatal CHD), sex (men versus women), participant age (average <55 versus ≥55 years), follow‐up duration (<10 versus ≥10 years), participant number (<10 000 versus ≥10 000), exclusion of participants with CVD at baseline (yes versus no), and study quality (good versus fair).
For each study, we extracted the multivariate‐adjusted risk ratios or hazard ratios (with 95% CIs) for participants with prehypertension versus those with optimal BP. After log transformation of study‐specific estimates, the inverse variance approach was used for analysis.2 The I2 statistic was used to estimate the percentage of variability across studies attributable to between‐study heterogeneity (25%, 50%, and 75%, representing low, moderate, and high heterogeneity, respectively).11 We detected between‐study heterogeneity for several outcomes; therefore, we generated pooled estimates across studies using random‐effects meta‐analysis. The Western/Asian ratio of RR (and its 95% CI) was calculated according to the method described previously.12
We assessed the presence of publication bias by inspecting funnel plots for each outcome in which the natural log of RR was plotted against its SE. In addition, we conducted sensitivity analyses in which the pooled RR was recalculated by omitting 1 study at a time. P values were 2‐tailed, and the statistical significance was set at 0.05. All analyses were performed with RevMan software (version 5.2 for Windows; Cochrane Collaboration).
We also determined the population‐attributable risk (PAR) for prehypertension on the basis of the pooled RR. PAR% expresses the proportion of disease in the study population that is attributable to the exposure (prehypertension) and that could be eliminated if the exposure were eliminated. The PAR% was calculated as PAR%=(Pe)(RR−1)/([Pe][RR−1]+1)×100, in which Pe is the proportion of the population exposed to the risk factor (prehypertension) and RR is multivariate adjusted.2
Results
Selected Studies and Characteristics
We determined 27 845 manuscripts at initial retrieval. After screening of the titles and abstracts, 81 were found to qualify for full review (Figure 1). Finally, we included 17 prospective cohort studies, with a total of 591 664 participants derived from the general population, for analysis.4–6,4–26
Figure 1.
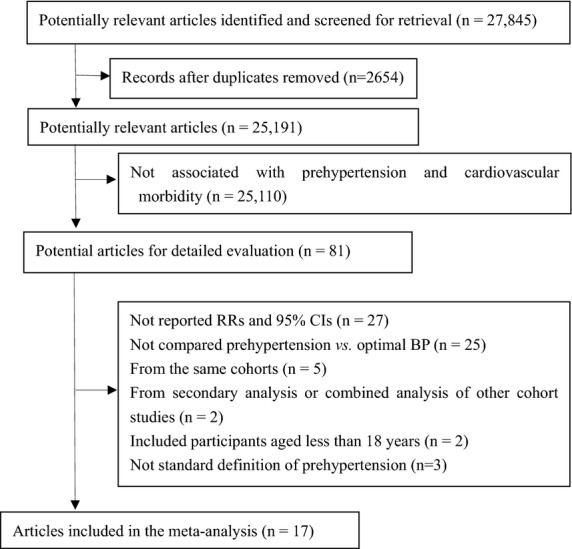
Flow of papers through review. BP indicates blood pressure; RRs, relative risks.
Table 2 summarizes the key features of the included studies. Of the 17 studies, 10 reported incidence of CHD,4–6,4–15,4–23,26 5 reported mortality from CHD,16,18–19,18–25 and 2 reported both CHD morbidity and mortality associated with prehypertension.17,20 Ten studies were from Asia,14–15,14–21,23,25–26 and 7 were from the United States and Europe.4–6,13,16,22,24 The proportion of Asian participants was 73.5%. The mean age at enrollment was 54.6 years, and the mean duration of follow‐up was 8.53 years. The mean prevalence of prehypertension was 38.8%. Three studies enrolled only women,13,19,23 whereas the others included both sexes, with the proportion of women amounting to 59.2%. Four studies did not exclude participants with CVD at baseline,16–19 and all others included participants without CVD.
Table 2.
Study Characteristics
| Study | Country | Prevalence of Prehypertension (%) | Sample Size (% Women) | Age (y), Average (Range or SD) | Follow‐up (y) | Participants With CVD at Baseline Excluded | Events for Analysis |
|---|---|---|---|---|---|---|---|
| Qureshi et al4 | United States | 41.1 | 5181 (55.3) | 44.0 (8.6) | 31 | Yes | CHD incidence |
| Lee et al5 | United States | 32.6 | 4372 (60.6) | 56.2(45 to 74) | 12 | Yes | CHD incidence |
| Kshirsagar et al6 | United States | 37.3 | 8960 (55) | 53(45 to 64) | 11.6 | Yes | CHD incidence |
| Hsia et al13 | United States | 39 | 60 785 (100) | 62.8 (7.0) | 7.7 | Yes | CHD incidence |
| Onat et al14 | Turk | 32.8 | 3034 (50.4) | 48 (12) | 6.6 | Yes | CHD incidence |
| Kokubo et al15 | Japan | 35 | 5494 (53) | 55 (30 to 79) | 11.7 | Yes | CHD incidence |
| Thomas et al16 | France | 54.2 | 69 989 (40.7) | 56.5 (>50) | 15.3 | No | CHD mortality |
| Gu et al17 | China | 34.5 | 158 666 (51) | 56 (≥40) | 7.7 | No | CHD incidence CHD mortality |
| Pednekar et al18 | India | 38.8 | 148 173 (40.2) | 50 (≥35) | 5.5 | No | CHD mortality |
| Dorjgochoo et al19 | China | 33.2 | 68 438 (100) | 55.1±9.1 | 5.1 | No | CHD mortality |
| Ikeda et al20 | Japan | 43 | 33 372 (65) | 54 (40 to 69) | 11.0 | Yes | CHD incidence CHD mortality |
| Fukuhara et al21 | Japan | 37.7 | 2634 (58) | 59.1 (≥40) | 19 | Yes | CHD incidence |
| Erbel et al22 | Germany | 26.2 | 4181 (53) | 59.3 (40 to 75) | 7.18 | Yes | CHD incidence |
| Sadeghi et al23 | Iran | 36 | 3255 (100) | 49.7 (≥35) | 6.7 | Yes | CHD incidence |
| Stojanov et al24 | Serbia | 40.8 | 265 (48.7) | 43.6 (30 to 60) | 36 | Yes | CHD mortality |
| Takashima et al25 | Japan | 41.2 | 8592(56.0) | 49.4 (30 to 92) | 21.3 | Yes | CHD mortality |
| Hadaegh et al26 | Iran | 34.5 | 6273(57) | 47.1 (≥30) | 9.3 | Yes | CHD incidence |
CHD indicates coronary heart disease; CVD, cardiovascular disease.
Three studies did not meet our criteria for adequate adjustment of potential confounders,14,18–19 and these were also graded as fair according to the predefined quality‐assessment criteria. All other studies were adequately adjusted and graded as good. The details of the quality assessment and adjustment for confounders are presented in Table 3. The baseline characteristics in prehypertension and optimal BP groups of the included studies are presented in Table 4.
Table 3.
Quality Assessment and Confounders Adjusted in the Included Studies
| Study | Risk Factors Adjusted | Study Quality |
|---|---|---|
| Qureshi3 | Age, sex, smoking, obesity, DM, hypercholesterolemia, and study period | Good |
| Lee4 | Age, sex, DM, smoking, LDL‐C, HDL‐C and albuminuria | Good |
| Kshirsagar5 | Age, race, sex, BMI, DM, smoking, LDL‐C, HDL‐C, education level, sport index, CHOL lowering medication, fibrinogen, vWF and WBC | Good |
| Hsia12 | Age, BMI, DM, CHOL, and smoking | Good |
| Onat13 | Age, sex, heart rate, smoking, obesity | Fair |
| Kokubo14 | Age, BMI, hyperlipidemia, DM, smoking and drinking status | Good |
| Thomas15 | Age, sex, CHOL, DM, physical activity, smoking, drinking, and antihypertensive drug | Good |
| Gu, 200916 | Age, sex, education level, smoking and drinking status, BMI, physical activity, antihypertensive medication, history of CVD or DM, geographic region and urbanization | Good |
| Pednekar17 | Age, education, religion, mother tongue, smoking, and BMI | Fair |
| Dorjgochoo18 | Age, education, waist/hip ratio, smoking, history of CVD and DM | Good |
| Ikeda19 | Age, sex, BMI, smoking and drinking status, antihypertensive medication, history of DM, CHOL, and public health center areas | Good |
| Fukuhara20 | Age, sex, BMI, CHOL, HDL‐C, DM, chronic kidney disease, electrocardiogram abnormalities, smoking, drinking, and regular exercise | Good |
| Erbel21 | Age, sex, cholesterol, DM, and smoking | Good |
| Aghababaei22 | Age, DM, CHOL, BMI, smoking and menopause | Good |
| Stojanov23 | Age, sex, BMI | Fair |
| Takashima24 | Age, sex, BMI, CHOL, hyperglycemia, smoking, and drinking habit | Good |
| Hadaegh25 | Age, sex, CHOL, BMI, smoking, DM, lipid‐lowering medication and family history of premature CVD | Good |
BMI indicates body mass index; CHOL, cholesterol level; CVD: cardiovascular disease; DM, diabetes mellitus; HDL‐C, high‐density lipoprotein cholesterol; LDL‐C, low‐density lipoprotein cholesterol; vWF, von Willebrand factor; WBC, white blood cell count.
Table 4.
Baseline Characteristics in Prehypertension and Optimal Blood Pressure Groups
| Study/BP Group (Participant Number) | Age (y) | SBP (mm Hg) | DBP (mm Hg) | BMI (kg/m2) | DM (%) | TC (mg/dL) | LDL‐C (mg/dL) | Smoking (%) |
|---|---|---|---|---|---|---|---|---|
| Qureshi et al4 | ||||||||
| Optimal BP (1012) | 39.6±7.4 | 112±6 | 72±5 | 24.0±3. | 1 | 205±41 | — | 61 |
| Pre‐HT (2017) | 42.9±8.2* | 128±6* | 80±5* | 25.7±3.6* | 1 | 217±43* | — | 61 |
| Kshirsagar et al6 | ||||||||
| Optimal BP (5622) | 53±6 | 106±8 | 67±7 | 26.0±4.2 | 5 | — | 134±38 | 28 |
| Low‐range pre‐HT (2059) | 54±6* | 123±4* | 75±7* | 27.5±5.0* | 7* | — | 137±38* | 25* |
| High‐range pre‐HT (1279) | 55±6** | 132±5** | 79±8* | 28.1±5.3** | 10** | — | 137±38* | 24* |
| Hsia et al13 | ||||||||
| Optimal BP (16002) | 60.7±6.7 | 109±7 | 69±6 | 26.9±5.2 | 1.8 | — | — | 10 |
| Pre‐HT (23596) | 62.6±6.8* | 130±11* | 78±7* | 28.9±5.8* | 3.0* | — | — | 7.4* |
| Kokubo et al15 | ||||||||
| Men | ||||||||
| Optimal BP (803) | 50.8±13.2* | 107.8±7.5* | 68.2±6.7* | 22.0±2.7 | 3.8 | 197±31 | — | 59.7 |
| Low‐range pre‐HT (502) | 54.0±12.9* | 121.7±5.4* | 76.6±6.3* | 22.7±2.6* | 5.3* | 201±35* | — | 49.6* |
| High‐range pre‐HT (463) | 57.5±12.2** | 131.4±5.8** | 81.2±6.9** | 23.2±2.7** | 5.6* | 205±35* | — | 46.3* |
| Women | ||||||||
| Optimal BP (1240) | 47.8±11.9 | 105.5±7.9 | 66.4±6.6 | 21.1±2.7 | 1.5 | 201±35 | — | 15.6 |
| Low‐range pre‐HT (504) | 54.0±11.5* | 122.4±4.8* | 75.5±7.1* | 22.5±3.0* | 3.3* | 218±39* | — | 11.7* |
| High‐range pre‐HT (465) | 58.9±11.5** | 132.4±4.9** | 79.7±6.9** | 22.8±3.2* | 4.0* | 221±35* | — | 9.2* |
| Thomas et al16 | ||||||||
| Optimal BP (2963) | 54.8±4.5 | 111±0.2 | 68±0.1 | 23.2±0.06 | 6.4 | 224±7 | — | 17.9 |
| Low‐range pre‐HT (32823) | 55.9±5.4* | 131±0.05* | 80±0.03* | 24.6±0.02* | 8.5* | 233±2* | — | 17 |
| High‐range pre‐HT (5103) | 55.6±5.1* | 132±0.1* | 83±0.08* | 24.8±0.05* | 8.4* | 233±6* | — | 16.1 |
| Gu et al17 | ||||||||
| Optimal BP (64043) | 52.6±9.5 | 106.8±8.2 | 67.8±6.7 | 21.6±3.2 | 1.0 | — | — | 37.0 |
| Pre‐HT (58569) | 55.7±10.6* | 126.1±7.2* | 78.0±7.0* | 22.8±3.5* | 1.9* | — | — | 40.1* |
| Ikeda et al20 | ||||||||
| Men | ||||||||
| Optimal BP (2058) | 51.9 | — | — | 22.3 | 5.1 | 186 | — | 52.1 |
| Low‐range pre‐HT (2456) | 53.1 | — | — | 23.3 | 5.2 | 194 | — | 45.9* |
| High‐range pre‐HT (2483) | 54.6 | — | — | 23.6 | 7.1* | 194 | — | 44.6* |
| Women | ||||||||
| Optimal BP (5536) | 50.9 | — | — | 22.7 | 2.0 | 201 | — | 4.5 |
| Low‐range pre‐HT (4867) | 52.9 | — | — | 23.5 | 2.2 | 205 | — | 2.9* |
| High‐range pre‐HT (4441) | 54.5 | — | — | 24.1 | 3.2* | 209 | — | 3.1* |
| Fukuhara et al21 | ||||||||
| Optimal BP (657) | 55.1±10.3 | 110.8±7.7 | 66.7±7.7 | 21.4±2.6 | 5.1 | 203±40 | — | 29.7 |
| Low‐range pre‐HT (545) | 56.4±11.7* | 123.5±7.0* | 73.7±7.0* | 22.6±2.3* | 12.6* | 205±45 | — | 24.4* |
| High‐range pre‐HT (447) | 58.8±10.6** | 133.8±8.5** | 78.6±8.5** | 23.4±2.1** | 14.7* | 212±33** | — | 25.2* |
| Erbel et al22 | ||||||||
| Men | ||||||||
| Optimal BP (200) | 55±7 | 111±6 | 71±5 | 26.3±3.7 | 5.0 | 221±36 | 144±34 | 33.5 |
| Pre‐HT (596) | 57±7* | 129±6* | 81±5* | 27.2±3.3 | 4.5 | 227±39 | 148±36 | 30.1 |
| Women | ||||||||
| Optimal BP (618) | 56±7 | 107±8 | 70±6 | 25.3±4.1 | 1.0 | 226±38 | 139±36 | 28.0 |
| Pre‐HT (500) | 59±8* | 127±7* | 79±6* | 27±4* | 3.4* | 236±41* | 148±38* | 22.0* |
| Sadeghi et al23 | ||||||||
| Optimal BP (1073) | 43.3±9.07 | — | — | 26.6±4.5 | 6 | — | — | 2 |
| Pre‐HT (1185) | 49.6±10.7* | — | — | 27.9±4.6* | 10* | — | — | 2 |
| Stojanov et al24 | ||||||||
| Optimal BP (24) | 40.46±5.12 | — | — | 26.49±2.50 | — | — | — | 54.2 |
| Pre‐HT (108) | 43.27±7.55 | — | — | 26.90±3.17 | — | — | — | 56.5 |
| Takashima et al25 | ||||||||
| Optimal BP (1622) | 43.4±10.9 | 109.6±6.4 | 67.6±6.6 | 21.7±2.8 | 3.5 | 181±32 | — | 26.7 |
| Pre‐HT (3538) | 46.7±11.9* | 126.7±6.6* | 77.4±6.9* | 22.4±3.0* | 5.3* | 186±32* | — | 34.1* |
| Hadaegh et al26 | ||||||||
| Middle aged (30 to 60 years) | ||||||||
| Optimal BP (2298) | 40.2±7.7 | 105.9±7.8 | 70.5±5.7 | 26.1±4.1 | 3.4 | 205±43 | — | 21.3 |
| Low‐range pre‐HT (1125) | 42.0±8.2* | 118.4±6.9* | 79.6±4.2* | 28.0±4.3* | 6.0* | 213±43* | — | 13.5* |
| High‐range pre‐HT (666) | 44.4±8.4** | 126.2±8.2** | 84.8±4.2** | 28.3±4.3* | 10.7** | 221±43** | — | 11.0* |
| Elderly (aged ≥60 years) | ||||||||
| Optimal BP (196) | 65.8±5.2 | 109.6±7.4 | 67.7±6.6 | 24.7±4.1 | 13.3 | 221±43 | — | 21.9 |
| Low‐range pre‐HT (195) | 65.6±4.5 | 122.3±4.8* | 75.8±6.7* | 26.6±3.9* | 13.8 | 224±46 | — | 8.7* |
| High‐range pre‐HT (181) | 66.5±5.1 | 132.4±5.6* | 78.5±7.4** | 27.0±3.6* | 18.2 | 221±43 | — | 11.0* |
The baseline characteristics in pre‐HT and optimal BP groups were not reported in the studies by Lee et al,5 Onat et al,14 Pednekar et al,18 and Dorjgochoo et al.19 BMI indicates body mass index; BP, blood pressure; DBP, diastolic blood pressure; DM, diabetes mellitus; LDL‐C, low‐density lipoprotein cholesterol; pre‐HT, prehypertension; SBP, systolic blood pressure; TC, total cholesterol.
vs optimal BP.
vs low‐range pre‐HT.
Association Between Prehypertension and Risk of CHD
Because there was substantial heterogeneity in all studies (I2=65%), a random‐effects model was used in the analysis. After multivariate adjustment, prehypertension was associated with increased risk of CHD (RR 1.43, 95% CI 1.26 to 1.63) compared with optimal BP (Figure 2). The risk of CHD was higher in Western than in Asian participants (Western: RR 1.70, 95% CI 1.49 to 1.94; Asian: RR 1.25, 95% CI 1.12 to 1.38; ratio of RRs 1.36, 95% CI 1.15 to 1.61).
Figure 2.

Forest plot of comparison: prehypertension vs optimal blood pressure. Outcome was coronary heart disease in Asian and Western participants.
There was no evidence of publication bias on visual inspection of the funnel plot (Figure 3). On the basis of the pooled RR, the PARs of CHD for prehypertension were 14.3% in the all‐studies population, 24.1% in the Western cohort, and 8.4% in the Asian cohort.
Figure 3.
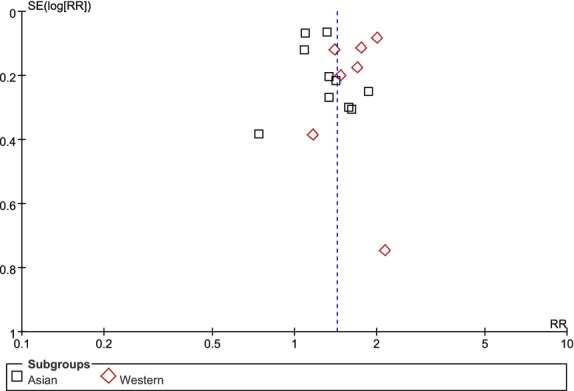
Funnel plot of comparison, prehypertension vs optimal blood pressure. Outcome was coronary heart disease in Asian and Western participants. RR indicates relative risks.
Subgroup Analyses
In the subgroup analyses, low‐range prehypertension increased the risk of CHD compared with optimal BP (RR 1.27, 95% CI 1.07 to 1.57), and the RR of CHD in high‐range prehypertension was 1.58 (95% CI 1.24 to 2.24); however, the difference between low‐range and high‐range prehypertension was not significant (ratio of RRs 1.24, 95% CI 0.92 to 1.67). Furthermore, the risk of CHD was higher in studies with a follow‐up duration ≥10 years (RR 1.68, 95% CI 1.50 to 1.90) than in those with <10 years of follow‐up (RR 1.27, 95% CI 1.10 to 1.48; ratio of RRs 1.32, 95% CI 1.09 to 1.60), in studies in which participants with CVD at baseline were excluded (RR 1.54, 95% CI 1.34 to 1.77) than in those in which such participants were not excluded (RR 1.21, 95% CI 1.03 to 1.43; ratio of RRs 1.27, 95% CI 1.03 to 1.58), and in studies with adequate adjustment of other risk factors (RR 1.48, 95% CI 1.30 to 1.49) than in those with inadequate adjustment (RR 1.13, 95% CI 0.99 to 1.28; ratio of RRs 1.31, 95% CI 1.13 to 1.51). There were no significant differences in the comparisons of other subgroups (Table 5).
Table 5.
Subgroup Analyses of the Association between Prehypertension and Cardiovascular Morbidity
| Subgroup | Risk Ratio (95% CI) | P Value Between Subgroups |
|---|---|---|
| Blood pressure range | ||
| Low‐range prehypertension | 1.27 (1.07 to 1.50) | 0.15 |
| High‐range prehypertension | 1.58 (1.24 to 2.02) | |
| Sex | ||
| Men | 1.67 (1.17 to 2.38) | 0.27 |
| Women | 1.30 (1.01 to 1.69) | |
| CHD end point | ||
| Fatal | 1.50 (1.31 to 1.72) | 0.23 |
| Nonfatal and fatal | 1.29 (1.06 to 1.58) | |
| Participant average age | ||
| <55 years | 1.44 (1.14 to 1.81) | 0.98 |
| ≥55 years | 1.44 (1.27 to 1.62) | |
| Follow‐up duration | ||
| <10 years | 1.27 (1.10 to 1.48) | 0.004 |
| ≥10 years | 1.68 (1.50 to 1.90) | |
| Participant number | ||
| <10 000 | 1.52 (1.29 to 1.79) | 0.26 |
| ≥10 000 | 1.32 (1.10 to 1.58) | |
| Participants with baseline CVD excluded | ||
| Yes | 1.54 (1.34 to 1.77) | 0.03 |
| No | 1.21 (1.03 to 1.43) | |
| Study quality | ||
| Good (score 7 to 8) | 1.48 (1.30 to 1.69) | 0.004 |
| Fair (score 4 to 6) | 1.13 (0.99 to 1.28) | |
CHD indicates coronary heart disease; CVD, cardiovascular disease.
Sensitivity Analyses
We used multiple methods to test sensitivity and found that the association of prehypertension and risk of CHD was not influenced by the use of fixed‐effect models compared with random‐effect models, odds ratios compared with RRs, or recalculation by omitting 1 study at a time.
Discussion
In this meta‐analysis comprising 591 664 participants, we found that after controlling for multiple cardiovascular risk factors, people with baseline prehypertension—even at low range—had an increased risk of CHD. The results were more significant in studies with a follow‐up duration >10 years, with adequate adjustment of other risk factors, and with exclusion of participants with CVD at baseline. More important, the risk of CHD associated with prehypertension was higher in Western than in Asian participants. The PAR calculation indicated that 8.4% of CHD cases could be prevented if prehypertension were eliminated in Asian patients, and this proportion increased to up to 24.1% in Western patients.
The term prehypertension has been controversial. An argument against this term is that the range of BP is too broad and that those with prehypertension at the high range (BP 130–139/85–89 mm Hg) and at the low range (BP 120 to 129/80 to 84 mm Hg) may have varying risks of developing CVD.27–28 In this study, we obtained robust data to show that persons with baseline prehypertension, even at the low range, were at increased risk of CHD. These results were supported by our prior studies, which showed that even low‐range prehypertension increased the risk of stroke2 and end‐stage renal disease29 compared with optimal BP. Unlike the present study, Shen et al reported in another recently published meta‐analysis that the association between low‐range prehypertension and CHD was not significant.30 The possible interpretation for these inconsistent findings may owe to the different inclusion criteria of the meta‐analyses. The analysis by Shen et al included some studies with teenaged participants (aged <18 years) and included data from meta‐analyses. In contrast, we included only prospective cohort studies with adults, with the RR of CHD reported in a multivariate‐adjusted model. This feature decreases the possibility of other known confounders influencing the association between prehypertension and CHD. To avoid duplicate inclusion, we excluded data derived from the same cohort or from meta‐analysis of other cohort studies. Furthermore, we used a wider search strategy, including the terms prehypertension, prehypertensive, borderline hypertension, blood pressure, and arterial pressure, to detect potential related studies. Our study finally included 17 studies, 3 of which were not included in the prior study.5,16,21 We believe that the wider search strategy is important to help capture potentially relevant studies. Meta‐analyses may be biased if they fail to identify all relevant studies.
In clinical trials of hypertension treatment, the ratio of stroke to myocardial infarction has been reported as 5 to 8:1 in Chinese patients and 1:1 in Western patients.7 In this study, we found that the PAR of prehypertension for CHD was 8.4% in Asians, a proportion approximately one third that of Westerners (24.1%). Our prior study also showed that the risk of CVD mortality in prehypertensive persons tended to be higher in black participants than in other ethnic groups.31 These differences may be affected by the environment and by dietary and lifestyle habits. These results further supported the heterogeneity of target‐organ damage caused by prehypertension and hypertension among different ethnicities and underscore the importance of prevention of CHD in Western patients with prehypertension.
Considering the incidence of prehypertension of 30% to 50%27 in addition to the robust and significant association between prehypertension and CHD, especially in Western participants, successful intervention in this large population could have a major impact on public health. Randomized trials examining the effects of antihypertensive therapy on the primary prevention of cardiovascular events specifically in those with prehypertension are rare, so professional societies do not currently recommend pharmacotherapy for prehypertension.32–34 In fact, the definitions of hypertension and prehypertension were not addressed in the 2014 report from the panel members appointed to the Eighth Joint National Committee (JNC‐8),34 but thresholds for pharmacological treatment were defined. It is recommended that in the general population, pharmacological treatment should be initiated to lower BP, with a target <140/90 mm Hg or <150/90 mm Hg in those aged <60 or ≥60 years, respectively.
For secondary prevention, data on whether antihypertensive therapy in prehypertensive patients with CHD could stem the progression of disease are also inconsistent. The substudy of the Comparison of Amlodipine Versus Enalapril to Limit Occurrences of Thrombosis (CAMELOT) trial showed that in CHD patients treated with amlodipine, enalapril, or placebo, those with hypertensive average BP had a significant increase in atheroma volume and those with prehypertensive BP had no major change, whereas those with optimal BP had a decrease in atheroma volume detected by repeated intravascular ultrasound over 2 years of follow‐up.35 In contrast, the recently published Aliskiren Quantitative Atherosclerosis Regression Intravascular Ultrasound Study (AQUARIUS) did not find the same results.36 In that study, 458 CHD participants with BP in the prehypertension range (systolic BP between 125 and 139 mm Hg) underwent intravascular ultrasound imaging and were randomized to receive aliskiren or placebo for 104 weeks. Disease progression was measured by repeated intravascular ultrasound examination after at least 72 weeks of treatment. Although the BP levels in the aliskiren group were 2.09/1.45 mm Hg lower than in the placebo group, there were no significant differences in regression of atheroma volume (P=0.08) in the aliskiren and placebo groups. It should be noted that the negative results may be confounded by the small sample size, the limited follow‐up duration, and the extensive use of multiple drugs for secondary prevention of CHD, such as statins and β‐blockers. Furthermore, patients enrolled in the AQUARIUS study showed a high prevalence of other cardiovascular risk factors (mean body mass index 30 kg/m2, 29.2% with diabetes, 83.9% with history of hypertension, 30.7% with history of smoking). Considering these inconsistent results, we agree that lifestyle modification is the mainstay of treatment for prehypertension in the general population. In our study, however, we also found that the risk of CHD with prehypertension was higher in Western participants and in studies with a follow‐up duration ≥10 years. Consequently, controlled trials with large samples and long follow‐up duration are required to determine the lower BP target in patients with CHD, especially in high‐risk subpopulations and different ethnicities.
It is interesting that in comparison to an optimal BP group, prehypertension increased the risk of CHD in the studies that excluded participants with CVD at baseline (RR 1.54, 95% CI 1.34 to 1.77) and in those studies that did not exclude participants with CVD at baseline (RR 1.21, 95% CI 1.03 to 1.43). These results highlight the importance of primary intervention for prehypertension and secondary prevention for CHD. Furthermore, the RR of CHD with prehypertension was much more pronounced in studies that excluded CVD at baseline than in those that did not (P=0.03). This may be because in those studies that did not exclude participants with CVD at baseline, the comparable group (optimal BP group) may also have included participants with CVD, which was associated with a higher risk of CHD events. This feature may have had a diluting effect when the RR of CHD was calculated.
The main strengths of our study are the very large sample size and the consistency of results in subgroup analyses and sensitivity analyses. Furthermore, the included studies were restricted to prospective cohort studies and reported multivariate‐adjusted RRs. Alternatively, some limitations of this meta‐analysis should be considered. First, the determination of BP in most of the studies was based on single‐day measurements, although multiple readings were taken. This approach may misclassify BP levels and lead to dilution bias. Second, we did not have access to patient‐level data; however, most of the studies were adequately adjusted for potential confounders and were of high quality, reducing the likelihood that other cardiovascular risk factors influenced the association between prehypertension and CHD. Third, persons with prehypertension are more likely to progress to hypertension than those with optimal BP, but most of the included studies did not adjust the BP clarification and management afterward.
Conclusions
After adjusting for multiple cardiovascular risk factors, prehypertension—even at the low range—is associated with a high risk of CHD. This risk is more pronounced in Western than in Asian patients. These results supported the heterogeneity of target‐organ damage caused by prehypertension and hypertension among different ethnicities and underscore the importance of prevention of CHD in Western patients with prehypertension. Future clinical trials are needed to determine whether interventions for prehypertension have different effects on risk of CHD in different ethnicities.
Author Contributions
Huang, Peng, and Xu conceived and designed the review. Huang and Cai identified and acquired reports of trials, abstracted data and assessed risk of bias. Huang, Cai, Hua, and Zhu drafted the manuscript. Xu and Peng provided supervision. Liu and Huang conducted the statistical analyses and contacted authors of included studies to obtain additional information. All of the authors contributed to the interpretation of data and all of the authors critically revised the manuscript. All of the authors approved the final version of the manuscript submitted for publication and are guarantors for the study.
Sources of Funding
This research received no specific grant from any funding agency in the public, commercial or not‐for‐profit sectors.
Disclosures
None.
References
- Chobanian AV, Bakris GL, Black HR, Cushman WC, Green LA, Izzo JJ, Jones DW, Materson BJ, Oparil S, Wright JJ, Roccella EJ. The Seventh Report of the Joint National Committee on Prevention, Detection, Evaluation, and Treatment of High Blood Pressure: the JNC 7 report. JAMA. 2003; 289:2560-2572. [DOI] [PubMed] [Google Scholar]
- Huang Y, Cai X, Li Y, Su L, Mai W, Wang S, Hu Y, Wu Y, Xu D. Prehypertension and the risk of stroke: a meta‐analysis. Neurology. 2014; 82:1153-1161. [DOI] [PubMed] [Google Scholar]
- Huang Y, Wang S, Cai X, Mai W, Hu Y, Tang H, Xu D. Prehypertension and incidence of cardiovascular disease: a meta‐analysis. BMC Med. 2013; 11:177. [DOI] [PMC free article] [PubMed] [Google Scholar]
- Qureshi AI, Suri MF, Kirmani JF, Divani AA, Mohammad Y. Is prehypertension a risk factor for cardiovascular diseases? Stroke. 2005; 36:1859-1863. [DOI] [PubMed] [Google Scholar]
- Lee ET, Howard BV, Wang W, Welty TK, Galloway JM, Best LG, Fabsitz RR, Zhang Y, Yeh J, Devereux RB. Prediction of coronary heart disease in a population with high prevalence of diabetes and albuminuria: the Strong Heart Study. Circulation. 2006; 113:2897-2905. [DOI] [PubMed] [Google Scholar]
- Kshirsagar AV, Carpenter M, Bang H, Wyatt SB, Colindres RE. Blood pressure usually considered normal is associated with an elevated risk of cardiovascular disease. Am J Med. 2006; 119:133-141. [DOI] [PubMed] [Google Scholar]
- Liu LS. 2010 Chinese guidelines for the management of hypertension. Zhonghua Xin Xue Guan Bing Za Zhi. 2011; 39:579-615. [PubMed] [Google Scholar]
- Stroup DF, Berlin JA, Morton SC, Olkin I, Williamson GD, Rennie D, Moher D, Becker BJ, Sipe TA, Thacker SB. Meta‐analysis of observational studies in epidemiology: a proposal for reporting. Meta‐analysis Of Observational Studies in Epidemiology (MOOSE) group. JAMA. 2000; 283:2008-2012. [DOI] [PubMed] [Google Scholar]
- Harris RP, Helfand M, Woolf SH, Lohr KN, Mulrow CD, Teutsch SM, Atkins D. Current methods of the US Preventive Services Task Force: a review of the process. Am J Prev Med. 2001; 20:21-35. [DOI] [PubMed] [Google Scholar]
- Lee M, Saver JL, Chang KH, Liao HW, Chang SC, Ovbiagele B. Low glomerular filtration rate and risk of stroke: meta‐analysis. BMJ. 2010; 341:c4249. [DOI] [PMC free article] [PubMed] [Google Scholar]
- Higgins JP, Thompson SG, Deeks JJ, Altman DG. Measuring inconsistency in meta‐analyses. BMJ. 2003; 327:557-560. [DOI] [PMC free article] [PubMed] [Google Scholar]
- Altman DG, Bland JM. Interaction revisited: the difference between two estimates. BMJ. 2003; 326:219. [DOI] [PMC free article] [PubMed] [Google Scholar]
- Hsia J, Margolis KL, Eaton CB, Wenger NK, Allison M, Wu L, LaCroix AZ, Black HR. Prehypertension and cardiovascular disease risk in the Women's Health Initiative. Circulation. 2007; 115:855-860. [DOI] [PubMed] [Google Scholar]
- Onat A, Yazici M, Can G, Kaya Z, Bulur S, Hergenc G. Predictive value of prehypertension for metabolic syndrome, diabetes, and coronary heart disease among Turks. Am J Hypertens. 2008; 21:890-895. [DOI] [PubMed] [Google Scholar]
- Kokubo Y, Kamide K, Okamura T, Watanabe M, Higashiyama A, Kawanishi K, Okayama A, Kawano Y. Impact of high‐normal blood pressure on the risk of cardiovascular disease in a Japanese urban cohort: the Suita study. Hypertension. 2008; 52:652-659. [DOI] [PubMed] [Google Scholar]
- Thomas F, Blacher J, Benetos A, Safar ME, Pannier B. Cardiovascular risk as defined in the 2003 European blood pressure classification: the assessment of an additional predictive value of pulse pressure on mortality. J Hypertens. 2008; 26:1072-1077. [DOI] [PubMed] [Google Scholar]
- Gu D, Chen J, Wu X, Duan X, Jones DW, Huang JF, Chen CS, Chen JC, Kelly TN, Whelton PK, He J. Prehypertension and risk of cardiovascular disease in Chinese adults. J Hypertens. 2009; 27:721-729. [DOI] [PubMed] [Google Scholar]
- Pednekar MS, Gupta R, Gupta PC. Association of blood pressure and cardiovascular mortality in India: Mumbai cohort study. Am J Hypertens. 2009; 22:1076-1084. [DOI] [PubMed] [Google Scholar]
- Dorjgochoo T, Shu XO, Zhang X, Li H, Yang G, Gao L, Cai H, Gao YT, Zheng W. Relation of blood pressure components and categories and all‐cause, stroke and coronary heart disease mortality in urban Chinese women: a population‐based prospective study. J Hypertens. 2009; 27:468-475. [DOI] [PMC free article] [PubMed] [Google Scholar]
- Ikeda A, Iso H, Yamagishi K, Inoue M, Tsugane S. Blood pressure and the risk of stroke, cardiovascular disease, and all‐cause mortality among Japanese: the JPHC Study. Am J Hypertens. 2009; 22:273-280. [DOI] [PubMed] [Google Scholar]
- Fukuhara M, Arima H, Ninomiya T, Hata J, Yonemoto K, Doi Y, Hirakawa Y, Matsumura K, Kitazono T, Kiyohara Y. Impact of lower range of prehypertension on cardiovascular events in a general population: the Hisayama Study. J Hypertens. 2012; 30:893-900. [DOI] [PubMed] [Google Scholar]
- Erbel R, Lehmann N, Mohlenkamp S, Churzidse S, Bauer M, Kalsch H, Schmermund A, Moebus S, Stang A, Roggenbuck U, Brocker‐Preuss M, Dragano N, Weimar C, Siegrist J, Jockel KH. Subclinical coronary atherosclerosis predicts cardiovascular risk in different stages of hypertension: result of the Heinz Nixdorf Recall Study. Hypertension. 2012; 59:44-53. [DOI] [PubMed] [Google Scholar]
- Sadeghi M, Aghababaei E, Talaei M, Sarrafzadegan N. Do hypertension and prehypertension count as cardiovascular risk factors among women in an Iranian society? Int J Cardiol. 2012; 155:S2 [Google Scholar]
- Stojanov V, Paunovic K, Jakovljevic B, Lovic D, Jurisic V. Blood pressure categories and mortality during a thirty‐six‐year follow‐up. Cent. Eur. J. Med. 2012:1-8. [Google Scholar]
- Takashima N, Ohkubo T, Miura K, Okamura T, Murakami Y, Fujiyoshi A, Nagasawa SY, Kadota A, Kita Y, Miyagawa N, Hisamatsu T, Hayakawa T, Okayama A, Ueshima H. Long‐term risk of BP values above normal for cardiovascular mortality: a 24‐year observation of Japanese aged 30 to 92 years. J Hypertens. 2012; 30:2299-2306. [DOI] [PubMed] [Google Scholar]
- Hadaegh F, Mohebi R, Khalili D, Hasheminia M, Sheikholeslami F, Azizi F. High normal blood pressure is an independent risk factor for cardiovascular disease among middle‐aged but not in elderly populations: 9‐year results of a population‐based study. J Hum Hypertens. 2013; 27:18-23. [DOI] [PubMed] [Google Scholar]
- Elliott WJ, Black HR. Prehypertension. Nat Clin Pract Cardiovasc Med. 2007; 4:538-548. [DOI] [PubMed] [Google Scholar]
- Gupta P, Nagaraju SP, Gupta A, Mandya CK. Prehypertension—time to act. Saudi J Kidney Dis Transpl. 2012; 23:223-233. [PubMed] [Google Scholar]
- Huang Y, Cai X, Zhang J, Mai W, Wang S, Hu Y, Ren H, Xu D. Prehypertension and incidence of ESRD: a systematic review and meta‐analysis. Am J Kidney Dis. 2014; 63:76-83. [DOI] [PubMed] [Google Scholar]
- Shen L, Ma H, Xiang MX, Wang JA. Meta‐analysis of cohort studies of baseline prehypertension and risk of coronary heart disease. Am J Cardiol. 2013; 112:266-271. [DOI] [PubMed] [Google Scholar]
- Huang Y, Su L, Cai X, Mai W, Wang S, Hu Y, Wu Y, Tang H, Xu D. Association of all‐cause and cardiovascular mortality with prehypertension: a meta‐analysis. Am Heart J. 2014; 167:160-168. [DOI] [PubMed] [Google Scholar]
- Mancia G, Fagard R, Narkiewicz K, Redon J, Zanchetti A, Bohm M, Christiaens T, Cifkova R, De Backer G, Dominiczak A, Galderisi M, Grobbee DE, Jaarsma T, Kirchhof P, Kjeldsen SE, Laurent S, Manolis AJ, Nilsson PM, Ruilope LM, Schmieder RE, Sirnes PA, Sleight P, Viigimaa M, Waeber B, Zannad F, Redon J, Dominiczak A, Narkiewicz K, Nilsson PM, Burnier M, Viigimaa M, Ambrosioni E, Caufield M, Coca A, Olsen MH, Schmieder RE, Tsioufis C, van de Borne P, Zamorano JL, Achenbach S, Baumgartner H, Bax JJ, Bueno H, Dean V, Deaton C, Erol C, Fagard R, Ferrari R, Hasdai D, Hoes AW, Kirchhof P, Knuuti J, Kolh P, Lancellotti P, Linhart A, Nihoyannopoulos P, Piepoli MF, Ponikowski P, Sirnes PA, Tamargo JL, Tendera M, Torbicki A, Wijns W, Windecker S, Clement DL, Coca A, Gillebert TC, Tendera M, Rosei EA, Ambrosioni E, Anker SD, Bauersachs J, Hitij JB, Caulfield M, De Buyzere M, De Geest S, Derumeaux GA, Erdine S, Farsang C, Funck‐Brentano C, Gerc V, Germano G, Gielen S, Haller H, Hoes AW, Jordan J, Kahan T, Komajda M, Lovic D, Mahrholdt H, Olsen MH, Ostergren J, Parati G, Perk J, Polonia J, Popescu BA, Reiner Z, Ryden L, Sirenko Y, Stanton A, Struijker‐Boudier H, Tsioufis C, van de Borne P, Vlachopoulos C, Volpe M, Wood DA. 2013 ESH/ESC Guidelines for the management of arterial hypertension: the Task Force for the management of arterial hypertension of the European Society of Hypertension (ESH) and of the European Society of Cardiology (ESC). Eur Heart J. 2013; 34:2159-2219. [DOI] [PubMed] [Google Scholar]
- Weber MA, Schiffrin EL, White WB, Mann S, Lindholm LH, Kenerson JG, Flack JM, Carter BL, Materson BJ, Ram CV, Cohen DL, Cadet JC, Jean‐Charles RR, Taler S, Kountz D, Townsend R, Chalmers J, Ramirez AJ, Bakris GL, Wang J, Schutte AE, Bisognano JD, Touyz RM, Sica D, Harrap SB. Clinical practice guidelines for the management of hypertension in the community a statement by the American Society of Hypertension and the International Society of Hypertension. J Hypertens. 2014; 32:3-15. [DOI] [PubMed] [Google Scholar]
- James PA, Oparil S, Carter BL, Cushman WC, Dennison‐Himmelfarb C, Handler J, Lackland DT, LeFevre ML, MacKenzie TD, Ogedegbe O, Smith SJ, Svetkey LP, Taler SJ, Townsend RR, Wright JJ, Narva AS, Ortiz E. 2014 evidence‐based guideline for the management of high blood pressure in adults: report from the panel members appointed to the Eighth Joint National Committee (JNC 8). JAMA. 2014; 311:507-520. [DOI] [PubMed] [Google Scholar]
- Sipahi I, Tuzcu EM, Schoenhagen P, Wolski KE, Nicholls SJ, Balog C, Crowe TD, Nissen SE. Effects of normal, pre‐hypertensive, and hypertensive blood pressure levels on progression of coronary atherosclerosis. J Am Coll Cardiol. 2006; 48:833-838. [DOI] [PubMed] [Google Scholar]
- Nicholls SJ, Bakris GL, Kastelein JJ, Menon V, Williams B, Armbrecht J, Brunel P, Nicolaides M, Hsu A, Hu B, Fang H, Puri R, Uno K, Kataoka Y, Bash D, Nissen SE. Effect of aliskiren on progression of coronary disease in patients with prehypertension: the AQUARIUS randomized clinical trial. JAMA. 2013; 310:1135-1144. [DOI] [PubMed] [Google Scholar]