Abstract
Background
Oxidative stress plays an important role in the pathogenesis of hypertension, especially in obesity‐related hypertension. The natriuretic and antinatriuretic components of the renal renin angiotensin system (RAS) maintain sodium homeostasis and blood pressure. Here, we test the hypothesis that increased oxidative stress leads to the imbalance of RAS components and hypertension in obese Zucker rats.
Methods and Results
Lean and obese rats received vehicle or tempol, a superoxide dismutase mimetic in the drinking water for 4 weeks. Compared with vehicle‐treated lean rats, vehicle‐treated obese rats exhibited higher blood pressure and increased renal oxidative stress, accompanied by increased diuretic and natriuretic responses to AT1R antagonist (Candesartan) and AT2R agonist (CGP‐42112A) and reduced diuretic and natriuretic response to MasR agonist (Ang‐[1 to 7]). Moreover, obese rats had higher ACE, AT1R and AT2R, lower ACE2 and MasR expressions in the kidney. All of the above‐mentioned abnormalities were reversed to some degree by tempol treatment. In primary cultures of renal proximal tubular (RPT) cells from lean and obese rats, tempol treatment also increased AT2R, ACE2, and MasR expressions but decreased AT1R and ACE expressions in obese rats.
Conclusions
Taken together, our study indicated that the imbalance of renal RAS components was associated with increased oxidative stress in obese rats. Furthermore, antioxidant treatment with tempol reversed the imbalance of renal RAS components and led to diuresis and natriuresis, which, at least in part, explains the blood pressure‐lowering effect of antioxidant supplementation in obesity‐related hypertension.
Keywords: hypertension, obesity, oxidative stress, renin‐angiotensin system, tempol
Introduction
Obesity plays an important role in the pathogenesis of hypertension.1–2 Both human and animal models of obesity‐related hypertension are characterized by a tendency to retain sodium, which may contribute to the development of hypertension.3–5 The causes of the abnormality in sodium homeostasis in obesity‐related hypertension remain unclear. However, it is likely that an imbalance between natriuretic and antinatriuretic factors plays an important role.6–8 The renin‐angiotensin system (RAS) is a major regulator of sodium and water homeostasis. Among all of the components in RAS, angiotensin II (Ang II) is pre‐eminent, by binding to 2 major receptor subtypes, angiotensin II type‐1 receptor (AT1R) and type‐2 receptor (AT2R).9 Both receptors are ubiquitously expressed, AT1R is involved in mediating vasoconstriction and antinatriuresis, which increase in blood pressure,10 whereas activation of AT2R is associated with vasodilatation, apoptosis, anti‐proliferation, and natriuresis, potentially lowering blood pressure. Therefore, the AT2R is considered an antagonist of the AT1R.11–12 In addition, the activation of components of the “non‐classical pathway,” angiotensin‐converting enzyme 2 (ACE2) and other peptidases leads to generation of Ang‐(1 to 7) and acting on MasR, also opposes the AT1R‐mediated effects, leading to vasodilatation and natriuresis.13 Hyperactivity of the RAS, mainly via enhanced AT1R function, contributes to the excessive renal sodium reabsorption in obesity‐related hypertension.14–15 There is evidence that AT1R activation decreases ACE2 activity and Ang‐(1 to 7) production.16 An imbalance between the antinatriuretic AT1R and natriuretic agents outside the RAS has also been suggested to be involved in the pathogenesis of hypertension in spontaneously hypertensive rats and the hypertension associated with aging.17–18
The precise nature of the imbalance of renal RAS components in human and animal models of hypertension remains to be elucidated. However, there is evidence that obesity, aging, diabetes, and hypertension are associated with increased oxidative stress,19–22 in which there is increased activity of the RAS. Oxidative stress can regulate components of the RAS. For example, oxidative stress upregulates renal AT1R expression; leading to increased stimulation of the activities of Na‐K‐ATPase, and Na/H exchanger 3 in renal proximal tubules, thus contributing to sodium retention and an increase in blood pressure.23 Chronic Ang II‐infusion, via increased oxidative stress, elevates blood pressure and more importantly causes an imbalance between the hypertensive (ACE, Ang II and AT1R) and anti‐hypertensive components (ACE2, Ang‐[1 to 7], Mas and AT2R) of the RAS in the brain.24 A previous study showed that amelioration of oxidative stress by exercise attenuated the vasoconstrictor axis of the RAS and improved the vasoprotective axis of the RAS in the brain of spontaneously hypertensive rats.25 We hypothesize that oxidative stress would cause the imbalance of the renal RAS components in obese Zucker rats. Tempol, an antioxidant reagent, could reverse the imbalance of renal RAS components in obese Zucker rats, and therefore, lower the obesity‐related hypertension, in part, by increased renal sodium excretion. Our current study found that obese Zucker rats fed tempol in drinking water, ameliorated oxidative stress, restored the balance between the natriuretic and antinatriuretic components of the renal RAS, increased sodium excretion, and reduced blood pressure. Thus, therapies that reduce superoxide bioavailability have the potential to ameliorate renal oxidative stress and improve the balance of renal RAS components in obesity‐related hypertension.
Materials and Methods
Animal Preparation
The experimental protocols were approved by the Animal Care and Use Committee from The Third Military Medical University and conformed to the Guide for the Care and Use of Laboratory Animals published by the US National Institutes of Health (NIH Publication, 8th Edition, 2011). Ten‐week‐old male obese (280 to 300 g) and lean (200 to 220 g) Zucker rats (Charles River Laboratory, Wilmington, MA) were maintained in our animal care facility, with a 12‐hour light/dark cycle and had free access to standard rat chow and drinking water ad libitum. Lean and obese Zucker rats were randomly assigned to control group and tempol group. Control rats were provided plain tap water for drinking. The tempol group rats were provided with tempol (1.0 mmol/L; Sigma, St. Louis, MO) dissolved in the drinking water, which was changed twice a day for 4 weeks.
Systolic, diastolic, and mean arterial blood pressures were measured in conscious animals by using a noninvasive tail‐cuff plethysmography (BP‐98A; Softron, Tokyo, Japan) method. Blood pressure was measured every week until the end of the study.
Animal Surgery and Experimental Protocol
The rats were anesthetized with pentobarbital (50 mg/kg body wt, intraperitoneally), and placed on a heated table to maintain rectal temperature between 36 and 37°C. A tracheotomy (PE‐240) was performed to facilitate breathing. Anesthesia was maintained by infusing pentobarbital sodium at 0.8 mg/100 g body wt per hour. Catheters (PE‐50) were placed into the left external jugular for fluid replacement, and carotid artery for recording systemic arterial pressure and heart rate (Grass Instrument, Quincy, MA). A midline abdominal incision was performed, and both the right and left ureters were catheterized (PE‐10). The right suprarenal artery, which originates from the right renal artery, was catheterized (PE‐10 heat‐stretched to 150 μm) and the vehicle (saline) or reagents were infused at a rate of 40 μL/h.26 The duration of the surgical preparation was about 60 minutes. To maintain a stable urinary output, 5% albumin was used to replace the blood extracted during each period and normal saline solution equal to 1% body weight per hour for insensible fluid loss was maintained. The rats were allowed to stabilize for 120 minutes after surgery prior to the start of the 40‐minute urine collections for clearance measurements.
In Vivo Studies on Renal Function
The protocol consisted of 5 consecutive urine collection periods with each period lasting for 40 minutes. The one 40‐minute urine collection period when only the vehicle was infused into the right suprarenal artery was considered as baseline period. After the baseline period, the rats received a bolus dose of candesartan (10 μg/kg per minute, i.v.), an AT1 receptor antagonist,18 and urine was collected for 3 time periods. Thereafter, the infusate was changed to the vehicle; urine was collected for one period, which was considered as the recovery period. The candesartan data, shown in this study, was the averages of the 3 urine collections during the candesartan infusion. Blood samples (300 μL; replaced with an equal volume of 5% albumin) were collected at the end of each period.
In another set of experiments, similar to the above protocol, after one baseline period, the rats were infused with a specific AT2R agonist, CGP‐42112A (1.0 μg/kg per minute)27 or Ang‐(1 to 7) (1.0 μg/kg per minute), a MasR receptor agonist, for 3 time periods, followed by one recovery period in which only the vehicle was infused.
At the end of the experiment, blood samples were collected and plasma was separated by centrifugation at 1500g for 15 minutes at 4°C. Urine and plasma samples were stored at −20°C until use.
Blood and Urine Analysis
The urine and plasma samples were analyzed for sodium and potassium concentrations using a flame photometer 480 (Ciba Corning Diagnostics, Norwood, MA). Creatinine levels in the plasma and urine were measured using a creatinine analyzer (Beckman, Fullerton, CA). The glomerular filtration rate (GFR) (mL/min) was estimated by creatinine clearance.28 Blood glucose was measured with a glucose analyzer (Roche, Indianapolis, IN), and plasma insulin was measured by rat insulin radioimmunoassay kit (Linco Research, St. Charles, MO). Triglycerides were measured by a triglyceride analyzer (Polymer Technology Systems, Cardiochek, IN). Hematocrit (Hct) was measured by a micro‐Hct centrifuge (Haemofuge Heraeus Instr, Germany).
Analysis of Oxidative Stress and Some Peptide Concentration
To measure oxidative stress and angiotensin peptide concentrations in the kidney cortex, the rats were euthanized using CO2 inhalation. The kidneys were quickly removed and the renal cortices were extracted by methanol. Renal glutathione concentrations were assayed by colorimetric assay kit (21023; OXIS, Foster City, CA). The extent of lipid peroxidation in the renal cortex was determined by using a commercial kit that measured the generation of malondialdehyde (MDA), according to the manufacturer's protocol (Beyotime Institute of Biotechnology, Jiangsu, China). 8‐isoprostane in urine was measured by RIA kit (516351; Cayman, Ann Arbor, MI).
Renal renin activity was quantified according to the method described by Giammattei et al29 Ang‐(1 to 7) concentrations in the renal cortex were measured by enzyme immunoassay (Bachem, CA).30 Ang II concentrations were measured by using commercially available enzyme immunoassay (EIA) kit (Cayman Chemicals, Ann Arbor, MI) directly after methanol extraction of the renal cortex, as described previously.30 Serum aldosterone concentrations were measured by a commercially available radioimmunoassay kit (DiaSorin, Dietzenbach, Germany), according to the manufacturer's instruction.31
Quantitative Real‐Time RT‐PCR (qRT‐PCR) Analysis
Quantitative real‐time RT‐PCR was used to quantify the renal cortical mRNA expressions of RAS components, ie, ACE, AT1R, AT2R, ACE2, and MasR by using specific primers,32 listed in Table 1. Briefly, the rats from these separate groups were euthanized using CO2 inhalation and the kidneys were quickly removed and immediately frozen on dry ice. Total RNA was isolated from the renal cortices using TRIzol reagent (Invitrogen), following the manufacturer's instructions; cDNA was synthesized using iScript cDNA synthesis kit (Bio‐Rad). Gene expression was measured by the ΔΔCT method and normalized to GAPDH mRNA expression. The data are presented as the fold‐change of the gene of interest, relative to that of control rats.
Table 1.
List of Primers Used for Quantitative Real‐Time RT‐PCR
| Gene | Sense | Antisense |
|---|---|---|
| ACE | TTGACGTGAGCAACTTCCAG | CAGATCAGGCTCCAGTGACA |
| AT1R | CAAAAGGAGATGGGAGGTCA | TGACAAGCAGTTTGGCTTTG |
| AT2R | TGCTGTTGTGTTGGCATTCA | ATCCAAGAAGGTCAGAACATGGA |
| ACE2 | ACCCTTCTTACATCAGCCCTACTG | TGTCCAAAACCTACCCCACATAT |
| MasR | CACTGGCCCTCCTGATGAA | GGATGCCAGAATTGAACACAGA |
| GAPDH | AGACAGCCGCATCTTCTTGT | CTTGCCGTGGGTAGAGTCAT |
ACE indicates angiotensin‐converting enzyme; AT1R, angiotensin II type‐1 receptor; AT2R, angiotensin II type‐2 receptor; GAPDH, glyceraldehyde‐3‐phosphate dehydrogenase; qRT‐PCR, quantitative real‐time polymerase chain reaction.
Cell Culture
In vitro experiments utilized primary cultures of RPT cells from lean and obese Zucker rats (14 weeks of age): these RPT cells express all the components of RAS.33–34 RPTs were isolated as described previously.28 Briefly, the rats were euthanized using CO2 inhalation and a midline abdominal incision was made. The aorta was cannulated below the kidneys and kidneys were perfused with collagenase and hyaluronidase. Enrichment of RPTs was carried out using 20% Ficoll gradient in Krebs buffer. The band at the Ficoll interface was collected and washed by centrifugation at 250g for 5 minutes. Cell viability was determined using the trypan blue exclusion test. RPT cells were cultured using DMEM‐F 12 (1:1) supplemented with 10% FBS, epidermal growth factor (EGF) 10 ng/mL, insulin 0.573 ng/mL, and penicillin 25 IU/mL, at 37°C in 95% air and 5% CO2 in a humidified atmosphere. For experiments, the cells were plated on polystyrene tissue culture dishes at a density of 1.5×10⁶ cells/well in 6‐well culture plates. At ≈85% confluency, the RPT cells were treated with the SOD mimetic Tempol (0.2 μmol/L, Sigma) for 24 hours. Water was used as a vehicle control. After treatment with the reagent or vehicle, the cells were lysed and immunoblotted for ACE, AT1R, AT2R, ACE2, and MasR.
Immunoblotting
The rats from these separate groups were euthanized using CO2 inhalation and the kidneys were quickly removed. The renal cortices were homogenized in ice‐cold lysis buffer (PBS with 1% NP40, 0.5% sodium deoxycholate, 0.1% SDS, 1 mmol/L EDTA, 1 mmol/L EGTA, 1 mmol/L PMSF, 10 μg/mL aprotinin, and 10 μg/mL leupeptin). The protein concentrations in the homogenates were quantified by a BCA method using a kit (Pierce, Rockford, IL). After boiling at 95°C for 5 minutes, 50 μg of protein were separated by SDS‐PAGE (10% polyacrylamide gel), and then electroblotted onto nitrocellulose membranes (Amersham Life Science, Arlington, TX). The membranes were incubated overnight at 4°C with the primary rabbit polyclonal antibodies against AT1R, AT2R, ACE, and ACE2 (1:400; Santa Cruz Biotechnology, Santa Cruz, CA), MasR (1:400; Alomone Labs Ltd, Jerusalem, Israel), and GAPDH (1:500, Santa Cruz Biotechnology), followed by washing and further incubation in horseradish peroxidase‐conjugated anti‐rabbit/anti‐goat secondary antibody (1:10 000 dilution). The bands were visualized by enhanced chemiluminescence kit (Amersham, Arlington, TX), and the band intensities were quantified using Quantity‐One software (Bio‐Rad, Hercules, CA), and normalized with glyceraldehyde‐3‐phosphate dehydrogenase (GAPDH) protein expression.
Statistical Analysis
The data are expressed as mean±SEM. Comparison within the groups was made by repeated measures ANOVA with Newman‐Keuls post hoc test, and comparison among groups was made by 1‐way ANOVA with Newman‐Keuls post hoc test. Statistical analysis was carried out using a software program (GraphPad Prism version 5; GraphPad Software, San Diego, CA). A value of P<0.05 was considered significant.
Results
Animal Characteristics
As shown in Table 2, the parameters, including body and kidney weights and plasma insulin, glucose, and triglyceride levels were higher in obese than lean Zucker rats (P<0.05). By contrast, GFR, corrected by kidney weight, was lower in obese than lean Zucker rat (Table 2). Tempol treatment for 4 weeks had no effect on body weight but lowered kidney weight and plasma insulin, glucose, and triglyceride levels in obese (P<0.05), but not in lean Zucker rats. Tempol also did not affect GFR corrected for kidney weight. The basal blood pressures (systolic, diastolic, and mean blood pressures) were higher in obese than lean Zucker rats (Figures 1A through 1C). In the lean Zucker rats, tempol, added to the drinking water for 4 weeks, had no effect on blood pressure, which did not increase with age. However, tempol prevented the increase in blood pressure with age in obese Zucker rats although the blood pressures remained higher than those observed in lean Zucker rats (Figures 1A through 1C).
Table 2.
General Parameters
| Parameter | Lean Control | Lean Tempol | Obese Control | Obese Tempol |
|---|---|---|---|---|
| Body weight, g | 287.8±5.7 | 289.8±5.2 | 432.5±6.3* | 422.8±7.2* |
| Kidney weight, g | 0.99±0.02 | 0.98±0.01 | 1.71±0.02* | 1.60±0.01*# |
| Blood glucose, mmol/L | 5.21±0.1 | 5.17±0.2 | 8.33±0.2* | 6.71±0.1*# |
| Insulin, nmol/L | 0.54±0.02 | 0.51±0.02 | 3.99±0.15* | 1.38±0.15*# |
| Triglycerides, mg/dL | 63.0±3.8 | 55.6±2.8 | 344.5±16.2* | 111.9±8.3*# |
| GFR, mL/g kidney/min | 0.92±0.06 | 0.94±0.05 | 0.61±0.07* | 0.68±0.06* |
Effect of tempol on some parameters in lean and obese Zucker rats. Data are shown as mean±SEM (n=8/group). GFR indicates glomerular filtration rate.
P<0.05 was considered statistically significant. *P<0.05 vs lean control; #P<0.05 vs obese control.
Figure 1.
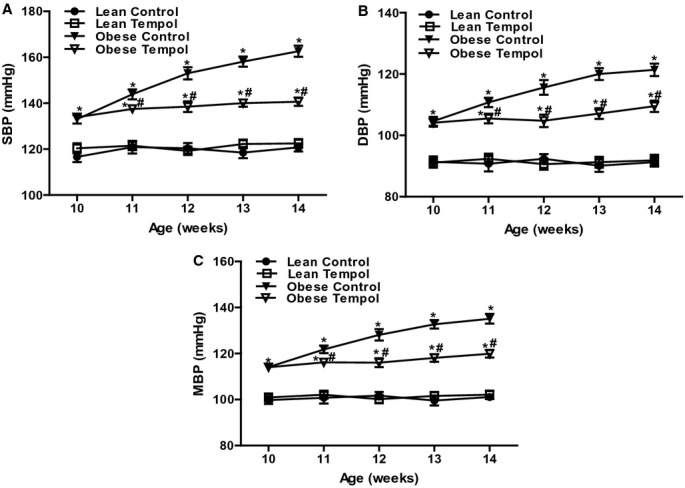
Effect of tempol on blood pressure in lean and obese Zucker rats. Blood pressure, including systolic blood pressure (SBP, A), diastolic blood pressure (DBP, B) and mean blood pressure (MBP, C), was recorded in lean and obese Zucker rats at different ages (10 to 14 weeks). The rats were treated with tempol (1.0 mmol/L) or vehicle for 4 weeks. Data are shown as mean±SEM (n=8/group). *P<0.05 vs lean control; #P<0.05 vs obese control.
Effect of Tempol on Oxidative Stress in Obese Zucker Rats
To further determine the role of oxidative stress in lean and obese rats, we measured malondialdehyde (MDA), an index of lipid peroxidation, and glutathione (GSH), a pivotal antioxidant in the kidney. The renal cortical concentration of MDA was higher and GSH level was lower in obese than lean Zucker rats. Also, urinary 8‐isoprostane level was increased in obese relative to lean Zucker rats. Tempol supplementation decreased renal cortical MDA and urinary 8‐isoprostane levels and increased renal cortical GSH level in obese Zucker rats but had no effect in lean Zucker rats (Figures 2A through 2C).
Figure 2.
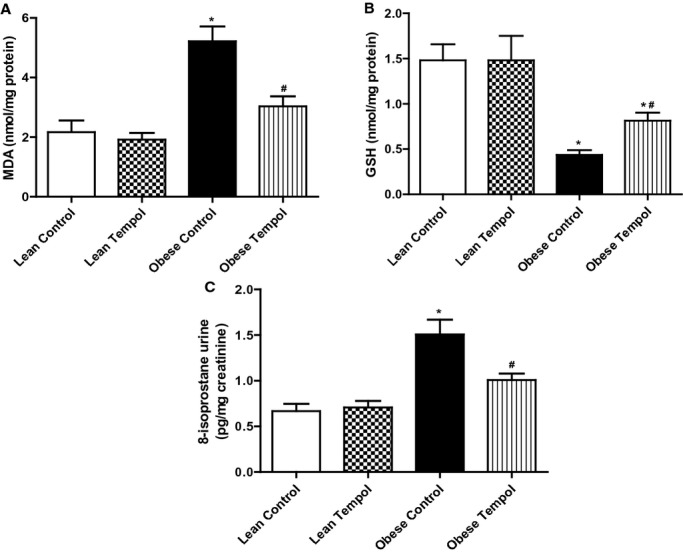
Effect of tempol on oxidative stress in the renal cortex from lean and obese Zucker rats. The indices of oxidative stress included malondialdehyde (MDA, A), Glutathione (GSH, B) and 8‐isoprostane (C). The rats were treated with tempol (1.0 mmol/L) or vehicle for 4 weeks. Data are shown as mean±SEM (n=6/group). *P<0.05 vs lean control; #P<0.05 vs obese control.
Effect of Tempol on Renal RAS Function in obese Zucker Rats
We next determined the effect of tempol on the function of several components of the RAS, including AT1R, AT2R, and MasR in lean and obese Zucker rats with or without tempol treatment. The candesartan‐mediated diuresis and natriuresis were greater in obese than lean Zucker rats which were reversed by tempol in the obese but not lean Zucker rats (Figures 3A and 3B). Heart rate and blood pressure were not significantly affected by the intrarenal candesartan infusion in all 4 groups of rats (Figures 3C and 3D). CGP‐42112A, an AT2R receptor agonist, also induced a greater diuresis and natriuresis in obese than lean Zucker rats; the AT2 receptor‐mediated diuresis and natriuresis in the obese Zucker rats was augmented by treatment with tempol (Figures 4A and 4B). Heart rate and blood pressure were not significantly different in the 4 groups of rats during CGP‐42112A infusion (Figure 4C and 4D).
Figure 3.
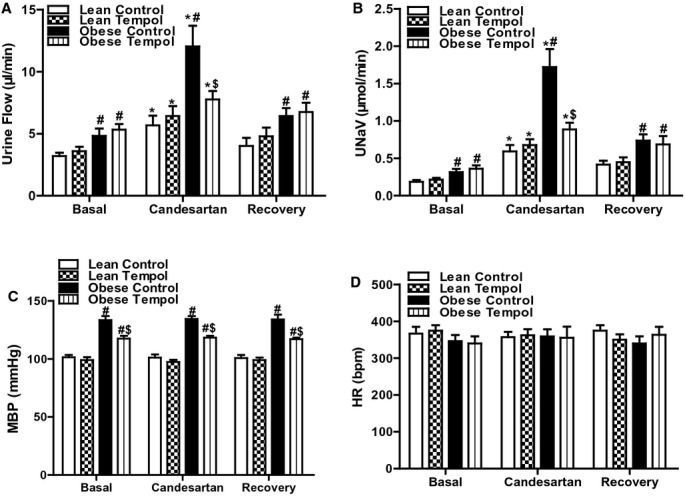
Effect of tempol on AT1R function in lean and obese Zucker rats. Lean or obese Zucker rats were treated with tempol (1.0 mmol/L) or vehicle for 4 weeks. Urine flow (A), urinary sodium excretion (UNaV) (B), mean blood pressure (MBP) (C), and heart rate (HR) (D) were recorded during the vehicle or candesartan (10 μg/kg body wt per minute) infusion via the right suprarenal artery of anesthetized rats. Values of 3 reagent periods were averaged and shown as 1. Data are shown as mean±SEM (n=6/group). *P<0.05 vs respective basal using repeated‐measures ANOVA followed Newman‐Keuls post hoc test; #P<0.05 vs lean control within the same treatment and $P<0.05 vs obese control within the same treatment using 1‐way ANOVA followed by Newman‐Keuls post hoc test. ANOVA indicates analysis of variance; AT1R, angiotensin II type‐1 receptor.
Figure 4.
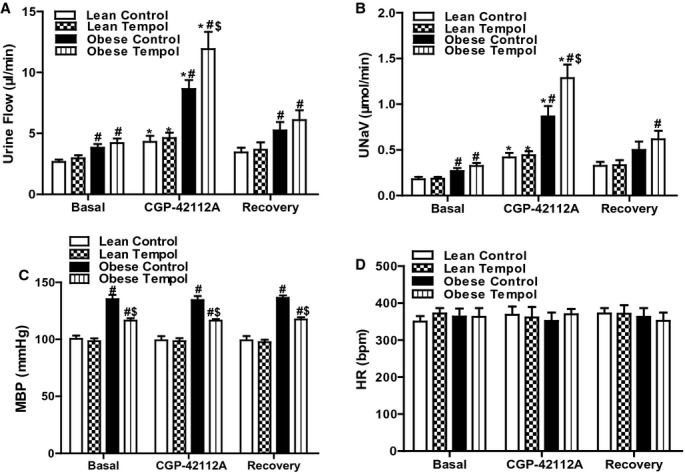
Effect of tempol on AT2R function in lean and obese Zucker rats. Lean or obese Zucker rats were treated with tempol (1.0 mmol/L) or vehicle for 4 weeks. Urine flow (A), urinary sodium excretion (UNaV) (B), mean blood pressure (MBP) (C), and heart rate (HR) (D) were recorded during the vehicle or CGP‐42112A (1.0 μg/kg body wt per minute) infusion via the right suprarenal artery of anesthetized rats. Values of 3 reagent infusion periods were averaged and shown as 1. Data are shown as mean±SEM (n=5/group). *P<0.05 vs respective basal using repeated‐measures ANOVA followed Newman‐Keuls post hoc test; #P<0.05 vs lean control within the same treatment and $P<0.05 vs obese control within the same treatment using 1‐way ANOVA followed by Newman‐Keuls post hoc test. ANOVA indicates analysis of variance; AT1R, angiotensin II type‐1 receptor.
Ang‐(1 to 7) induced a diuresis and natriuresis in both lean and obese Zucker rats. However, the Ang‐(1 to 7)‐mediated diuresis was similar but the Ang‐(1 to 7)‐mediated natriuresis was lesser in obese than lean Zucker rats. Tempol treatment enhanced the effect of Ang‐(1 to 7) in obese but not in lean Zucker rats (Figures 5A and 5B). Heart rate and blood pressure were not significantly different in all 4 groups of rats during Ang‐(1 to 7) infusion (Figures 5C and 5D). There was no difference in Hct among the groups not affected by the protocols (%: basal periods, 31.6±5.8; reagent periods, 32.5±4.2; recovery periods, 33.2±6.2). To determine if there was any systemic effect of the reagents selectively infused into the right renal artery, urine flow and sodium excretion from the left kidney were also measured. We found that the renal function, including urine flow and sodium excretion, in the left unperfused kidney was not altered by the vehicle or any of the reagent treatments (data not shown).
Figure 5.
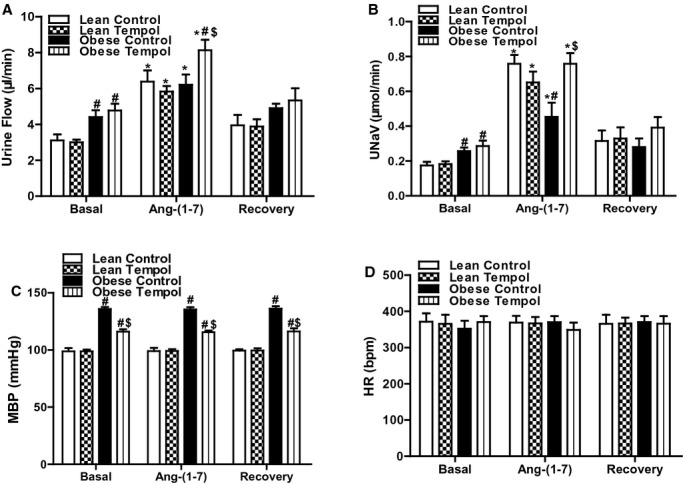
Effect of tempol on MasR function in lean and obese Zucker rats. Lean or obese Zucker rats were treated with tempol (1.0 mmol/L) or vehicle for 4 weeks. Urine flow (A), urinary sodium excretion (UNaV) (B), mean blood pressure (MBP) (C), and heart rate (HR) (D) were recorded during the vehicle or the Ang‐(1 to 7) (1.0 μg/kg body wt per minute) infusion via the right suprarenal artery of anesthetized rats. Values of 3 reagent periods were averaged and shown as 1. Data are shown as mean±SEM (n=5/group). *P<0.05 vs respective basal using repeated‐measures ANOVA followed Newman‐Keuls post hoc test; #P<0.05 vs lean control within the same treatment and $P<0.05 vs obese control within the same treatment using 1‐way ANOVA followed by Newman‐Keuls post hoc test. ANOVA indicates analysis of variance; AT1R, angiotensin II type‐1 receptor.
Effect of Tempol on Renal RAS Components in Obese Zucker Rats
Because tempol modified the effect AT1R‐, AT2R‐, and MasR‐mediated diuresis and natriuresis in obese Zucker rats, we determined if those effects were accompanied by changes in renal cortical mRNA and protein expressions of some components of the RAS, including ACE, ACE2, AT1R, AT2R, and MasR. We found that the basal expressions of ACE, AT1R, and AT2R were higher, while ACE2 and MasR expressions lower in obese than lean Zucker rats (Figures 6A and 6B), indicating that there was an imbalance between natriuretic and antinatriuretic components of the renal RAS in obese Zucker rats. Tempol had no effect on the RAS components in lean Zucker rats. However, in obese Zucker rats, tempol treatment decreased the renal ACE and AT1R expressions close to the lean Zucker rat values but increased the renal ACE2 and MasR to lean Zucker rat values and but increased further the AT2R expression in obese Zucker rats (Figures 6A and 6B). We also measured the renal renin (Figure 7A), Ang II (Figure 7B), and Ang‐(1 to 7) (Figure 7C), and serum aldosterone concentrations (Figure 7D) in all 4 groups of rats. We found that compared with lean Zucker rats, in obese Zucker rats, renal cortical renin and Ang‐(1 to 7) concentrations were lower, while Ang II and aldosterone concentrations were similar. Tempol treatment for 4 weeks had no effect on renal cortical renin, Ang II, Ang‐(1 to 7), and serum aldosterone concentrations in lean Zucker rats but decreased renin, Ang II and serum aldosterone concentrations, and normalized Ang‐(1 to 7) levels in obese Zucker rats. To study a direct effect of tempol on RAS components, we treated primary cultures of RPT cells from lean and obese Zucker rats (14 weeks) with tempol (0.2 μmol/L). RPT cells from control obese Zucker rats, relative to lean Zukcer rats, had increased protein expressions of ACE, AT1R, and AT2R, but decreased protein expressions of ACE2 and MasR. Treatment of RPT cells from obese Zucker rats with tempol decreased ACE and AT1R expression and increased ACE2 and MasR; AT2R expression was increased further. There were no effects in RPT cells from lean Zucker rats (Figure 8). All the in vitro data are agreement with the renal cortical values from the in vivo studies.
Figure 6.
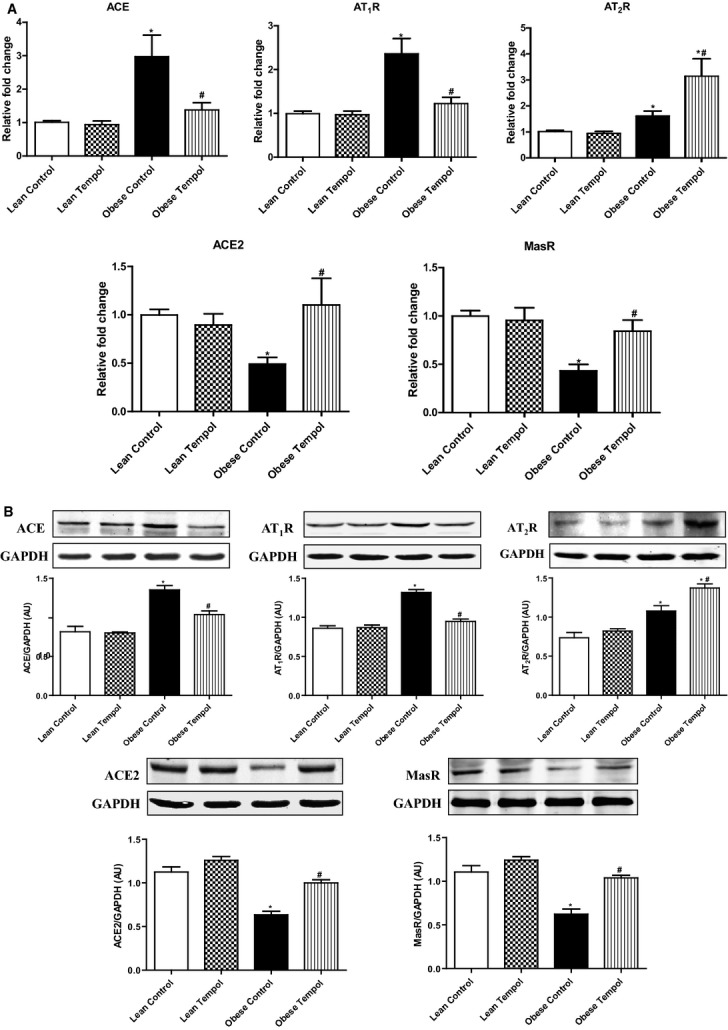
Effect of tempol on the mRNA and protein expressions of RAS components in renal cortex of lean and obese Zucker rats. Those RAS components including ACE, AT1R, AT2R, ACE2 and MasR mRNA and proteins were quantified by qRT‐PCR and immunoblotting, respectively, and normalized by GAPDH. mRNA expression in renal cortex (A). A representative western blot and densitometric analysis (B). Data are shown as mean±SEM (n=5/group). *P<0.05 vs lean control; #P<0.05 vs obese control. ACE indicates angiotensin‐converting enzyme; AT1R, angiotensin II type‐1 receptor; AT2R, angiotensin II type‐2 receptor; qRT‐PCR, quantitative real‐time polymerase chain reaction; RAS, renin angiotensin system.
Figure 7.
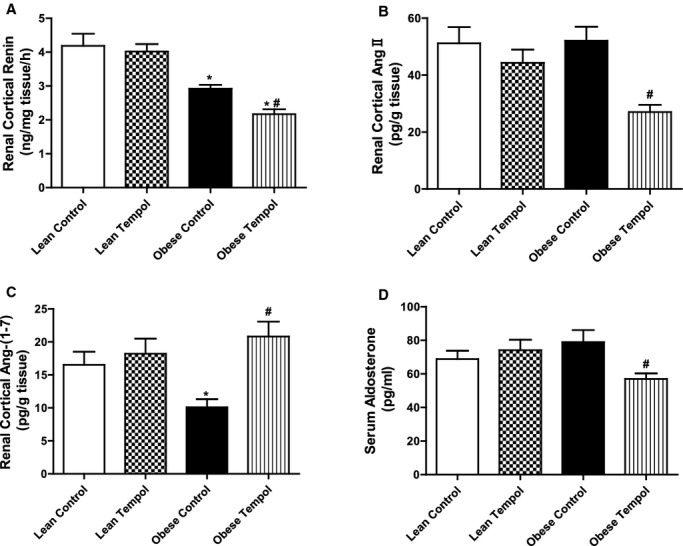
Effect of tempol on renin, angiotensin II, angiotensin (1 to 7), and aldosterone in lean and obese Zucker rats. The concentrations of renin (A), Ang II (B) and Ang‐(1 to 7) (C) in renal cortex, and serum aldosterone (D) were quantified using commercially available enzyme immunoassay kits. Data are shown as mean±SEM (n=6/group). *P<0.05 vs lean control; #P<0.05 vs obese control.
Figure 8.
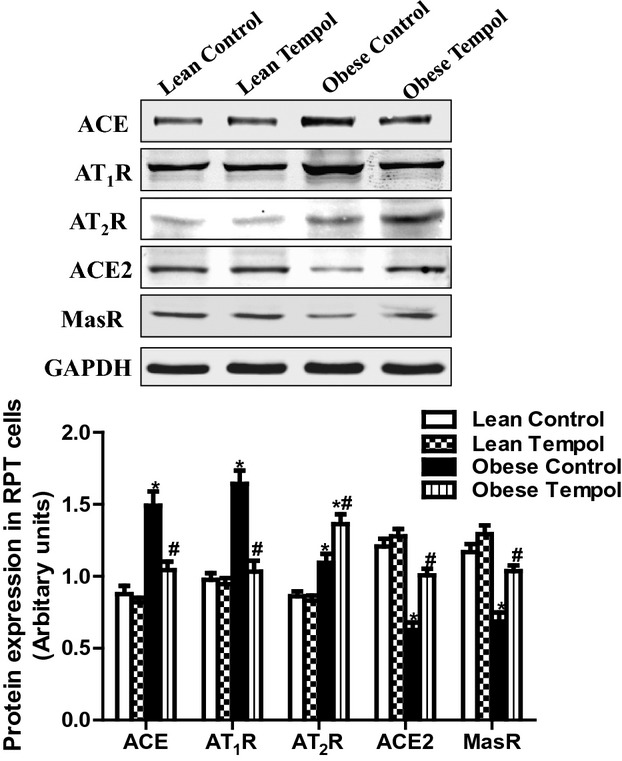
Effect of tempol on the expressions of RAS components in primary cultures of RPT cells from lean and obese Zucker rats (14 weeks). The RPT cells were treated with tempol (0.2 μmol/L) for 24 hours. RAS components including ACE, AT1R, AT2R, ACE2 and MasR were determined by immunoblotting, and normalized by GAPDH. Data are expressed as mean±SEM (n=6 in each group). *P<0.05 vs lean control; #P<0.05 vs obese control. ACE indicates angiotensin‐converting enzyme; AT1R, angiotensin II type‐1 receptor; AT2R, angiotensin II type‐2 receptor; GAPDH, glyceraldehyde‐3‐phosphate dehydrogenase; RAS, renin angiotensin system; RPT, renal proximal tubular.
Discussion
The obese Zucker rat, a model of the metabolic syndrome, exhibits an impaired diuresis and natriuresis that are ascribed to the imbalance between antinatriuretic and natriuretic factors similar to that observed in human essential hypertension and spontaneously hypertensive rats.35 The imbalance is also found in the RAS, ie, increased AT1R and AT2R function but decreased MasR function. Although a large body of evidence has accumulated to indicate the presence of increased oxidative stress in hypertension and type II diabetes, it is unclear whether this phenomenon is responsible for the imbalance of renal RAS components and superoxide‐lowering therapy with tempol could improve the imbalance in obese Zucker rats. Our current study found that antioxidant supplementation with tempol not only ameliorated renal oxidative stress and prevented the increase in blood pressure with age in obese Zucker rats. Tempol also restored the balance between the renal natriuretic and antinatriuretic RAS components, which, at least in part, could explain the blood pressure‐lowering effect of the antioxidant supplementation in this obesity‐related hypertension.
A large amount of accumulated data indicates that oxidative stress is an important contributing factor in hypertension.36–37 Hypertensive patients and animal models of hypertension have increased reactive oxygen species production and decreased antioxidant capacity.38 Vaziri et al showed that l‐buthionine‐sulfoximine, a γ‐glutamylcysteine synthetase inhibitor, causes oxidative stress and increases blood pressure in Sprague‐Dawley rats. Antioxidant supplementation with tempol attenuates oxidative stress and normalizes blood pressure in these animals.39–40 Tempol, a membrane‐permeable superoxide dismutase mimetic has been shown to reduce oxidative stress and attenuate hypertension in old FBN hybrid rats, obese Zucker rats, and spontaneously hypertensive rats.18,21,41 Our current study also found an imbalance between renal oxidative and anti‐oxidative factors in obese Zucker rats, ie, increased renal lipid peroxidation and nitrosylation and decreased GSH levels. The imbalance in redox status is accompanied by an increase in blood pressure in obese Zucker rats. Tempol treatment restored the balance between superoxide and anti‐oxidant factors, and lowered the blood pressure in obese Zucker rats, indicating the important role of oxidative stress in the pathogenesis of obesity‐related hypertension. Moreover, our current study excludes the possibility that the lowering of blood pressure is due to weight loss; as we did not observe a change in body weight with tempol treatment in obese Zucker rats.
It is believed that renal RAS plays an important role in the regulation of renal sodium excretion and blood pressure.42 Activation of AT1R decreases sodium excretion while AT2R and MasR exert the opposite effect; activation of the latter 2 receptors increases sodium excretion.10–13 A normal balance among the AT1R, AT2R, and MasR keeps sodium excretion and blood pressure in the normal range. However, in hypertensive states, that balance is lost.18,23 An enhanced AT1R function is one of the mechanisms responsible for increased renal sodium reabsorption and blood pressure in obese rats.14–15 AT1R activation has been shown to downregulate ACE2 expression and activity and Ang‐(1 to 7) production.16 Our current study also found an imbalance of renal RAS components in obese Zucker rats. Candesartan, an AT1R blocker, promoted a greater diuresis and natriuresis in obese than lean Zucker rats, while MasR‐mediated natriuresis and diuresis were weaker in obese than lean Zucker rats. Consistent with other reports, AT2R‐mediated effect is greater in obese than lean Zucker rats, and is thought to be a compensatory phenomenon against the increased blood pressure of obese Zucker rats.12 There is strong evidence that an increase in oxidative stress leads to the imbalance of RAS in old rats and rats made hypertensive with angiotensin II.18,24 Previous studies have shown that oxidative stress upregulates renal AT1R and exaggerates Ang II signaling that lead to the increased stimulation of sodium transporters and contribute to the increase in blood pressure.23 In our current study, we found that tempol treatment reversed the augmented AT1R function and restored MasR function. It is also interesting to find that tempol can further increase the compensatory effect of the AT2R. The increase in AT2R function and expression may aid in the normalization renal function and blood pressure of obese Zucker rats.
In addition to the AT1R, AT2R, and MasR, we also tested for other components of the RAS, including renin, Ang II, Ang‐(1 to 7), and aldosterone levels, ACE and ACE2 expression. The AT2R activation has been reported to negatively regulate renin levels.43 Previous studies have shown that renal renin expression was lower in obese Zucker compared with lean rats.44 Thus, it is likely that renin levels could be further reduced by the AT2R activation with tempol treatment in obese rats. However, our present study found that although renin concentration was lower in obese than lean Zucker rats, Ang II concentration was not different between lean and obese Zucker rats. This could be due to increased activity of ACE that compensates for the decrease in renin, resulting in unchanged Ang II production. Contrary to our results, Sharma et al reported an increase in renal Ang II concentrations in obese compared with lean rats.45 The reason for this discrepancy is not clear. However, the different batch and source of rats and different methods used could be reasons of such discrepancy. Consistent with previous reports, there is no difference in aldosterone concentration in lean and obese rats46 that may be related to unchanged Ang II production.
Other studies have shown that the balance between ACE and ACE2 is important in determining the development of hypertension.47 ACE expression is up‐regulated while ACE2 expression is down‐regulated in many animal models of hypertension and patients with hypertension.48 Consistent with other reports,49 our current study also found increased renal ACE expression and decreased renal ACE2 expression in obese Zucker rats. Treatment with tempol normalizes those changes, which might be also involved in its blood pressure effect. A variety of factors, such as hyperglycemia and dyslipidemia, probably contribute to the increased oxidative stress in obese Zucker rats. In accordance with the observations of previous studies,21 our current results also showed that tempol treatment reduced plasma lipids and insulin and blood glucose concentrations in obese Zucker rats. Therefore, we speculate the possibility that the decrease in circulating insulin, glucose, and plasma lipids with tempol treatment can further reduce oxidative stress status, and could be also responsible for restoring the balance of RAS components and reducing blood pressure in obese Zucker rats. In our current study, we found that tempol only prevented further increases in blood pressure with age, but did not reduce the blood pressure to the same as lean rats, suggesting that although oxidative stress is an important, but not the only factor involved in the pathogenesis of hypertension.
Based on experimental evidence of the importance of oxidative stress in hypertension, there has been great interest in developing strategies that target reactive oxygen species in the treatment of hypertension. However, antioxidant‐based therapies have failed to show therapeutic impact in human patients with hypertension.50–51 Although the reasons for these failures are not completely known, it might, at least, be related with the following: (1) antioxidants used; (2) patients included in trials; and (3) the trial design, itself. With respect to antioxidants, it is possible that agents used were ineffective, not appropriate, or that the dosing and duration of therapy were insufficient.52 Regarding the individuals included in large trials, most subjects had significant cardiovascular disease that may no longer be reversible.52 Another confounding factor is that most of the enrolled subjects were taking aspirin prophylactically. Because aspirin has intrinsic antioxidant properties, additional antioxidant therapy may be ineffective.53 To date, there are no large clinical trials in which patients were recruited based on evidence of elevated reactive oxygen species formation. It is possible that in the absence of oxidative stress, antioxidants are ineffective in the treatment of hypertension.
In conclusion, our current study provides convincing and substantial evidence that oxidative stress causes an imbalance of renal RAS components in obese Zucker rats. Chronic antioxidant supplementation could attenuate oxidative stress, lower blood pressure, and modulate the balance between the natriuretic and antinatriuretic components of the renal RAS in obese Zucker rats.
Sources of Funding
This work was supported by grants from the National Science Foundation of China (31130029) and the National Basic Research Program of China (2012CB517801).
Disclosures
None.
References
- Mathieu P, Lemieux I, Despres JP. Obesity, inflammation, and cardiovascular risk. Clin Pharmacol Ther. 2010; 87:407-416. [DOI] [PubMed] [Google Scholar]
- Asghar O, Alam U, Hayat SA, Aghamohammadzadeh R, Heagerty AM, Malik RA. Obesity, diabetes and atrial fibrillation; epidemiology, mechanisms and interventions. Curr Cardiol Rev. 2012; 8:253-264. [DOI] [PMC free article] [PubMed] [Google Scholar]
- Hall JE. Mechanisms of abnormal renal sodium handling in obesity hypertension. Am J Hypertens. 1997; 10:49S-55S. [PubMed] [Google Scholar]
- Pappachan JM, Chacko EC, Arunagirinathan G, Sriraman R. Management of hypertension and diabetes in obesity: non‐pharmacological measures. Int J Hypertens. 2011; 2011:398065. [DOI] [PMC free article] [PubMed] [Google Scholar]
- D'Elia JA, Roshan B, Maski M, Weinrauch LA. Manifestation of renal disease in obesity: pathophysiology of obesity‐related dysfunction of the kidney. Int J Nephrol Renovasc Dis. 2009; 2:39-49. [DOI] [PMC free article] [PubMed] [Google Scholar]
- Becker M, Umrani D, Lokhandwala MF, Hussain T. Increased renal angiotensin II AT1 receptor function in obese Zucker rat. Clin Exp Hypertens. 2003; 25:35-47. [DOI] [PubMed] [Google Scholar]
- Trivedi M, Marwaha A, Lokhandwala M. Rosiglitazone restores G‐protein coupling, recruitment, and function of renal dopamine D1A receptor in obese Zucker rats. Hypertension. 2004; 43:376-382. [DOI] [PubMed] [Google Scholar]
- Ali Q, Wu Y, Hussain T. Chronic AT2 receptor activation increases renal ACE2 activity, attenuates AT1 receptor function and blood pressure in obese Zucker rats. Kidney Int. 2013; 84:931-939. [DOI] [PMC free article] [PubMed] [Google Scholar]
- Carey RM, Wang ZQ, Siragy HM. Role of the angiotensin type 2 receptor in the regulation of blood pressure and renal function. Hypertension. 2000; 35:155-163. [DOI] [PubMed] [Google Scholar]
- Hunyady L, Catt KJ. Pleiotropic AT1 receptor signaling pathways mediating physiological and pathogenic actions of angiotensin II. Mol Endocrinol. 2006; 20:953-970. [DOI] [PubMed] [Google Scholar]
- Sabuhi R, Asghar M, Hussain T. Inhibition of NAD(P)H oxidase potentiates AT2 receptor agonist‐induced natriuresis in Sprague‐Dawley rats. Am J Physiol Renal Physiol. 2010; 299:F815-F820. [DOI] [PMC free article] [PubMed] [Google Scholar]
- Siddiqui AH, Ali Q, Hussain T. Protective role of angiotensin II subtype 2 receptor in blood pressure increase in obese Zucker rats. Hypertension. 2009; 53:256-261. [DOI] [PMC free article] [PubMed] [Google Scholar]
- Iyer SN, Ferrario CM, Chappell MC. Angiotensin‐(1‐7) contributes to the antihypertensive effects of blockade of the renin‐angiotensin system. Hypertension. 1998; 31:356-361. [DOI] [PubMed] [Google Scholar]
- Alonso‐Galicia M, Brands MW, Zappe DH, Hall JE. Hypertension in obese Zucker rats. Role of angiotensin II and adrenergic activity. Hypertension. 1996; 28:1047-1054. [DOI] [PubMed] [Google Scholar]
- Shah S, Hussain T. Enhanced angiotensin II ‐induced activation of Na+, K+‐ATPase in the proximal tubules of obese Zucker rats. Clin Exp Hypertens. 2006; 28:29-40. [DOI] [PubMed] [Google Scholar]
- Gallagher PE, Ferrario CM, Tallant EA. Regulation of ACE2 in cardiac myocytes and fibroblasts. Am J Physiol Heart Circ Physiol. 2008; 295:H2373-H2379. [DOI] [PMC free article] [PubMed] [Google Scholar]
- Reja V, Goodchild AK, Phillips JK, Pilowsky PM. Upregulation of angiotensin AT1 receptor and intracellular kinase gene expression in hypertensive rats. Clin Exp Pharmacol Physiol. 2006; 33:690-695. [DOI] [PubMed] [Google Scholar]
- Chugh G, Lokhandwala MF, Asghar M. Oxidative stress alters renal D1 and AT1 receptor functions and increases blood pressure in old rats. Am J Physiol Renal Physiol. 2011; 300:F133-F138. [DOI] [PMC free article] [PubMed] [Google Scholar]
- Ndisang JF. Role of heme oxygenase in inflammation, insulin‐signalling, diabetes and obesity. Mediators Inflamm. 2010; 2010:359732. [DOI] [PMC free article] [PubMed] [Google Scholar]
- Dobrian AD, Davies MJ, Schriver SD, Lauterio TJ, Prewitt RL. Oxidative stress in a rat model of obesity‐induced hypertension. Hypertension. 2001; 37:554-560. [DOI] [PubMed] [Google Scholar]
- Banday AA, Marwaha A, Tallam LS, Lokhandwala MF. Tempol reduces oxidative stress, improves insulin sensitivity, decreases renal dopamine D1 receptor hyperphosphorylation, and restores D1 receptor‐G‐protein coupling and function in obese Zucker rats. Diabetes. 2005; 54:2219-2226. [DOI] [PubMed] [Google Scholar]
- Vaziri ND, Rodriguez‐Iturbe B. Mechanisms of disease: oxidative stress and inflammation in the pathogenesis of hypertension. Nat Clin Pract Nephrol. 2006; 2:582-593. [DOI] [PubMed] [Google Scholar]
- Banday AA, Lokhandwala MF. Oxidative stress causes renal angiotensin II type 1 receptor upregulation, Na+/H+ exchanger 3 overstimulation, and hypertension. Hypertension. 2011; 57:452-459. [DOI] [PubMed] [Google Scholar]
- Sriramula S, Cardinale JP, Francis J. Inhibition of TNF in the brain reverses alterations in RAS components and attenuates angiotensin II ‐induced hypertension. PLoS One. 2013; 8:e63847. [DOI] [PMC free article] [PubMed] [Google Scholar]
- Agarwal D, Welsch MA, Keller JN, Francis J. Chronic exercise modulates RAS components and improves balance between pro‐ and anti‐inflammatory cytokines in the brain of SHR. Basic Res Cardiol. 2011; 106:1069-1085. [DOI] [PMC free article] [PubMed] [Google Scholar]
- Jose PA, Asico LD, Eisner GM, Pocchiari F, Semeraro C, Felder RA. Effects of costimulation of dopamine D1‐ and D2‐like receptors on renal function. Am J Physiol. 1998; 275:R986-R994. [DOI] [PubMed] [Google Scholar]
- Hakam AC, Hussain T. Renal angiotensin II type‐2 receptors are upregulated and mediate the candesartan‐induced natriuresis/diuresis in obese Zucker rats. Hypertension. 2005; 45:270-275. [DOI] [PubMed] [Google Scholar]
- Marwaha A, Banday AA, Lokhandwala MF. Reduced renal dopamine D1 receptor function in streptozotocin‐induced diabetic rats. Am J Physiol Renal Physiol. 2004; 286:F451-F457. [DOI] [PubMed] [Google Scholar]
- Giammattei CE, Strandhoy JW, Rose JC. Regulation of in vitro renin secretion by Ang II feedback manipulation in vivo in the ovine fetus. Am J Physiol. 1999; 277:R1230-R1238. [DOI] [PubMed] [Google Scholar]
- Sullivan JC, Semprun‐Prieto L, Boesen EI, Pollock DM, Pollock JS. Sex and sex hormones influence the development of albuminuria and renal macrophage infiltration in spontaneously hypertensive rats. Am J Physiol Regul Integr Comp Physiol. 2007; 293:R1573-R1579. [DOI] [PubMed] [Google Scholar]
- Resch M, Schmid P, Amann K, Fredersdorf S, Weil J, Schach C, Birner C, Griese DP, Kreuzer P, Brunner S, Luchner A, Riegger GA, Endemann DH. Eplerenone prevents salt‐induced vascular stiffness in Zucker diabetic fatty rats: a preliminary report. Cardiovasc Diabetol. 2011; 10:94. [DOI] [PMC free article] [PubMed] [Google Scholar]
- Sriramula S, Cardinale JP, Lazartigues E, Francis J. ACE2 overexpression in the paraventricular nucleus attenuates angiotensin II‐induced hypertension. Cardiovasc Res. 2011; 92:401-408. [DOI] [PMC free article] [PubMed] [Google Scholar]
- Ali Q, Sabuhi R, Hussain T. High glucose up‐regulates angiotensin II subtype 2 receptors via interferon regulatory factor‐1 in proximal tubule epithelial cells. Mol Cell Biochem. 2010; 344:65-71. [DOI] [PMC free article] [PubMed] [Google Scholar]
- Ito M, Oliverio MI, Mannon PJ, Best CF, Maeda N, Smithies O, Coffman TM. Regulation of blood pressure by the type 1A angiotensin II receptor gene. Proc Natl Acad Sci USA. 1995; 92:3521-3525. [DOI] [PMC free article] [PubMed] [Google Scholar]
- Hollenberg NK, Moore T, Shoback D, Redgrave J, Rabinowe S, Williams GH. Abnormal renal sodium handling in essential hypertension. Relation to failure of renal and adrenal modulation of responses to angiotensin II. Am J Med. 1986; 81:412-418. [DOI] [PubMed] [Google Scholar]
- Renna NF. Oxidative stress, vascular remodeling, and vascular inflammation in hypertension. Int J Hypertens. 2013; 2013:710136. [DOI] [PMC free article] [PubMed] [Google Scholar]
- Dikalov SI, Ungvari Z. Role of mitochondrial oxidative stress in hypertension. Am J Physiol Heart Circ Physiol. 2013; 305:H1417-H1427. [DOI] [PMC free article] [PubMed] [Google Scholar]
- Manning RD, Jr, Meng S, Tian N. Renal and vascular oxidative stress and salt‐sensitivity of arterial pressure. Acta Physiol Scand. 2003; 179:243-250. [DOI] [PubMed] [Google Scholar]
- Banday AA, Lau YS, Lokhandwala MF. Oxidative stress causes renal dopamine D1 receptor dysfunction and salt‐sensitive hypertension in Sprague‐Dawley rats. Hypertension. 2008; 51:367-375. [DOI] [PubMed] [Google Scholar]
- Banday AA, Fazili FR, Lokhandwala MF. Oxidative stress causes renal dopamine D1 receptor dysfunction and hypertension via mechanisms that involve nuclear factor‐kappaB and protein kinase C. J Am Soc Nephrol. 2007; 18:1446-1457. [DOI] [PubMed] [Google Scholar]
- Chen X, Patel K, Connors SG, Mendonca M, Welch WJ, Wilcox CS. Acute antihypertensive action of tempol in the spontaneously hypertensive rat. Am J Physiol Heart Circ Physiol. 2007; 293:H3246-H3253. [DOI] [PubMed] [Google Scholar]
- Carey RM, Siragy HM. Newly recognized components of the renin‐angiotensin system: potential roles in cardiovascular and renal regulation. Endocr Rev. 2003; 24:261-271. [DOI] [PubMed] [Google Scholar]
- Ichihara A, Hayashi M, Hirota N, Okada H, Koura Y, Tada Y, Kaneshiro Y, Tsuganezawa H, Saruta T. Angiotensin II type 2 receptor inhibits prorenin processing in juxtaglomerular cells. Hypertens Res. 2003; 26:915-921. [DOI] [PubMed] [Google Scholar]
- Siragy HM, Inagami T, Carey RM. NO and cGMP mediate angiotensin AT2 receptor‐induced renal renin inhibition in young rats. Am J Physiol Regul Integr Comp Physiol. 2007; 293:R1461-R1467. [DOI] [PubMed] [Google Scholar]
- Sharma R, Sharma M, Reddy S, Savin VJ, Nagaria AM, Wiegmann TB. Chronically increased intrarenal angiotensin II causes nephropathy in an animal model of type 2 diabetes. Front Biosci. 2006; 11:968-976. [DOI] [PubMed] [Google Scholar]
- Komers R, Rogers S, Oyama TT, Xu B, Yang CL, McCormick J, Ellison DH. Enhanced phosphorylation of Na(+)‐Cl‐ co‐transporter in experimental metabolic syndrome: role of insulin. Clin Sci (Lond). 2012; 123:635-647. [DOI] [PMC free article] [PubMed] [Google Scholar]
- Danilczyk U, Penninger JM. Angiotensin‐converting enzyme II in the heart and the kidney. Circ Res. 2006; 98:463-471. [DOI] [PubMed] [Google Scholar]
- Koka V, Huang XR, Chung AC, Wang W, Truong LD, Lan HY. Angiotensin II up‐regulates angiotensin I‐converting enzyme (ACE), but down‐regulates ACE2 via the AT1‐ERK/p38 MAP kinase pathway. Am J Pathol. 2008; 172:1174-1183. [DOI] [PMC free article] [PubMed] [Google Scholar]
- Samuel P, Ali Q, Sabuhi R, Wu Y, Hussain T. High Na intake increases renal angiotensin II levels and reduces expression of the ACE2‐AT(2)R‐MasR axis in obese Zucker rats. Am J Physiol Renal Physiol. 2012; 303:F412-F419. [DOI] [PMC free article] [PubMed] [Google Scholar]
- Palumbo G, Avanzini F, Alli C, Roncaglioni MC, Ronchi E, Cristofari M, Capra A, Rossi S, Nosotti L, Costantini C, Cavalera C. Effects of vitamin E on clinic and ambulatory blood pressure in treated hypertensive patients. Collaborative Group of the Primary Prevention Project (PPP)–Hypertension study. Am J Hypertens. 2000; 13:564-567. [DOI] [PubMed] [Google Scholar]
- Ghosh SK, Ekpo EB, Shah IU, Girling AJ, Jenkins C, Sinclair AJ. A double‐blind, placebo‐controlled parallel trial of vitamin C treatment in elderly patients with hypertension. Gerontology. 1994; 40:268-272. [DOI] [PubMed] [Google Scholar]
- Rosenbaugh EG, Savalia KK, Manickam DS, Zimmerman MC. Antioxidant‐based therapies for angiotensin II‐associated cardiovascular diseases. Am J Physiol Regul Integr Comp Physiol. 2013; 304:R917-R928. [DOI] [PMC free article] [PubMed] [Google Scholar]
- Wu R, Lamontagne D, de Champlain J. Antioxidative properties of acetylsalicylic acid on vascular tissues from normotensive and spontaneously hypertensive rats. Circulation. 2002; 105:387-392. [DOI] [PubMed] [Google Scholar]


