Abstract
1. Context
The “AX”-version of the visual continuous performance task (AX-CPT) is widely used for investigating visual working memory dysfunction in schizophrenia. Event-related potentials (ERP) provide an objective index of brain function, and can be used to evaluate brain substrates underlying impaired cognition in schizophrenia.
2. Objective
To assess mechanisms underlying visual working memory dysfunction in schizophrenia relative to impairment of early visual processing.
3. Design, Setting and Participants
Between-group design in a chronic treatment setting, with 30 individuals with schizophrenia and 17 healthy comparison subjects. Three versions of AX-CPT, with parametric variations of the proportions of trial types, were used to test performance and underlying neural activity under differential challenge situations. Contrast sensitivity measures were obtained from the majority of subjects.
7. Main Outcome Measures
Behavioral performance was assessed using d’-context scores. Integrity of stimulus- and task-related cortical activation to both cue and probe stimuli was assessed using sensory (C1, P1, N1) and cognitive (N2, CNV) ERP components. Early magnocellular/parvocellular function was assessed using contrast sensitivity. Linear regression and path analyses were used to assess relations between physiological and behavioral parameters.
8. Results
Patients showed reduced amplitude of both early sensory (P1, N1) and later cognitive (N2, CNV) ERP components. Deficits in sensory (N1) and cognitive (N2) components to cue stimuli contributed independently to impaired behavioral performance. In addition, sensory deficits predicted impaired cognitive ERP generation. Finally, deficits in performance correlated with impairments in contrast sensitivity to low, but not high, spatial frequency stimuli.
9. Conclusions
Working memory deficits in schizophrenia have increasingly been attributed to impairments in stimulus encoding, rather than to failures in memory retention. The present study provides objective physiological support for encoding hypotheses. Further, deficits in sensory processing contribute significantly to impaired working memory performance, consistent with generalized neurochemical models of schizophrenia.
Introduction
Deficits in cognitive processing have been extensively documented in schizophrenia and shown to correlate with poor long-term outcome1,2. Recently, deficits in early sensory processing have been demonstrated as well, using methods such as contrast sensitivity3, fMRI4-6 and steady state7,8 or transient9 event-related potentials (ERP). However, the relationships between sensory dysfunction and higher order cognitive impairments have been investigated only to a limited degree10-13. The present study uses variations of the “AX”-type continuous performance test (AX-CPT) combined with high density event-related potentials (ERPs) to investigate contributions of early visual dysfunction to impaired cognitive processing in schizophrenia.
The AX-CPT is a well-established behavioral paradigm that elicits a consistent pattern of impairments in performance in both schizophrenia patients14-20 and unaffected first-degree relatives21 relative to controls. In AX-CPT, letters are presented sequentially on a computer screen, and subjects must respond to a cue-target sequence consisting of the letter “A” followed by the letter “X” (AX sequences), while ignoring all other cue-probe sequences. Invalid sequences include those which have invalid cues (collectively referred to as “B”) followed by the letter “X” (BX sequences), or invalid probes (collectively referred to as “Y”) following the letter “A” (AY sequences), or sequences with both invalid cues and invalid probes (BY sequences).
In the most widely used version of the task (termed “AX-70”)15,16,18-20, 70% of the trials consist of AX sequences, creating a strong prepotency to respond whenever the probe “X” is presented. Following an invalid cue (“B”), therefore, subjects need to use local (within-trial) information to overcome this global prepotency. Thus, correct AX-CPT performance requires that cue information be correctly encoded and then retained across the delay to guide behavior15,22,23. In the AX-70, schizophrenia patients show not only significant reductions in hit rate to AX trials and but also an increase in false alarm to BX, suggesting a specific deficit in the ability to use cue information to guide subsequent target response.
The initial use of the AX-70 version of the task in schizophrenia was based largely on dopaminergic theories24-26, which postulated that patients would be particularly impaired in retaining the local information on-line due to specific dysfunction of prefrontal dopamine-recipient prefrontal regions. In addition, interpretation of these models is derived from cognitive models that postulate discrete input, association, context and response stages 15,22. Recent developments in schizophrenia and cognitive neuroscience research have challenged both sets of hypotheses.
First, deficits in working memory in schizophrenia have increasingly been attributed to failures of encoding, rather than memory retention19 ,27,28. Second, schizophrenia-like deficits in AX-CPT performance may be reproduced by administration of the N-methyl-D-aspartate (NMDA) receptor antagonist ketamine to normal volunteers20, consistent with glutamatergic29,30 and other distributed neural theories31 of schizophrenia.
Third, recent studies of visual processing suggest that sensory input to prefrontal regions arises via two distinct pathways: a rapid, low resolution “perception for action” system that receives input primarily from the magnocellular visual system and projects primarily via the dorsal stream visual pathway, and a slower, higher resolution “perception for identification” system that projects primarily via the ventral visual system32,33. Deficits in magnocellular/dorsal stream processing have been demonstrated consistently in schizophrenia3,4,6 ,7-9 and contribute significantly to impairments in processes such as perceptual closure33and face recognition12. However, potential involvement of sensory systems in deficits on cognitive tasks such as AX-CPT has been understudied. This is the first study to obtain neurophysiological measures to evaluate integrity of initial sensory responses during AX-CPT.
We employed an ERP paradigm that has been validated based upon both dipole mapping, and direct intracranial recording in awake, behaving primates17,34. In this paradigm early components including P1 and N1 index function at the level of dorsal and ventral stream visual cortex located in middle occipital gyrus (MOG)13,35, while later components including N2 and contingent negative variation (CNV) index function of frontal brain regions such as dorsolateral prefrontal (DLPFC) and medial prefrontal cortex (MPC), including anterior cingulate cortex (ACC)36.
Our study also employs unique parametric variations of the AX-CPT in which visual stimuli and task instructions remain the same, but stimulus probabilities change, leading to different global response set17 (Table 1). These variations permit subfractionation of underlying cognitive processes. Based upon prior research, we hypothesized that sensory processes, as indexed by sensory P1 and N1 components, would be impaired across task versions in schizophrenia, and would contribute significantly to overall impairments in task performance. We hypothesized that amplitude of frontal N2 and CNV potentials would be reduced as well, consistent with impaired encoding of cue-related information17.
Table 1.
Trial type probabilities for each variant of AX-CPT
| Trial type | ||||||||||
|---|---|---|---|---|---|---|---|---|---|---|
| AX | BX | AY | BY | Global Prepotency | P(A) % | P(X) % | P(X|A) % | Local Prepotency (after cue A) | Conditional Probability Ratio (P(X|A)/P(A)) | |
| Task | Go | -------No-Go------- | ||||||||
| AX-70 | 70 | 10 | 10 | 10 | Go | 80 | 80 | 87.5 | Go | 1.09 |
| AY-70 | 10 | 10 | 70 | 10 | No-Go | 80 | 20 | 12.5 | No-Go | 0.16 |
| BX-70 | 10 | 70 | 10 | 10 | No-Go | 20 | 80 | 50 | Go=No-Go | 2.50 |
*P(A), probability of cue A; P(X), probability of target X; P(X|A), probability of target X, given cue A
Finally, we evaluated basic visual processing using contrast sensitivity to low vs. mid/high spatial frequency (SF) sine wave stimuli along with AX-CPT performance in a subgroup of subjects. Low SF stimuli are processed preferentially by the magnocellular visual system, while high SF stimuli are processed preferentially by the parvocellular system. We have previously observed that patients with schizophrenia show preferential deficits in magnocellular function4,7. For this study, we hypothesized that preferential deficits in detection of low SF stimuli would again be observed and would correlate with impaired AX-CPT performance, consistent with early visual contributions to overall cognitive impairment in schizophrenia.
Methods
Participants
Thirty patients meeting DSM-IV criteria for schizophrenia and 17 healthy volunteers participated. Patients were recruited from inpatient and outpatient facilities associated with the Nathan Kline Institute for Psychiatric Research (NKI). Diagnoses were obtained using the Structured Clinical Interview for DSM-IV (SCID)37 and available clinical information. Controls were recruited through the Volunteer Recruitment Pool at the NKI. All subjects provided informed consent, and received a cash compensation for their time. This study was approved by the NKI Internal Review Board. Healthy volunteers with a history of SCID-defined Axis I psychiatric disorder were excluded. Patients and controls were excluded if they had any neurological or ophthalmologic disorders that might affect performance or if they met criteria for alcohol or substance dependence within the last 6 months or abuse within the last month. All patients were receiving antipsychotic medication at the time of testing. Chlorpromazine equivalents were calculated as described previously38. All participants had normal or corrected to normal vision. Clinical and demographic information are included in Table 2. Data from 3 patients and 2 controls were discarded due to excessive movement artifacts. Contrast sensitivity were obtained in a subgroup of 20 patients and 9 controls that had no significantly different characteristics, using previously described methods39.
Table 2.
Subject Characteristics
| Controls (n=27) | Patients (n=15) | p value | |
| Age | 32.5 ± 1.8 | 33.3 ± 2.2 | p=.75 |
| Gender (M/F) | 12/3 | 27/0 | |
| Chlorpromazine daily equivalent, mg | 1241.3 ± 122.2 | ||
| Personal SES | 49.1 ± 10.1 | 21.5 ± 8.6 | p<.0001 |
| Parental SES | 50.7 ± 10.9 | 40.2 ± 24.6 | p=.1 |
| BPRS total score | 40.0 ± 1.9 | ||
| SANS total score | 33.7 ± 2.5 | ||
| ILS standard score | 33.0 ± 2.2 | ||
| WAIS Performance IQ | 75.6 ± 1.6 | ||
| IQ (quick test)43 | 114 ± 1.9 | 93.7 ± 2.2 | p<.0001 |
| Duration of illness | 14.5 ± 1.5 |
During recordings, subjects sat in a comfortable chair inside a darkened, electrically shielded recording chamber, facing a computer monitor. Subjects were instructed to respond quickly and accurately by pressing a button on a response pad. They had a practice block of trials before the recordings were initiated.
Paradigm
Cue-probe sequences were presented sequentially on a computer screen located 137cm from subject's eyes using Presentation software (Neurobehavioral Systems, Inc.). Letters subtended ~ 2° of visual arc and were presented for 100 ms, white on black, using Helvetica font.
The interval between cue and probe letters (SOA) was 1240ms, and the interval between successive cue-probe sequences was 1390ms. Subjects were instructed to respond by button press following an AX sequence while ignoring all other cue-probe sequences. Invalid (B) cues and invalid (Y) probes consisted of letters other than “A” and “X”. Response window following target presentation was 1s.
In each task variant, one trial type was presented with 70% probability, while all other sequences were presented with 10% probability, in pseudorandom order (Table 2). Performance was assessed using the parameter d’-context, which reflects the ability to utilize the cue stimulus to determine the correct response to a subsequently presented valid target letter (AX vs. BX sequence)18,19,45,46.
Each subject performed six blocks of 93 trials for each of the 3 tasks, totaling 1674 trials. In most cases task AX-70 was presented first, because this was the condition of primary interest. Task order did not significantly affect performance either across or within group (main effect of order: F3,41=.25, p=.86; group * order interaction: F3,41=.76, p= .52). Subjects took breaks between blocks, and did not report abnormal fatigue during the tasks.
ERP Recording
Data Acquisition
Continuous EEG was acquired through an ActiveTwo Biosemi system from 168 scalp electrodes, and digitized at 512Hz. The continuous data were separated into epochs (-100 to 750ms) surrounding the digital event tags, baseline corrected from -100 ms to stimulus onset, and an artifact rejection criterion of ±80μV was applied. Epochs for the correct trials were averaged separately for each trial type, for cue and probe periods, for each subject, and a nasal reference was applied to the averaged data. Subjects with fewer than 25 accepted trials in any condition were removed from the analysis. For the remaining subjects, the average percent of accepted sweeps was 77.9±12.5% for controls and 72.0±15.1% for patients. Grand mean averages for each group were obtained by averaging the data from all subjects. Electrode placement was highly consistent across subjects due to the use of an electrode cap that constrained inter-electrode spacing and placement. An averaged version of the electrode locations on the head was used for group topographic data.
ERP analysis
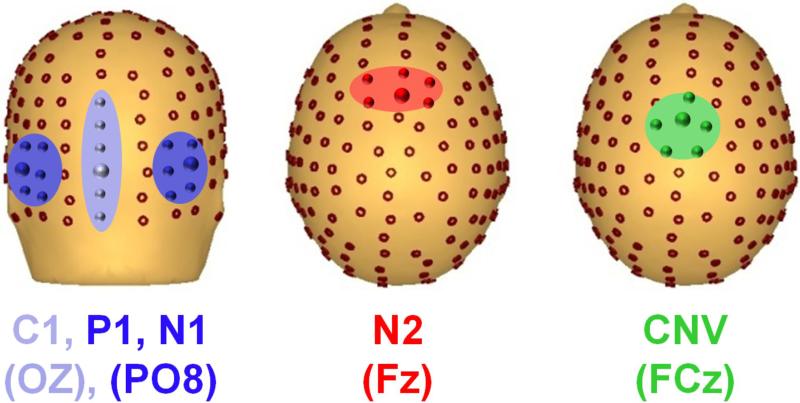
Spatiotemporal windows for peak detection were determined based upon previous results17,35. The averaged ERP were filtered (lowpass, cutoff 45Hz, zero phase shift, 48db) and, for each component, peak amplitude was obtained from the median of 6 electrodes that covered the area of scalp where this component was best represented (Figure 1). Time windows were: C1:60-120; P1:75-130ms; N1:100-200ms; N2:220-350msand CNV:1200-1250ms. Peaks amplitudes were chosen as the dependent measure because of the large latency difference between patients and controls.
Figure 1. Electrode distribution on the scalp.
Posterior (left) and top (middle and right) view, with electrodes used for statistics highlighted for each component measured.
Contrast Sensitivity
Horizontal sine-wave gratings were presented for 32 milliseconds at spatial frequencies of 0.5, 7, or 21 cycles/degree3. A spatial 2-alternative forced-choice procedure was used. On each trial, a sinewave grating was presented on one side of a monitor and a uniform field of average luminance was presented simultaneously on the opposite side. Sides were randomly varied across trials. The viewing distance was 160 cm, and the grating and uniform field together subtended 5.7° x 5.7°of visual angle. Participants stated which side of the display contained the grating. An up-down transform rule was used to determine contrast sensitivity associated with 79.4% correct responses for each spatial frequency (SF), in steps of 1.5 dB. The mean of 8 reversals was used to estimate a threshold.
Statistical analysis
Between-group analyses were conducted using repeated measures MANOVA (rmMANOVA) with diagnostic group as a between-subject factor, and cue-type (A vs. B), probe-type (X vs. Y), preceding-cue-type (A vs. B preceding probe stimuli) and task variant (AX-70, AY-70, BX-70) as within-subject factors, as appropriate. Relationship between variables was determined using stepwise multivariate regression analysis, with statistical significance determined using r change parameter. Further relationship among variables was evaluated by path analysis, as implemented in AMOS 18.0 (SPSS Inc., Chicago, IL) (for details, see Online-only Materials). Effect sizes were calculated using the Cohen d statistic47. All tests were two-tailed with a preset level of significance of p<0.05. Unless otherwise noted, data in text represent mean ± standard deviation.
Results
Behavioral Results
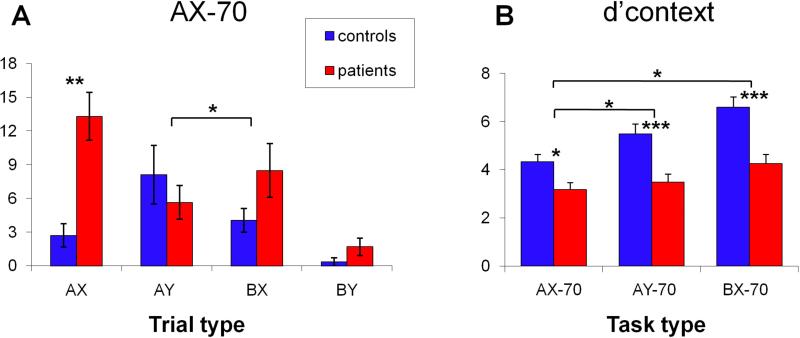
As expected, patients showed increased AX errors (F1,35=30.3, p<.0001) and greater BX-, relative to AY-, errors (F1,35=5.78, p=.022) both across all task versions and in the AX-70 alone (Figure 2A). As a result, both d’ (F1,35=28.9, p<.0001) and d’-context (F2,34=18.5, p<.001) scores were significantly reduced across task variants, with large effect-size differences between groups (Figure 2B, eTable 2). The task * group interaction was also significant (F2,34=4.4, p=.019), reflecting greater deficits in AY-70 (F1,35=4.5, p=.041) and BX-70 (F1,35=6.7, p=.014) relative to AX-70 in patients vs. controls.
Figure 2. Behavioral Results.
A. Mean (± SEM) of errors for all trial types in task AX-70 for controls (blue) and patients (red). Errors for trials AX were omissions and for trials AY, BX and BY were false alarms. B. d’context across tasks. Corresponding effect sizes (Cohen's d) were AX-70, d=.83; AY-70, d=1.32; BX-70, d=1.45. * = p<.05, ** = p<.01, *** = p<.001.
Patients also had longer reaction times (RT) to the correct target than controls (controls: 296±84ms, patients: 435±105ms; F1,35=34.9, p<.001, d=1.46), and RT varied by task (F2,34=54.9, p<.001), but there was no significant group X task interaction.
Event Related Potentials (ERP)
Waveforms elicited in the AX-70 condition are illustrated in Figures 3 and 4. Similar components were obtained in the other task variants (eFigures 1-4). Peak amplitudes for sensory (C1, P1, N1) and cognitive (N2, CNV) components were calculated for each subject in response to cue and target stimuli separately and analyzed across subjects. Probe trial types were grouped according to type of preceding cue (A or B) and also to type of probe (X or Y). Effect sizes are summarized in eTable 2.
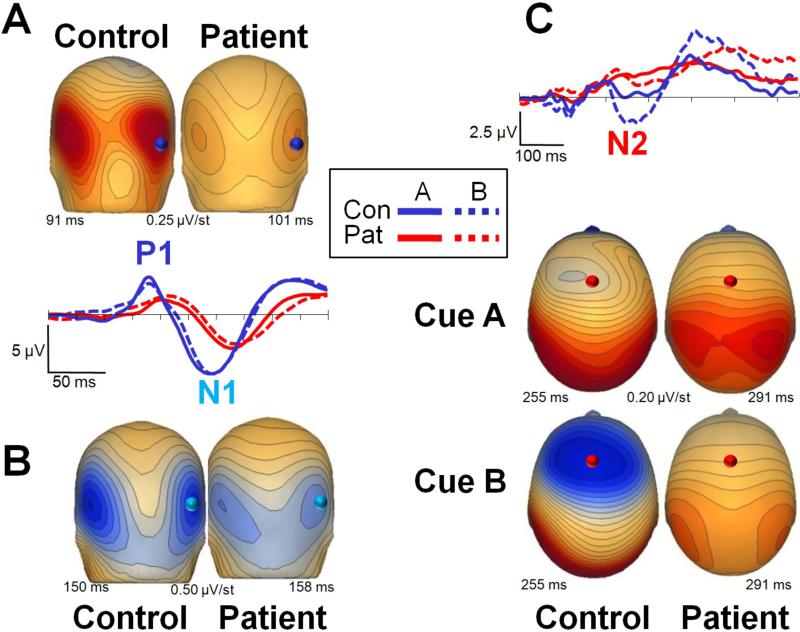
Figure 3. Sensory (P1, N1) and cognitive (N2) event-related potential (ERP) activity in response to cue stimuli in the AX-70 task variant.
The activity is presented in two ways. The scalp voltage distributions for each component for patients (right) and controls (left) are shown plotted over the head representation; scales are in μV/step, red is positive and blue is negative. The plots show ERP waveforms recorded at the electrode highlighted over the scalp renditions, for both patients (right) and controls (left) and for cues A and B. Panels represent different components as follow: A. P1; B. N1; C. N2. Note that statistics results described in the manuscript refer to the median of the electrodes over the region analyzed (Figure 1).
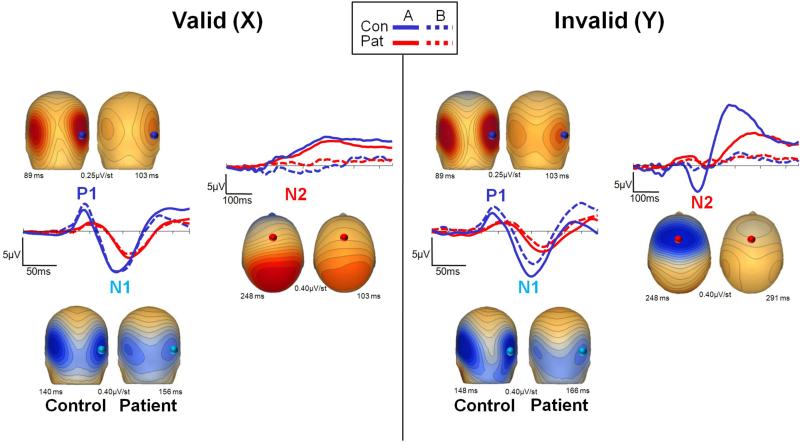
Figure 4. Sensory (P1, N1) and cognitive (N2) event-related potential (ERP) activity in response to probe stimuli in the AX-70 task variant.
Conventions as in Figure 3. The left panel shows activity following presentation of the valid probe (X) and the right panel shows activity following presentation of the invalid probe (Y).
Separate rmMANOVAs were conducted for the two sensory (P1, N1) and the two cognitive (N2, CNV) potentials, and for cue and probe stimuli.
Sensory Potentials
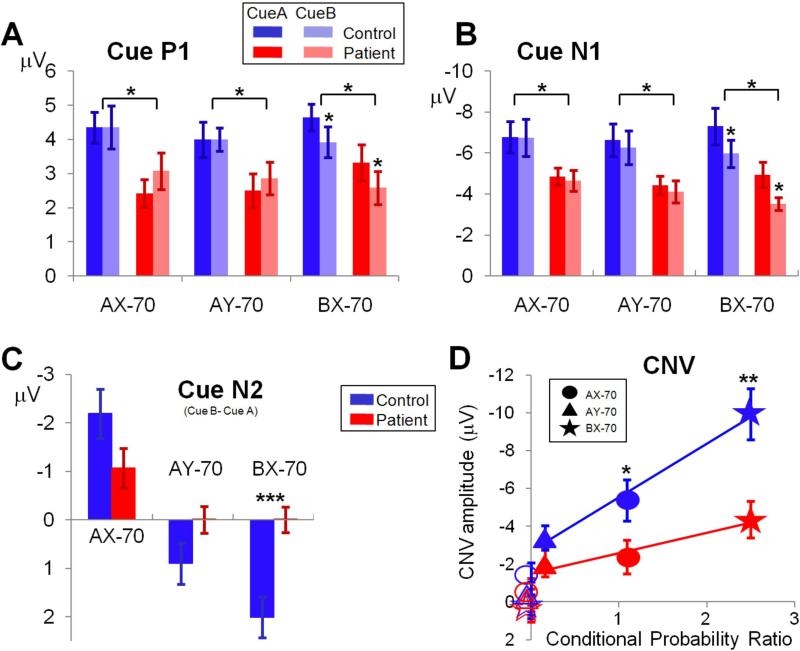
Group effects: Amplitudes of both P1 (cue: F1,35=5.94, p=.020 ; probe: F1,35=5.77, p=.022) and N1 (cue: F1,35=7.83, p=.008; probe: F1,35=10.9, p=.002) were significantly reduced in schizophrenia across all conditions, reflecting significant impairment in early sensory processing (Figures 5,6). Larger N1 responses were observed to A vs. B cues (F1,35=13.1, p=.001) (Figure 5) and X vs. Y probes (F1,35=23.2, p<.0001) (Figure 6) across tasks. However, the cue-type * group (F1,35=.04, p=.8) and probe-type * group (F1,35=1.06, p=.3) interactions were not significant , suggesting similar differentiation across groups.
Figure 5. Mean (± SEM) ERP component amplitudes to cue stimuli across task variants.
A: early visual component P1; B: early visual component N1; C: difference in peak amplitudes of N2 to B- vs. A-cues; D: CNV amplitude versus conditional probability ratio (see Table 1). * = p<.05, ** = p<.01, *** = p<.001.
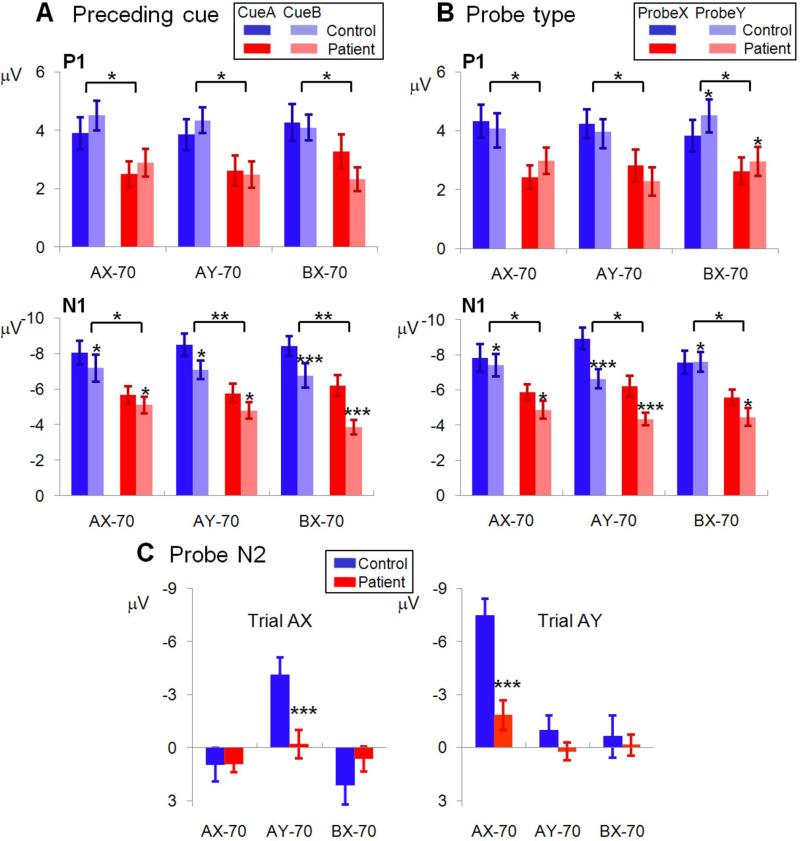
Figure 6. Mean (± SEM) ERP component amplitudes to probe stimuli across task variants.
A: P1 and N1 amplitudes to preceding cue (A or B) B: P1 and N1to probe type (X or Y); C: N2 amplitudes following A-cues, across task variants * = p<.05, ** = p<.01, *** = p<.001.
Task effects
For cues, larger sensory responses were observed to A vs. B cues in the BX-70 condition only (Figures 5A), as reflected in significant cue-type * task interactions for both the P1 (F2,34=8.10, p=.001) and N1 (F2,34=4.69, p=.016) components. Nevertheless, the degree of modulation was similar across groups, as reflected in non-significant cue * task * group interactions (P1: F2,34=.6, p=.5; N1: F2,34=.03, p=.97)
For probes, greater P1 response amplitudes were observed to X vs. Y cues in the AY-70 condition vs. greater Y vs. X amplitudes in other conditions, resulting in a significant probe-type * task (F2,34=10.2, p<.001). Although the probe-type * task * group interaction was marginally significant (F2,34=2.70, p=.08), this reflected a tendency for greater (rather than reduced) differential P1 modulation in patients vs. controls (Figure 6B).
Sequence effects: Larger N1 responses were observed to probe stimuli following A- than B- cues across both groups and all tasks, resulting in a significant main effect of preceding-cue type on (F1,35=36.9, p<.0001) (Figure 6A). The degree of N1 modulation was also significantly greater in the BX-70 vs. other task variants (Figure 6A) and to X than Y probes in the AY-70 task only, resulting in a significant preceding-cue * task (F2,34=13.2, p<.0001) and precedingcue* probe-type * task (F2,34=2.95, p=.001) interactions. Nevertheless, all interactions involving group were non-significant, suggesting similar modulation in patients vs. controls.
Latencies
In addition to being reduced in amplitude, both cue and probe potentials showed longer latencies in patients (cue: P1: F1,35=11.51, p=.002; N1: F1,35=12.94, p=.001; probe: P1: F3,33=15.69, p<.001; N1: F3,33=17.93, p<.001) (Figures 3,4).
C1
A weak C1 was also present over the central occipital region in both groups (mean: controls, −2.50±2.19μV; patients, −1.82±.97μV). As opposed to P1 and N1, peak C1 amplitudes were not statistically different between groups (F1,40=1.84, p=.18).
Cognitive potentials
N2
N2 was significant reduced in amplitude for both cue (F1,35=8.34, p=.007) and probe (F1,35=4.88, p=.034) stimuli in patients vs. controls across all conditions. Across groups, N2 was larger (more negative) to B-cues in the AX-70 condition, larger to A-cues in BX-70 and approximately equal to A- and B-cues in the AY-70 task (Figure 5C), leading to a highly significant cue-type * task interaction (F2,34=14.1, p<.0001). Patients showed significantly less difference in response to A- vs. B-cues, and significantly less modulation by task than controls, leading to a highly significant cue-type * task * group interaction (F2,34=14.1, p<.0001).
In response to probes, N2 was elicited primarily by AX sequences in the AY-70 condition, and AY trials in the AX-70 condition (Figure 6C), leading to a highly significant cue-type * probe-type effect (F1,35=24.1, p<.0001). Patients showed highly significant reductions in both conditions, leading to a highly significant probe-type * task * group interaction (F2,34=25.7, p<.0001).
CNV
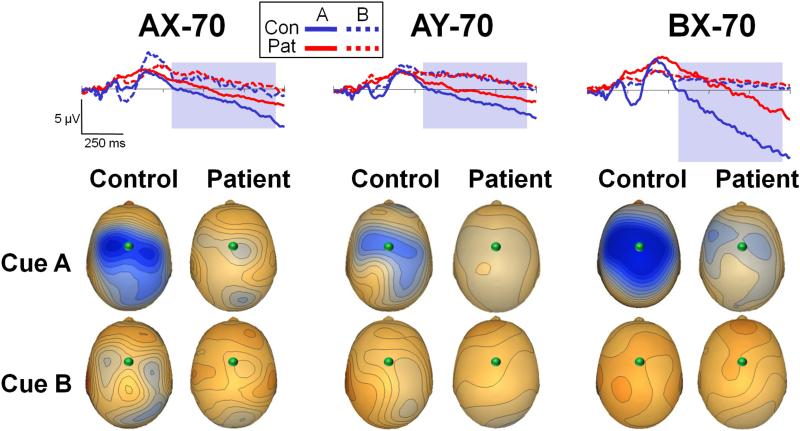
CNV was significantly reduced in patients across tasks and stimulus types (F1,35=8.56, p=.006). Across groups, CNV was observed primarily for A- vs. B-cues across task variants (F1,35=115.5, p<.0001). For A-cues, CNV was larger in BX-70 vs. other conditions, leading to a significant effect of task (F2,34=25.8, p<.0001) (Figures 7). The task X group interaction was significant (F2,34=5.34, p=.01), suggesting less modulation of CNV by task in patients vs. controls. Despite being reduced in amplitude in patients, the slope of the CNV showed a parallel time course across groups over the course of the cue-probe interval. The period 550-1200 ms from cue onset showed no group effect of slope (F1,35=1.74, p=.2) (for details see Online-only Materials).
Figure 7. Contingent negative variation (CNV) waveform in response to cue stimuli across task variants.
Waveforms reflect activity during the cue-trial interval. All spatial distributions shown at time 1248 ms, and with scale at 0.40 μV/step. Conventions as in Figure 3. The shaded rectangle represents the period used for the CNV slope analysis.
Intercorrelations among measures
ERP vs. performance
Primary analyses were performed using regression analysis vs. performance, as indexed by d’-context (Figure 8). A supplemental path analysis was performed as well to assess directional relations (eFigure 5).
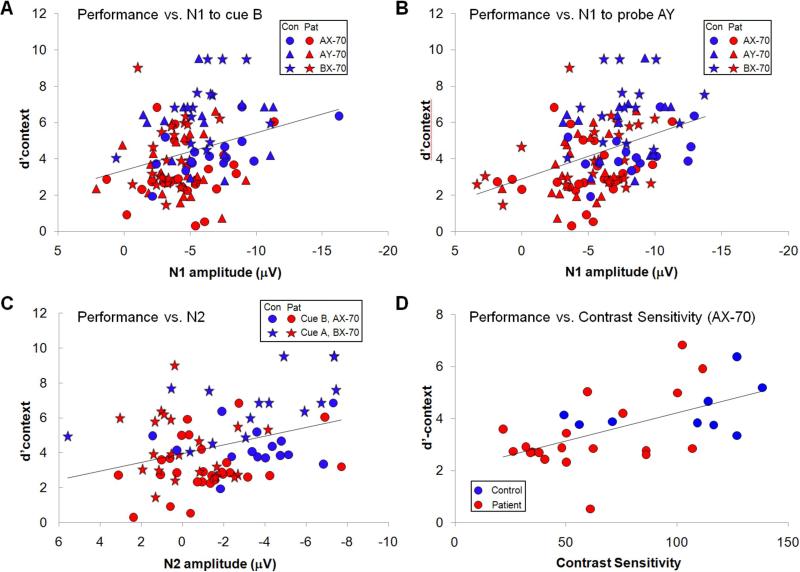
Figure 8. Correlations of performance (d’context).
A; Performance vs. N1 amplitude to Cue B; B: Performance vs N1 amplitude to probe AY; C: Performance vs. N2 to Cue B in task AX-70 and Cue A in task BX-70; D: Performance vs. contrast sensitivity in task AX-70.
Across task versions, N1 amplitude to B cues correlated significantly with performance (r=.28, n=116, p=.002) (Figure 8A), as did N1 amplitude to probe Y in sequence AY (r=.40, n=116, p<.0001) (Figure 8B), with larger N1 amplitudes correlating with better performance. The correlation for both B cues (r=.20, p=.030) and AY probes (r=.25, p=.007) remained significant even when controlled for task type and group membership.
In the AX-70 condition, N2 to B-cues correlated significantly with performance (r=.37, p=.017), while in the BX-70 condition, N2 to A-cues correlated with performance (r=.47, p=.004) (Figure 8C). However, neither correlation remained significant following consideration of group status (AX-70: r=.23, p=.11; BX-70: r=.19, p=.17). Furthermore, when variables were entered simultaneously vs. performance in the AX-70 condition, the contribution of N1 remained highly significant (r=.37, p=.004), whereas the contribution of N2 became marginal (r=.24, p=.053).
Path analysis showed a similar relationship, with both N1 and N2 contributing significantly to performance (Online-only Materials, eFigure 5). In addition, path analysis revealed a significant contribution of P1 to N2 amplitude, and group effects at the level of both P1 and N1. Because of the small sample size, however, these findings require replication in an independent sample.
Finally, across conditions there was a significant correlation between CNV amplitude to A cues and response latency (r=.23, p=.012), although the correlation was no longer significant once group status was considered (r=.08, p=.33).
Contrast sensitivity
Patients showed reduced contrast sensitivity at low (0.5cpd) spatial frequency vs. controls (F1,27=10.7, p=.003), but not at middle (F1,27=2.28, p=.14) or high (F1,27=2.08, p=.16), leading to a significant main effect of group (F1,27=11.3, p=.002) and a significant group * SF interaction (F2,26=5.49, p=.01). There was a significant correlation between contrast sensitivity and performance both across conditions (r=.62, p=.011) and in the AX-70 condition individually (r=.61, p=.0001) (Figure 8D). Both the overall (r=.53, p=.018) and AX-70 correlations (r=.42, p=.01) remained significant even when controlling for group status. Finally, the correlation was significant even in patients alone (r=.52, p=.02), and remained significant even when WAIS performance IQ was included in the regression to control for general cognitive dysfunction (r=.55, p=.017).
Comment
AX-CPT is a widely used task for evaluating the neural basis of working memory and executive processing deficits in schizophrenia14,18,19,48. Although reduced visual cortical activation has been observed across working memory/executive processing tasks in schizophrenia36 contributions of sensory dysfunction to impairment in such tasks has not been studied systematically. The present study used ERP to investigate neural bases of impaired AXCPT performance, focusing on both sensory and higher cognitive measures.
Primary findings are that patients showed reduced sensory responses along with reduced higher cortical activation. Furthermore, performance deficits correlated specifically with reduced ability to process low visual spatial frequency information, consistent with impaired magnocellular input7,33. Finally, significant task- and sequence-related modulation of sensory responses were observed in this study, reflecting potential top-down modulatory control of sensory responses. Notably, however, such modulations were not significantly reduced in patients despite the reduced amplitudes of the sensory responses themselves. Thus, these findings suggest that sensory deficits may be observed during cognitive tasks in schizophrenia even in the face of normal top-down cognitive control.
Behavioral findings
In the present study, patients showed significantly increased rates of AX errors and greater deficits in BX vs. AY errors relative to controls, suggesting a specific response pattern11,15,46. Furthermore, deficits were not limited to the most commonly used version of this task (i.e. AX-70), but were observed across task versions. These findings suggest that cognitive deficits in schizophrenia are not confined to those related to frontal response inhibition49.
Sensory effects
Sensory processing was assessed using two approaches. First, ERP were collected over visual regions in response to cue and probe stimuli and amplitudes of P1 and N1 visual components was analyzed. Second, patients were assessed using contrast sensitivity, which measures the ability of individuals to detect low contrast stimuli across a range of spatial frequencies.
Consistent with recent studies using other sensory and cognitive paradigms12,33,50, patients showed highly significant deficits in P1 and N1 generation. Generators of these components have been localized to middle occipital gyrus (MOG)13,35. Notably, reduced MOG activation was also observed in a recent meta-analysis of fMRI studies of executive processing in schizophrenia (including some which used the AX-CPT)36, supporting our finding of reduced sensory ERP response in this task. Selective reductions in MOG and medial prefrontal fMRI activation have also been reported following ketamine administration in normals, suggesting a potential link to underlying NMDA dysfunction51.
In prior studies involving psychophysically precise stimuli (sine wave gratings), we have found preferential P1 reduction to low vs. high SF stimuli, consistent with preferential magnocellular vs. parvocellular visual system impairment7. In the present study, psychophysically complex stimuli (letters) were used so exact SFs could not be determined. However, readers in general use a frequency band of approximately 3 cycles/letter52,53, suggesting that the main frequency band for letter evaluation in this task was likely centered around 1.5 cycle/deg. This frequency band is within the range of prominent magnocellular sensitivity54, suggesting that the key stimulus-related information may have been contained within a preferential magnocellular SF band. Furthermore, performance deficits in patients correlated significantly with both reduced N1 sensory response (Figure 8A,B) and impaired contrast sensitivity to low-, but not high-, SF stimuli (Figure 8D), suggesting a significant contribution of impaired sensory processing to impaired behavioral performance in schizophrenia.
Cognitive components
The present study also analyzed generation of two cognitive potentials, N2 and CNV, that have been shown to reflect activity within prefrontal cortex (MPC and DLPFC) based upon human dipole mapping studies17,55 and direct intracranial recordings in primates34. These regions show consistently reduced activation in fMRI studies of AX-CPT in schizophrenia18,56, consistent with our present findings.
No significant correlation was observed with response accuracy (d’-context) for either N2 or CNV, suggesting that impaired function of these regions may not be directly linked to the most prominent behavioral impairment observed on this task. Nevertheless, the present findings suggest that prefrontal regions may contribute to two alternative AX-CPT-related processes, indexed by the distinct N2 and CNV ERP components.
First, N2 was larger to B cues in the AX-70 task variant and to A cues in the BX-70 variant, and thus may index conflict between the local and global prepotency17. In a recent fMRI study of AX-CPT using the AX-70 task version, reduced frontal activation was not related to overall accuracy, but only to type of error (BX vs. AX)56. Given the larger N2 response to the less frequent B vs. A cues in the AX-70 task variant but to the less frequent A vs. B cues in the BX-70 task variant, reduced frontal activation during AX-CPT in schizophrenia may thus reflect, at least in part, reduced conflict processing, as has been reported in other response inhibition tasks57, 58. The conflict monitoring role of N2 was underscored in this study by the fact that large N2 responses were also observed to AY sequences in the AX-70 paradigm. Notably, however, patients had no increase in AY false alarms, underscoring the separability of frontal activation vs. performance.
Second, CNV amplitude was maintained throughout the cue-probe interval and varied across tasks with the conditional probability of a response, consistent with a role in maintenance of response bias across delay59,60. The fact that CNV was significantly reduced in amplitude to cue stimuli in patients, but nevertheless showed a parallel timecourse in patients vs. controls during the cue-probe interval is consistent with the increasing suggestion over recent years that working memory deficits are associated with impairments in stimulus encoding11,19,27,48,61 rather than memory retention46. Furthermore, the present study suggests that ERP, because of their high temporal resolution, may be more sensitive than fMRI to differential evaluation of encoding vs. retention subcomponents during working memory tasks, and thus may offer complementary information.
Top-down modulation
Although the present study was not designed a priori to evaluate top-down modulations of sensory response, nevertheless three apparent examples of top-down modulation were observed. First, in the BX-70 condition (vs. other conditions), subjects showed larger sensory ERP responses to A vs. B cues (Figure 5). Second, in the AY-70 task variant (vs. other variants), subjects showed larger amplitude responses to X vs. Y probes (Figure 6). Third, N1 was larger to all probe stimuli following A vs. B cues across tasks. These context-related modulations permitted post-hoc assessment of integrity of top-down control of sensory processing during this task in schizophrenia.
In the first two cases, the stimuli “enhanced” by these modulations were relatively infrequent, and therefore highly informative regarding response selection. Modulation of P1 and N1 by expectation has been reported previously62. In the present study, no significant differences were observed in the degree of task-related modulation of either cue or probe responses between patients and controls, suggesting similar top-down effects across group.
In the case of probe N1 modulation by prior cue type, subjects must attend to the subsequent probe following valid cues to determine the correct response, whereas this is not true following invalid cues (i.e. AX and AY sequences require different behavioral responses, whereas BX and BY sequences both require the same response). Thus, a greater degree of attention may be required following valid vs. invalid cues and may result in increased N1 amplitude. The similar degree of N1 modulation as a function of prior cue in patients vs. controls despite the overall reduction in N1 amplitude (Figure 6) thus also suggests relatively intact top-down attentional control mechanisms despite impaired bottom-up sensory activation.
Overall models of cognitive dysfunction
Working memory deficits in schizophrenia were, at one point, considered to reflect impairments in retention of information across delay, consistent with local dysfunction within prefrontal brain regions. Over recent years, however, behavioral studies have increasingly shown that performance deficits in AX-CPT and other working memory tasks reflect primarily a failure of encoding, with limited, if any, deficit in retention11,27. The present study amplifies this finding and highlights the role of sensory dysfunction as a basis for encoding dysfunction. Moreover, although top-down modulations of sensory processing were observed in this paradigm, they were not significantly different between patients and controls, supporting bottom-up models.
Within the auditory system, deficits in low-level auditory processing have increasingly been shown to contribute to deficits in higher order processing such as emotion recognition63 and P3 generation64. The present study suggests that a similar relationship may also hold in the visual system in schizophrenia. Thus, while impairments in frontal function and top-down processing undoubtedly occur, sensory deficits and bottom-up influences on cognition in schizophrenia must also be considered.
Supplementary Material
Acknowledgements
The authors would like to thank Dr. Stephan Bickel for comments on the paper and Jeanette Piesco for technical assistance. All authors declare that they have no conflicts of interest. This project was supported by grants R37MH49334 and P50MH086385 to DCJ.
Footnotes
Part of the data in this paper has been previously shown in the following meetings:
American College of Neuropsychopharmacology Annual Meeting. Hollywood, FL., 2009. 15th International Congress on Event-Related Potentials of the Brain (XV EPIC). Bloomington, IN., 2009
References
- 1.Carter CS, Barch DM, Buchanan RW, Bullmore E, Krystal JH, Cohen J, Geyer M, Green M, Nuechterlein KH, Robbins T, Silverstein S, Smith EE, Strauss M, Wykes T, Heinssen R. Identifying cognitive mechanisms targeted for treatment development in schizophrenia: an overview of the first meeting of the Cognitive Neuroscience Treatment Research to Improve Cognition in Schizophrenia Initiative. Biological psychiatry. 2008;64(1):4–10. doi: 10.1016/j.biopsych.2008.03.020. [DOI] [PMC free article] [PubMed] [Google Scholar]
- 2.Green MF. Cognitive impairment and functional outcome in schizophrenia and bipolar disorder. The Journal of clinical psychiatry. 2006;67(10):e12. [PubMed] [Google Scholar]
- 3.Butler PD, Zemon V, Schechter I, Saperstein AM, Hoptman MJ, Lim KO, Revheim N, Silipo G, Javitt DC. Early-stage visual processing and cortical amplification deficits in schizophrenia. Archives of general psychiatry. 2005;62(5):495–504. doi: 10.1001/archpsyc.62.5.495. [DOI] [PMC free article] [PubMed] [Google Scholar]
- 4.Martinez A, Hillyard SA, Dias EC, Hagler DJ, Jr., Butler PD, Guilfoyle DN, Jalbrzikowski M, Silipo G, Javitt DC. Magnocellular pathway impairment in schizophrenia: evidence from functional magnetic resonance imaging. J Neurosci. 2008;28(30):7492–7500. doi: 10.1523/JNEUROSCI.1852-08.2008. [DOI] [PMC free article] [PubMed] [Google Scholar]
- 5.Green MF, Lee J, Cohen MS, Engel SA, Korb AS, Nuechterlein KH, Wynn JK, Glahn DC. Functional neuroanatomy of visual masking deficits in schizophrenia. Archives of general psychiatry. 2009;66(12):1295–1303. doi: 10.1001/archgenpsychiatry.2009.132. [DOI] [PMC free article] [PubMed] [Google Scholar]
- 6.Wible CG, Kubicki M, Yoo SS, Kacher DF, Salisbury DF, Anderson MC, Shenton ME, Hirayasu Y, Kikinis R, Jolesz FA, McCarley RW. A functional magnetic resonance imaging study of auditory mismatch in schizophrenia. The American journal of psychiatry. 2001;158(6):938–943. doi: 10.1176/appi.ajp.158.6.938. [DOI] [PMC free article] [PubMed] [Google Scholar]
- 7.Butler PD, Schechter I, Zemon V, Schwartz SG, Greenstein VC, Gordon J, Schroeder CE, Javitt DC. Dysfunction of early-stage visual processing in schizophrenia. The American journal of psychiatry. 2001;158(7):1126–1133. doi: 10.1176/appi.ajp.158.7.1126. [DOI] [PubMed] [Google Scholar]
- 8.Schechter I, Butler PD, Silipo G, Zemon V, Javitt DC. Magnocellular and parvocellular contributions to backward masking dysfunction in schizophrenia. Schizophrenia research. 2003;64(2-3):91–101. doi: 10.1016/s0920-9964(03)00008-2. [DOI] [PubMed] [Google Scholar]
- 9.Butler PD, Martinez A, Foxe JJ, Kim D, Zemon V, Silipo G, Mahoney J, Shpaner M, Jalbrzikowski M, Javitt DC. Subcortical visual dysfunction in schizophrenia drives secondary cortical impairments. Brain. 2007;130(Pt 2):417–430. doi: 10.1093/brain/awl233. [DOI] [PMC free article] [PubMed] [Google Scholar]
- 10.Javitt DC, Liederman E, Cienfuegos A, Shelley AM. Panmodal processing imprecision as a basis for dysfunction of transient memory storage systems in schizophrenia. Schizophrenia bulletin. 1999;25(4):763–775. doi: 10.1093/oxfordjournals.schbul.a033417. [DOI] [PubMed] [Google Scholar]
- 11.Javitt DC, Shelley AM, Silipo G, Lieberman JA. Deficits in auditory and visual context-dependent processing in schizophrenia: defining the pattern. Archives of general psychiatry. 2000;57(12):1131–1137. doi: 10.1001/archpsyc.57.12.1131. [DOI] [PubMed] [Google Scholar]
- 12.Butler PD, Abeles IY, Weiskopf NG, Tambini A, Jalbrzikowski M, Legatt ME, Zemon V, Loughead J, Gur RC, Javitt DC. Sensory contributions to impaired emotion processing in schizophrenia. Schizophrenia bulletin. 2009;35(6):1095–1107. doi: 10.1093/schbul/sbp109. [DOI] [PMC free article] [PubMed] [Google Scholar]
- 13.Haenschel C, Bittner RA, Haertling F, Rotarska-Jagiela A, Maurer K, Singer W, Linden DE. Contribution of impaired early-stage visual processing to working memory dysfunction in adolescents with schizophrenia: a study with event-related potentials and functional magnetic resonance imaging. Archives of general psychiatry. 2007;64(11):1229–1240. doi: 10.1001/archpsyc.64.11.1229. [DOI] [PubMed] [Google Scholar]
- 14.Rosvold HE, Mirsky AF, Sarason I, Bransome ED, Beck LH. A continuous performance test of brain damage. J Consult Psychol. 1956;20:343–350. doi: 10.1037/h0043220. [DOI] [PubMed] [Google Scholar]
- 15.Servan-Schreiber D, Cohen JD, Steingard S. Schizophrenic deficits in the processing of context. A test of a theoretical model. Archives of general psychiatry. 1996;53(12):1105–1112. doi: 10.1001/archpsyc.1996.01830120037008. [DOI] [PubMed] [Google Scholar]
- 16.Cohen JD, Braver TS, O'Reilly RC. A computational approach to prefrontal cortex, cognitive control and schizophrenia: recent developments and current challenges. Philos Trans R Soc Lond B Biol Sci. 1996;351(1346):1515–1527. doi: 10.1098/rstb.1996.0138. [DOI] [PubMed] [Google Scholar]
- 17.Dias EC, Foxe JJ, Javitt DC. Changing plans: a high density electrical mapping study of cortical control. Cereb Cortex. 2003;13(7):701–715. doi: 10.1093/cercor/13.7.701. [DOI] [PubMed] [Google Scholar]
- 18.Barch DM, Carter CS, Braver TS, Sabb FW, MacDonald A, 3rd, Noll DC, Cohen JD. Selective deficits in prefrontal cortex function in medication-naive patients with schizophrenia. Archives of general psychiatry. 2001;58(3):280–288. doi: 10.1001/archpsyc.58.3.280. [DOI] [PubMed] [Google Scholar]
- 19.Javitt DC, Rabinowicz E, Silipo G, Dias EC. Encoding vs. retention: differential effects of cue manipulation on working memory performance in schizophrenia. Schizophrenia research. 2007;91(1-3):159–168. doi: 10.1016/j.schres.2006.11.024. [DOI] [PMC free article] [PubMed] [Google Scholar]
- 20.Umbricht D, Schmid L, Koller R, Vollenweider FX, Hell D, Javitt DC. Ketamine-induced deficits in auditory and visual context-dependent processing in healthy volunteers: implications for models of cognitive deficits in schizophrenia. Archives of general psychiatry. 2000;57(12):1139–1147. doi: 10.1001/archpsyc.57.12.1139. [DOI] [PubMed] [Google Scholar]
- 21.Snitz BE, Macdonald AW, 3rd, Carter CS. Cognitive deficits in unaffected first-degree relatives of schizophrenia patients: a meta-analytic review of putative endophenotypes. Schizophrenia bulletin. 2006;32(1):179–194. doi: 10.1093/schbul/sbi048. [DOI] [PMC free article] [PubMed] [Google Scholar]
- 22.MacDonald AW., 3rd Building a clinically relevant cognitive task: case study of the AX paradigm. Schizophrenia bulletin. 2008;34(4):619–628. doi: 10.1093/schbul/sbn038. [DOI] [PMC free article] [PubMed] [Google Scholar]
- 23.MacDonald AW, 3rd, Thermenos HW, Barch DM, Seidman LJ. Imaging genetic liability to schizophrenia: systematic review of FMRI studies of patients' nonpsychotic relatives. Schizophrenia bulletin. 2009;35(6):1142–1162. doi: 10.1093/schbul/sbn053. [DOI] [PMC free article] [PubMed] [Google Scholar]
- 24.Cohen JD, Servan-Schreiber D. Context, cortex, and dopamine: a connectionist approach to behavior and biology in schizophrenia. Psychol Rev. 1992;99(1):45–77. doi: 10.1037/0033-295x.99.1.45. [DOI] [PubMed] [Google Scholar]
- 25.Braver TS, Barch DM, Cohen JD. Cognition and control in schizophrenia: a computational model of dopamine and prefrontal function. Biological psychiatry. 1999;46(3):312–328. doi: 10.1016/s0006-3223(99)00116-x. [DOI] [PubMed] [Google Scholar]
- 26.MacDonald AW, 3rd, Carter CS. Event-related FMRI study of context processing in dorsolateral prefrontal cortex of patients with schizophrenia. J Abnorm Psychol. 2003;112(4):689–697. doi: 10.1037/0021-843X.112.4.689. [DOI] [PubMed] [Google Scholar]
- 27.Lee J, Park S. Working memory impairments in schizophrenia: a meta-analysis. J Abnorm Psychol. 2005;114(4):599–611. doi: 10.1037/0021-843X.114.4.599. [DOI] [PubMed] [Google Scholar]
- 28.Gold JM, Hahn B, Zhang WW, Robinson BM, Kappenman ES, Beck VM, Luck SJ. Reduced capacity but spared precision and maintenance of working memory representations in schizophrenia. Archives of general psychiatry. 2010;67(6):570–577. doi: 10.1001/archgenpsychiatry.2010.65. [DOI] [PMC free article] [PubMed] [Google Scholar]
- 29.Coyle JT. Glutamate and schizophrenia: beyond the dopamine hypothesis. Cell Mol Neurobiol. 2006;26(4-6):365–384. doi: 10.1007/s10571-006-9062-8. [DOI] [PMC free article] [PubMed] [Google Scholar]
- 30.Javitt DC. Glutamate and Schizophrenia: Phencyclidine, N-Methyl-d-Aspartate Receptors, and Dopamine-Glutamate Interactions. International review of neurobiology. 2007;78:69–108. doi: 10.1016/S0074-7742(06)78003-5. [DOI] [PubMed] [Google Scholar]
- 31.Lewis DA, Moghaddam B. Cognitive dysfunction in schizophrenia: convergence of gamma-aminobutyric acid and glutamate alterations. Archives of neurology. 2006;63(10):1372–1376. doi: 10.1001/archneur.63.10.1372. [DOI] [PubMed] [Google Scholar]
- 32.Bar M, Kassam KS, Ghuman AS, Boshyan J, Schmid AM, Dale AM, Hamalainen MS, Marinkovic K, Schacter DL, Rosen BR, Halgren E. Top-down facilitation of visual recognition. Proc Natl Acad Sci U S A. 2006;103(2):449–454. doi: 10.1073/pnas.0507062103. [DOI] [PMC free article] [PubMed] [Google Scholar]
- 33.Sehatpour P, Dias EC, Butler PD, Revheim N, Guilfoyle DN, Foxe JJ, Javitt DC. Impaired visual object processing across an occipital-frontal-hippocampal brain network in schizophrenia: an integrated neuroimaging study. Archives of general psychiatry. 2010;67(8):772–782. doi: 10.1001/archgenpsychiatry.2010.85. [DOI] [PMC free article] [PubMed] [Google Scholar]
- 34.Dias EC, McGinnis T, Smiley JF, Foxe JJ, Schroeder CE, Javitt DC. Changing plans: neural correlates of executive control in monkey and human frontal cortex. Exp Brain Res. 2006;174(2):279–291. doi: 10.1007/s00221-006-0444-4. [DOI] [PubMed] [Google Scholar]
- 35.Di Russo F, Martinez A, Sereno MI, Pitzalis S, Hillyard SA. Cortical sources of the early components of the visual evoked potential. Human brain mapping. 2001;15(2):95–111. doi: 10.1002/hbm.10010. [DOI] [PMC free article] [PubMed] [Google Scholar]
- 36.Minzenberg MJ, Laird AR, Thelen S, Carter CS, Glahn DC. Meta-analysis of 41 functional neuroimaging studies of executive function in schizophrenia. Archives of general psychiatry. 2009;66(8):811–822. doi: 10.1001/archgenpsychiatry.2009.91. [DOI] [PMC free article] [PubMed] [Google Scholar]
- 37.First M, M G, RL S, Williams J, LS B. Structured Clinical Interview for DSM-IV Axis II Personality Disorders, (SCID-II) American Psychiatric Press, Inc.; Washington, D.C.: 1997. [Google Scholar]
- 38.Woods SW. Chlorpromazine equivalent doses for the newer atypical antipsychotics. The Journal of clinical psychiatry. 2003;64(6):663–667. doi: 10.4088/jcp.v64n0607. [DOI] [PubMed] [Google Scholar]
- 39.Butler PD, Hoptman MJ, Nierenberg J, Foxe JJ, Javitt DC, Lim KO. Visual white matter integrity in schizophrenia. The American journal of psychiatry. 2006;163(11):2011–2013. doi: 10.1176/appi.ajp.163.11.2011. [DOI] [PMC free article] [PubMed] [Google Scholar]
- 40.Loeb P. ILS: Independent living scales manual. The Psychological Corporation, Hartcout Race Jonanovich, Inc.; San Antonio: 1996. [Google Scholar]
- 41.Overall J, Gorham D. The brief psychiatric rating scale. Psychol Rep. 1962;10:799–812. [Google Scholar]
- 42.Hollingshead AB. Four Factor Index of Social Status. Yale University Department of Sociology; New Haven, CT: 1975. [Google Scholar]
- 43.Ammons R, Ammons C. The Quick Test (QT): provisional manual. Psychological Report. 1962;11:111–162. [Google Scholar]
- 44.Andreasen NC. The scale for the assessment of negative symptoms (SANS) The University of Iowa; Iowa City, IA: 1984. [Google Scholar]
- 45.Swets JA, Sewall ST. Invariance of signal detectability over stages of practice and levels of motivation. J Exp Psychol. 1963;66:120–126. [Google Scholar]
- 46.Barch DM, Carter CS, MacDonald AW, 3rd, Braver TS, Cohen JD. Context-processing deficits in schizophrenia: diagnostic specificity, 4-week course, and relationships to clinical symptoms. J Abnorm Psychol. 2003;112(1):132–143. [PubMed] [Google Scholar]
- 47.Cohen J. Statistical Power Analysis for the Behavioral Sciences 2nd edition ed. Lawrence Erlbaum Associates; Hillsdale, NJ: 1988. [Google Scholar]
- 48.Perlstein WM, Dixit NK, Carter CS, Noll DC, Cohen JD. Prefrontal cortex dysfunction mediates deficits in working memory and prepotent responding in schizophrenia. Biological psychiatry. 2003;53(1):25–38. doi: 10.1016/s0006-3223(02)01675-x. [DOI] [PubMed] [Google Scholar]
- 49.Kiehl KA, Smith AM, Hare RD, Liddle PF. An event-related potential investigation of response inhibition in schizophrenia and psychopathy. Biological psychiatry. 2000;48(3):210–221. doi: 10.1016/s0006-3223(00)00834-9. [DOI] [PubMed] [Google Scholar]
- 50.Yeap S, Kelly SP, Sehatpour P, Magno E, Javitt DC, Garavan H, Thakore JH, Foxe JJ. Early visual sensory deficits as endophenotypes for schizophrenia: high-density electrical mapping in clinically unaffected first-degree relatives. Archives of general psychiatry. 2006;63(11):1180–1188. doi: 10.1001/archpsyc.63.11.1180. [DOI] [PubMed] [Google Scholar]
- 51.Abel KM, Allin MP, Kucharska-Pietura K, Andrew C, Williams S, David AS, Phillips ML. Ketamine and fMRI BOLD signal: distinguishing between effects mediated by change in blood flow versus change in cognitive state. Human brain mapping. 2003;18(2):135–145. doi: 10.1002/hbm.10064. [DOI] [PMC free article] [PubMed] [Google Scholar]
- 52.Solomon JA, Pelli DG. The visual filter mediating letter identification. Nature. 1994;369(6479):395–397. doi: 10.1038/369395a0. [DOI] [PubMed] [Google Scholar]
- 53.Majaj NJ, Pelli DG, Kurshan P, Palomares M. The role of spatial frequency channels in letter identification. Vision Res. 2002;42(9):1165–1184. doi: 10.1016/s0042-6989(02)00045-7. [DOI] [PubMed] [Google Scholar]
- 54.Merigan WH, Maunsell JH. How parallel are the primate visual pathways? Annu Rev Neurosci. 1993;16:369–402. doi: 10.1146/annurev.ne.16.030193.002101. [DOI] [PubMed] [Google Scholar]
- 55.Bekker EM, Kenemans JL, Verbaten MN. Source analysis of the N2 in a cued Go/NoGo task. Brain Res Cogn Brain Res. 2005;22(2):221–231. doi: 10.1016/j.cogbrainres.2004.08.011. [DOI] [PubMed] [Google Scholar]
- 56.Yoon JH, Minzenberg MJ, Ursu S, Ryan Walter BS, Wendelken C, Ragland JD, Carter CS. Association of dorsolateral prefrontal cortex dysfunction with disrupted coordinated brain activity in schizophrenia: relationship with impaired cognition, behavioral disorganization, and global function. The American journal of psychiatry. 2008;165(8):1006–1014. doi: 10.1176/appi.ajp.2008.07060945. [DOI] [PMC free article] [PubMed] [Google Scholar]
- 57.Laurens KR, Ngan ET, Bates AT, Kiehl KA, Liddle PF. Rostral anterior cingulate cortex dysfunction during error processing in schizophrenia. Brain. 2003;126(Pt 3):610–622. doi: 10.1093/brain/awg056. [DOI] [PubMed] [Google Scholar]
- 58.Mathalon DH, Jorgensen KW, Roach BJ, Ford JM. Error detection failures in schizophrenia: ERPs and FMRI. Int J Psychophysiol. 2009;73(2):109–117. doi: 10.1016/j.ijpsycho.2009.02.005. [DOI] [PMC free article] [PubMed] [Google Scholar]
- 59.Walter W, Cooper R, Aldridge V, McCallum W, Winter A. Contingent negative variation: an electrical sign of sensorimotor association and expectancy in the human brain. Nature. 1964;203:380–384. doi: 10.1038/203380a0. [DOI] [PubMed] [Google Scholar]
- 60.Praamstra P. Electrophysiological markers of foreperiod effects. In: Nobre AC, Coull JT, editors. Attention and Time. Oxford University Press; Oxford: 2010. pp. 331–344. [Google Scholar]
- 61.Cohen JD, Barch DM, Carter C, Servan-Schreiber D. Context-processing deficits in schizophrenia: converging evidence from three theoretically motivated cognitive tasks. J Abnorm Psychol. 1999;108(1):120–133. doi: 10.1037//0021-843x.108.1.120. [DOI] [PubMed] [Google Scholar]
- 62.Scerif G, Worden MS, Davidson M, Seiger L, Casey BJ. Context modulates early stimulus processing when resolving stimulus-response conflict. Journal of cognitive neuroscience. 2006;18(5):781–792. doi: 10.1162/jocn.2006.18.5.781. [DOI] [PubMed] [Google Scholar]
- 63.Leitman DI, Hoptman MJ, Foxe JJ, Saccente E, Wylie GR, Nierenberg J, Jalbrzikowski M, Lim KO, Javitt DC. The neural substrates of impaired prosodic detection in schizophrenia and its sensorial antecedents. The American journal of psychiatry. 2007;164(3):474–482. doi: 10.1176/ajp.2007.164.3.474. [DOI] [PubMed] [Google Scholar]
- 64.Leitman DI, Sehatpour P, Higgins BA, Foxe JJ, Silipo G, Javitt DC. Sensory deficits and distributed hierarchical dysfunction in schizophrenia. The American journal of psychiatry. 2010;167(7):818–827. doi: 10.1176/appi.ajp.2010.09030338. [DOI] [PubMed] [Google Scholar]
Associated Data
This section collects any data citations, data availability statements, or supplementary materials included in this article.


