

Abstract
Introduction
Directional connectivity from anterior to posterior brain regions (or “feedback” connectivity) has been shown to be inhibited by the gamma-aminobutyric acid agonists propofol and sevoflurane. In this study we tested the hypothesis that ketamine would also inhibit cortical feedback connectivity in frontoparietal networks.
Methods
Surgical patients (n=30) were recruited for induction of anesthesia with intravenous ketamine (2mg/kg); electroencephalography of the frontal and parietal regions was acquired. We used normalized symbolic transfer entropy, a computational method based in information theory, to measure directional connectivity across frontal and parietal regions. Statistical analysis of transfer entropy measures was performed with the permutation test and the time shift test to exclude false positive connectivity. For comparison, we used normalized symbolic transfer entropy to reanalyze electroencephalographic data gathered from surgical patients receiving either propofol (n=9) or sevoflurane (n=9) for anesthetic induction.
Results
Ketamine reduced alpha power and increased gamma power, in contrast to both propofol and sevoflurane. During administration of ketamine, feedback connectivity gradually diminished and was significantly inhibited after loss of consciousness (Mean±SD of baseline & anesthesia: 0.0074±0.003 & 0.0055±0.0027, F(5,179)= 7.785, p<0.0001). By contrast, feedforward connectivity was preserved during exposure to ketamine (Mean±SD of baseline & anesthesia: 0.0041±0.0015 & 0.0046±0.0018, F(5,179)=2.07, p=0.072). Like ketamine, propofol and sevoflurane selectively inhibited feedback connectivity after anesthetic induction.
Conclusions
Three major classes of anesthetics disrupt frontal-parietal communication, despite molecular and neurophysiologic differences. Analysis of directional connectivity in frontal-parietal networks could provide a common metric of general anesthesia and insight into the cognitive neuroscience of anesthetic-induced unconsciousness.
Introduction
Ketamine is a phencyclidine analog that is used to induce “dissociative anesthesia” and belongs to a class of anesthetics including nitrous oxide that do not act via the potentiation of γ-aminobutyric acid (GABA).1–3 Studies of anesthetic-induced unconsciousness have consistently failed to identify common mechanisms of both GABAergic and non-GABAergic anesthetics, which are distinct at both the molecular and neurophysiologic level. Identifying a common neural correlate of anesthetic-induced unconsciousness would be an important advance for the mechanistic study of consciousness and general anesthesia, and could facilitate the development of more sophisticated brain monitors for surgical patients.
Information feedback from the frontal cortex to other cortical regions has been referred to as “feedback” or recurrent processing and is thought to mediate conscious experience.4,5 In contrast, feedforward information flow in the posterior-to-anterior direction is thought to mediate sensory processing, which can occur outside of consciousness.6,7 There is emerging evidence for disrupted feedback and preserved feedforward processing in patients with persistent vegetative states8 as well as anesthetized rats.9,10 We previously demonstrated that frontal-to-parietal feedback connectivity significantly exceeds feedforward connectivity in conscious humans and that this feedback dominance is attenuated by the GABAergic anesthetics propofol and sevoflurane.11,12 In the present study, we use electroencephalography and normalized symbolic transfer entropy (NSTE) to assess directional connectivity across the frontal, parietal and temporal regions of human surgical patients. Based on this analysis we demonstrate that drugs from three major classes of anesthetics selectively disrupt feedback communication. This finding supports the hypothesis that feedback connectivity and frontoparietal networks play an important role in consciousness and provide evidence for a common neurobiology of anesthetic-induced unconsciousness.
Materials and Methods
In brief, 30 surgical patients were anesthetized with ketamine (2mg/kg intravenous infusion) while recording 8-channel electroencephalography of frontal, parietal and temporal regions. NSTE is a model-free, non-linear measure of the causal relationship between two signals and can be used to infer directed functional connectivity.13–17 NSTE between frontal and parietal or frontal and temporal regions was calculated for patients in the conscious state and after induction of anesthesia with ketamine. We also reanalyzed electroencephalographic data from surgical patients anesthetized with the intravenous anesthetic propofol (n=9) or the inhaled anesthetic sevoflurane (n=9),12 in order to compare directly the spectral changes and NSTE with that of ketamine. For the purpose of statistical analysis, the electroencephalogram time series during baseline consciousness and anesthetic-induced unconsciousness was divided into three equal epochs for each state, resulting in six substates (Baseline-B1, B2, B3; Anesthetized-A1, A2, A3).
Ketamine experiments
Participants: ketamine experiments
The study was approved by the Institutional Review Board of Asan Medical Center (Seoul, South Korea) and written informed consent was obtained in all cases; electroencephalographic data were gathered at Asan Medical Center and analyzed at the University of Michigan Medical School (Ann Arbor, MI). Patients scheduled for elective stomach, colorectal, thyroid or breast surgery (n = 30, male/female = 15/15, American Society Anesthesiologists Physical Status 1 or 2, age 22–64 years) were enrolled in this study. Exclusion criteria included previous cardiovascular disease (including hypertension), a previous brain surgery, a history of drug or alcohol dependence, known neurological or psychiatric disorders, or current use of psychotropic medications.
Anesthetic procedures: ketamine
Patients received no sedatives or other medications before induction of anesthesia and were monitored with electrocardiography, pulse oximetry, end-tidal carbon dioxide concentration and noninvasive blood pressure measurement. Ketamine (2 mg/kg diluted in 10 ml of 0.9% normal saline) was infused over 2 min (Baxter infusion pumpAS40A, Baxter healthcare corporation, Deerfield, IL). We assessed noninvasive blood pressure every 30 s during ketamine infusion and administered 5–10 mg labetalol if systolic blood pressure was increased 30% higher than baseline blood pressure. Time to loss of consciousness was determined by checking every 10 s for the loss of response to verbal command (“squeeze your right hand twice”). Electroencephalographic and electromyographic data were acquired until 5 min after loss of consciousness. At the end of the study, patients received an effect-site target concentration (2.5μg/ml) of propofol in combination with an effect-site target concentration (5 ng/ml) of remifentanil.
Participants : propofol and sevoflurane experiments
These data were originally gathered for a prior study of the frontal-parietal system, although NSTE was not applied for the original analysis. Eighteen patients scheduled for elective abdominal or breast surgery (n=18, male/female=8/10, American Society Anesthesiologists Physical Status I and II, age 29–66 years) were enrolled in the study. Propofol (n=9) or sevoflurane (n=9) was administered to induce general anesthesia while eight-channel electroencephalogram was recorded. Propofol (Diprivan, AstraZeneca, London, England), was initially administered with a target controlled infusion of 2.0 μg/ml and was increased at a rate 1.0 μg/ml per 20 s until loss of consciousness. Sevoflurane (Sevorane, Abbott, Illinois), was initially administered as 2 vol% and increased at a rate of 2 vol % per 20 s until loss of consciousness; see Ku et al (2011)12 for experimental details.
Electroencephalogram and physiologic data acquisition for the three anesthetics
In all experiments, the electroencephalogram was recorded at eight monopolar channels in the frontal, parietal and temporal regions (Fp1, Fp2, F3, F4, T3, T4, P3 and P4 referenced by A2, which followed the international 10–20 system for electrode placement) by a WEEG-32 (LXE3232-RF, Laxtha Inc., Daejeon, Korea) with a sampling frequency of 256 Hz. The electrode impedance was kept below 5 KΩ. Band pass filtering with the fifth-order Butterworth filter was applied to electroencephalographic data (forward and backward), correcting the phase shifting after band-pass filtering (“butterworth.m” and “filtfilt.m” in Matlab Signal Processing Toolbox, MathWorks, Natick, MA). Electromyography was concurrently recorded at four bipolar channels (bilateral frontalis and temporalis muscles) by a QEMG-4 (Laxtha Inc.) with a sampling frequency of 1,024 Hz.
Analysis of Directional Connectivity
Transfer entropy (TE) offers a nonlinear and model-free estimation of directed functional connectivity based on information theory, quantifying the degree of dependence of Y on X or vice-versa.16,17 The TE can be defined as the amount of mutual information between the past of X (XP), and the future of Y (YF) when the past of (YP) is already known, i.e.
| (1) |
where H(YF|YP) is the entropy of the process YF conditional on its past.
The distributions of XP,YP and YF can be written explicitly as
| (2) |
| (3) |
Equation (3) shows that TE represents the amount of information provided by the additional knowledge of the past of X in the model describing the information between the past and the future of Y. One disadvantage of TE is the subjective decision for the bin size in the probability calculation in equation (2). To avoid this problem, symbolic transfer entropy (STE) can be used. In STE, each vector for YF,XP and YP in equation (2) is a symbolized vector point. For instance, a vector Yt consists of the ranks of its components Yt = [y1, y2,…,ym], where yj=yt−m×(j−1)τ is replaced with the rank in ascending order, yj ε [1,2,…,m] for j =1, 2,…, m. Here m is the embedding dimension and τ is the time delay.
STE is defined in the same way as equation (2), but replacing the embedded vector points with the symbolized vector points. In comparison with TE, STE is a more robust and computationally efficient method.16,18 A schematic illustrating the principles of transfer entropy is presented in Figure 1.
Figure 1.
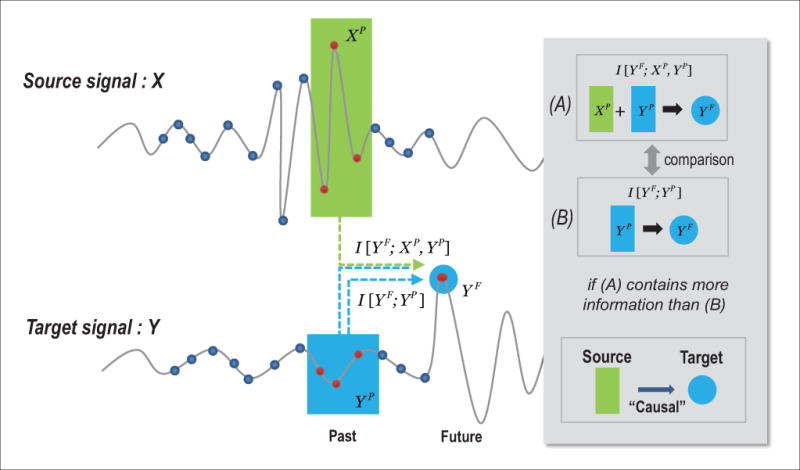
Schematic illustration of transfer entropy. Symbolic transfer entropy measures the causal influence of source signal X on target signal Y, and is based on information theory. The information transfer from signal X to Y is measured by the difference of two mutual information values, I[YF; XP, YP] and I[YF; YP], where XP, YP and YFare, respectively, the past of source and target signals and the future of target signal. The difference corresponds to information transferred from the past of source signal XP to the future of target signal YFand not from the past of the target signal itself. The average overall vector points measures the information transferred from the source signal to the target signal. The vector points are symbolized with the rank of their components: ex) a vector point (30,78,51) is symbolized to (1,3,2) with the rank of components in ascending order.
Bias and normalization of STE
To remove the bias of STE for a given electroencephalographic dataset, the shuffled data method was used.19 The shuffled data retain the same signal characteristics as the original signal, but the causal relation is completely eliminated. This shuffling process was applied only to the source signal (X), leaving the target signal (Y) intact. The STE with the shuffled source signal , estimates the bias caused by the signal characteristics of the source signal (X). The unbiased STE was normalized as following,
| (4) |
NSTE is normalized STE (dimensionless), in which the bias of STE is subtracted from the original STE and then divided by the entropy within the target signal, H(YF|YP). Intuitively, NSTE represents the fraction of information in the target signal Y not explained by its own past and explained by the past of the source signal X.19
Finally, the asymmetry between and was defined as following,
| (5) |
Therefore, if DFX→Y has a positive value, the connectivity from X to Y is dominant, and vice versa for a negative value. The feedback and feedforward connections in the frontoparietal network were evaluated with NSTEf→p and NSTEp→f over the 48 subjects (30 ketamine, 9 propofol, 9 sevoflurane). The average and were calculated over the eight pairs of electroencephalogram channels between the frontal and parietal regions for each subject; , where nf = 4 and np = 2. The asymmetry of information flow between the two brain regions was defined as (equation (5)) for each subject.
Appropriate embedding parameters in baseline and anesthetized states
During ketamine anesthesia, we found that NSTEf→p and NSTEp→f have multiscale properties, showing distinct information transfer between frontal-parietal regions on short- and long-term scales. This may be associated with simultaneous increases of gamma and delta powers (relatively short- and long-term dynamics). Therefore, information transmission of a single time scale would not be able to represent the multiscale connectivity of ketamine anesthesia. In this study, we found that the maximum information transfer between frontal and parietal regions provides a consistent connectivity feature of ketamine, propofol and sevoflurane. Three embedding parameters, embedding dimension (dE), time delay (τ) and prediction time (δ), are needed for NSTE. The parameter set that provides the maximum information transfer (NSTE) from the source signal to the target signal was selected as the primary connectivity for a given electroencephalographic dataset, instead of applying a conventional embedding method. By investigating the NSTE in the broad parameter space of dE (from 2 to 10) and τ (from 1 to 30), we fixed the embedding dimension (dE) at 3, which is the smallest dimension providing a similar NSTE, and found the time delay (τ) producing maximum NSTE. In this parameter space, a vector point could cover from 11.7 ms (with τ=1 and dE=3) to 351 ms maximally (with τ=30 and dE=3). If a parameter set for maximum information transfer was determined in one direction, we used the same parameters for the opposite direction. Taking the maximum NSTE as the primary connectivity for a given electroencephalographic dataset, all other processes are nonparametric without subjective decisions for embedding parameters. The prediction time was determined with the time lag (from 1 to 100, 3.9–390 ms) resulting in maximum cross-correlation, assuming the time lag as the interaction delay between the source and target signals.
Repeated one-way analysis of variance for six sub-states
For the purpose of statistical evaluation, we segmented 10 min-long electroencephalographic data into 6 substates: three substates for baseline (B1, B2 and B3) and three substates for anesthetic-induced unconsciousness (A1, A2 and A3), with each substate being a 100 s-long electroencephalographic epoch. The feedback or feedforward connectivity of each substate was defined as the mean value of connectivity over 10 small windows (10 s long). For each small window, the average NSTE, and , between four frontal and two parietal electroencephalogram channels was calculated. The small window size of 10 s may satisfy pseudostationary conditions for NSTE calculation and the mean value over 10 small windows may reflect the connectivity of a substate. Therefore, the data format of the ketamine group is 30 subjects and 6 substates for each connection. The feedback and feedforward connectivity, and , were compared across the six substates; the significance was assessed by a repeated measure one-way analysis of variance (ANOVA) and a post hoc analysis using Tukey’s multicomparison test. The mean ± SD for each connection is presented in Supplemental Digital Contents, and the results of the post hoc test are presented in the Results section. The D’Agostino-Pearson omnibus normality test and Freedman nonparametric test were conducted before the ANOVA test. A p value <0.01 was considered significant. GraphPad Prism Version 5.01 (GraphPad Software Inc. San Diego CA) was used for the tests.
Statistical analysis for false-positive connectivity: permutation test and time shift test
Despite efforts to remove bias from NSTE measurements, there is still a potential for false positive causality. We therefore applied the permutation and time shift tests to evaluate, respectively, the significance and the linear mixing effect on the connectivity. At each substate (B1, B2, B3, A1, A2 and A3), 10 trial datasets were generated by continuously dividing 100 s-long electroencephalographic epochs into 10 s-long epochs. The permutation and time shift tests were then applied to the 10 trial datasets, derived from eight-channel electroencephalogram. The test statistics ( and ) were calculated for eight pairs of electroencephalographic channels.
The permutation test is a nonparametric statistical significance measure that is used to assess whether the test statistics of two groups are interchangeable.13,14 The null hypothesis is that the means of the test statistics (NSTE) of original and randomized electroencephalographic data are interchangeable. The null hypothesis was considered to be rejected with p<0.01. The significance test for connectivity was applied to each pair of electroencephalographic channels with 10 trials and the corresponding 10 shuffled datasets.
With the same data format, the time shift test was applied to evaluate possible false positive connectivity due to an instantaneous linear mixing effect.13,14 In the test, since the future of the source signal has no causal relationship with the present of the target signal, if NSTE (t) < NSTE (t′), t′=t+δ, where t′ is the future time and δ is an interaction time delay between two signals, then the two signals have an instantaneous linear mixing with time delay δ. This also holds for the shifted signal with the past of source signal (t′=t−δ) As with the permutation test, the time shift test was applied to the original and time-shifted (i.e., shuffled) electroencephalographic data. The significance of the mean difference between the two groups was evaluated with the permutation test (nonparametric method, p<0.01).
Results
Distinct spectral changes induced by ketamine, propofol and sevoflurane
The relative power of the electroencephalogram spectrum is the percentage of power contained in a frequency band relative to the total spectrum (0.1–35Hz). We removed frequency bands above 35 Hz to avoid muscle artifact. The relative powers of delta, theta and gamma bands increased after injection of ketamine (across three substates of baseline consciousness and three substates of ketamine anesthesia: F(5,179)=3.54, p=0.0047 for delta, F(5,179)=11.28, p<0.0001 for theta and F(5,179)=68.86, p< 0.0001 for gamma), while the relative powers of alpha and beta bands decreased (across six substates: F(5,179)=52.25, p<0.0001 for alpha, F(5,179)=14.38, p<0.0001 for beta). The simultaneous increase of the relative powers for both slow waves (delta and theta) and fast waves (gamma) was unique to the ketamine power spectrum (Figure 2, first column). Propofol and sevoflurane (Figure 2, second and third columns) induced a spectral pattern distinct from that of ketamine anesthesia: there was an increase of delta, theta and alpha powers (F(5,53) > 3.3, p<0.05 for propofol, F(5,53) > 4.4, p<0.001 for sevoflurane) and decrease of beta and gamma powers (F(5,53) > 3.5, p<0.01 for propofol, F(5,53) > 11, p<0.001 for sevoflurane). The difference among the three anesthetics was most salient in alpha (reduced by ketamine, increased by propofol and sevoflurane) and gamma (increased by ketamine, reduced by propofol and sevoflurane). Thus, the effects of GABAergic and non-GABAergic anesthetics were associated with distinct electroencephalographic spectra. In terms of the regional difference of relative powers for the five frequency bands, the F3, F4 and P3, P4 channels showed a significant power difference. See Table 1 in Supplemental Digital Content 1, which shows regional differences in relative power after administration of ketamine.
Figure 2.
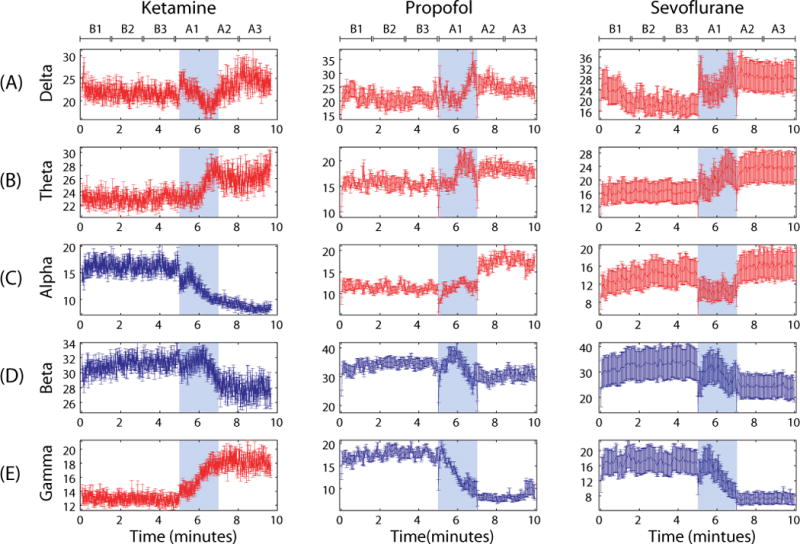
The relative power spectrum for ketamine, propofol and sevoflurane. The relative powers for each frequency band, (A) delta (0.1–4Hz), (B) theta (4–8Hz), (C) alpha (8–13Hz), (D) beta (13–25hz) and (E) gamma (25–35hz), are presented. Error bar denotes the standard error for each 10 s electroencephalogram epoch over 30 subjects. The blue shade indicates induction of anesthesia (from 5 to 7 minutes). The time spans for propofol and sevoflurane anesthesia were rescaled to match with the time of ketamine. Red color indicates the increase of relative power after anesthetic-induced unconsciousness, whereas blue color indicates the decrease of relative power. The relative power of alpha and gamma demonstrated different responses among the three anesthetics. Six substates (B1, B2, B3 in baseline state and A1, A2 and A3 in anesthesia) are denoted.
Table 1.
The null hypothesis rejection rates (%) for the permutation and time shift test.
| N=240 | B1 | B2 | B3 | A1 | A2 | A3 | |
|---|---|---|---|---|---|---|---|
| Permutation (%) | FB | 75 | 69 | 67 | 77 | 84 | 83 |
| FF | 27 | 21 | 18 | 19 | 40 | 40 | |
| Permutation & Time shift (%) | FB | 31 | 28 | 28 | 27 | 22 | 19 |
| FF | 18 | 16 | 13 | 15 | 18 | 18 |
Note the dependence on state and direction of connectivity: the feedback (FB) connections in the baseline conscious state have a higher null hypothesis rejection rate. The number of connections for each substate is 240 (8 pairs of electroencephalogram channels × 30 subjects). FB=feedback; FF=feedforward; B1, B2, B3: three Baseline conscious states; A1, A2, A3: three Anesthetized states.
To examine whether the increased gamma power after administration of ketamine was due to electromyographic artifact, we investigated Pearson correlation coefficients between electromyography and electroencephalography in the gamma frequency bands (25–35Hz). The gamma waves for the electromyogram and electroencephalogram are presented in Figure 3 (A) and (B); a scatter plot of both signals during anesthesia is presented in Figure 3(C). The mean and standard deviation of Pearson correlation coefficient was −0.0106 ± 0.05, which was calculated only with the pairs of channels with p<0.01. No correlation was found between the two signals.
Figure 3.
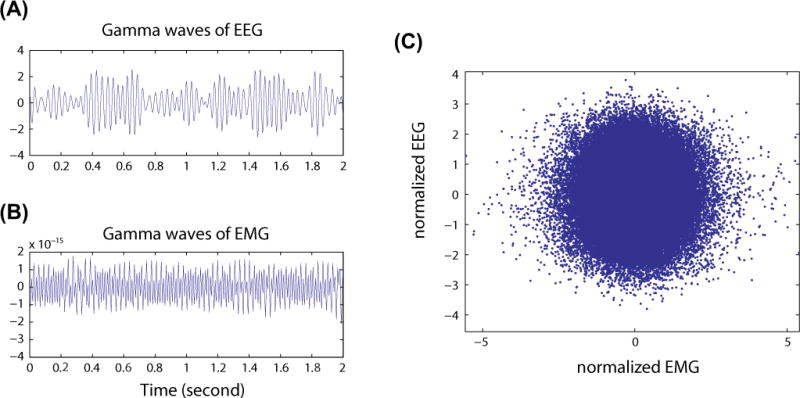
The relationship of gamma waves between electroencephalography and electromyography. (A) Gamma wave of 2 s-long electroencephalogram epoch. (B) Gamma wave of 2 s-long electromyogram epoch. (C) Scatter plot of two gamma waves of 5 min-long electroencephalogram and electromyogram during ketamine anesthesia. No correlations were identified using Pearson correlation coefficient. EEG= electroencephalogram; EMG = electromyogram
Effects of ketamine on directional connectivity
Distinctive patterns of connectivity were demonstrated across different brain regions (Figure 4 (A)–(F)). Figure 4 (A) demonstrates feedback dominance between frontal-parietal regions during the baseline conscious state, which is consistent with our previous findings.11,12 During administration of ketamine, feedback connectivity was gradually reduced and significantly inhibited after loss of consciousness (F(5,179)= 7.785, p<0.0001 for feedback connectivity; p<0.001 for A2 & B1,B2,B3). The reduced feedback connectivity began a notable but statistically insignificant rebound around 8 min after loss of consciousness (p>0.01, not significant for B2, B3 & A3), which may reflect the waning effect of the single drug bolus. By contrast, the feedforward connectivity was preserved for the entire experimental period (F(5,179)=2.07, p=0.072; p>0.01, not significant for any substates).
Figure 4.
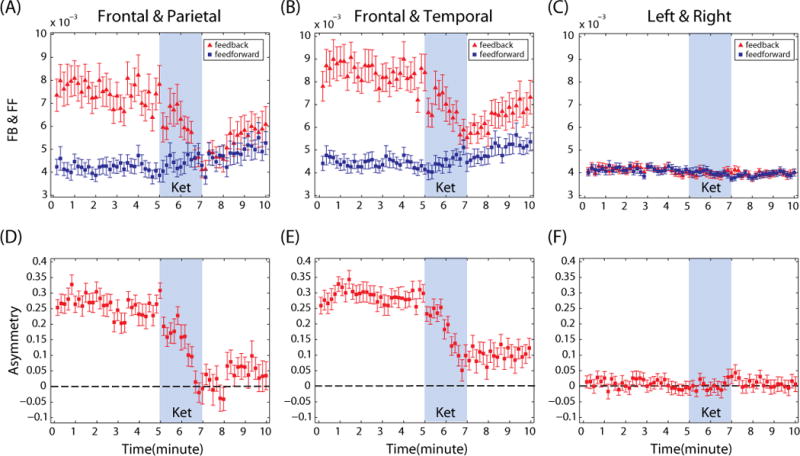
The feedback (FB) and feedforward (FF) connectivity measured by normalized symbolic transfer entropy (NSTE) between (A) frontal and parietal regions, (B) frontal and temporal regions and (C) left and right hemispheres. The FB/FF asymmetry is shown between (D) frontal and parietal regions, (E) frontal and temporal regions and (F) left and right hemispheres. The positive value of asymmetry indicates that the FB connectivity is dominant over the FF connectivity. The mean and standard error over 30 subjects are denoted. The ‘Ket’ in blue shade indicates the ketamine injection for 2 minutes. Only the FB connections of rostral-caudal connectivity show significant reduction, whereas the horizontal connectivity across hemispheres did not.
Changes in the two directions of connectivity gave rise to a significant change in the asymmetry of feedback and feedforward connectivity after anesthesia (F(5,179)=23.88, p<0.0001). The asymmetry of information flow in the frontal-parietal network was largely reduced during ketamine injection, which induced a balanced information flow during the first one min after loss of consciousness (p<0.001 between B1, B2, B3 and A1, A2, A3). This balanced bidirectional connectivity began to break down from the substate A3 (p<0.01, for A2 and A3). Investigating the frontal and temporal regions (Figure 4 (B)), we also found feedback dominance in the baseline conscious state and selective inhibition of feedback connectivity after ketamine injection (F(5,179)=6.59 and p<0.0001 for feedback, but F(5,179)=2.42, p=0.038 for feedforward; A2 is most significant). Figure 4 (E) demonstrates that ketamine was associated with a reduction in the asymmetry, but the feedback connectivity still maintained a relatively greater information flow. Thus, the inhibition of feedback connectivity in the frontal-temporal network was not as robust as that of the frontal-parietal network. The tendency of rebound of feedback and feedforward connectivity in the frontal-temporal network in substate A3 was still observed.
Ketamine anesthesia had no effect on horizontal connectivity across the hemispheres (F(5,179)= 1.76, p=0.124 for left to right, F(5,179)= 2.25, p=0.052 for right to left), despite the disruption of the rostral-caudal connectivity in the brain. Figure 4 (C) and (F) shows that the information flow between left and right hemispheres was balanced and no asymmetry was identified, even in the baseline waking state. The connectivity among eight electroencephalographic channels in six substates is presented in Figures 1 and 2 of Supplemental Digital Content 1. The variance of individual connectivity during ketamine anesthesia is presented in Figure 3 of Supplemental Digital Content 1.
Multiscale feedback and feedforward connectivity
The simultaneous increase of slow and fast electroencephalogram waves (delta and gamma bands) were associated with multiscale information transmission structures during ketamine anesthesia (Figure 5A–F). In particular, the rebound of feedback/feedforward connectivity was identified in short time scales (τ = 1, 2 and 3 with dE=3; 11, 23 and 35 ms in Figure 5(A) and (D)) during ketamine anesthesia, but did not appear at longer time scales (τ = 10, 15 and 20 with dE=3; 117, 175 and 234 ms in Figure 5(B) and (E)). However, despite the reactivation of connectivity, the reduced asymmetry between the feedback and feedforward connectivity was maintained (F(5, 179) > 7, p< 0.001; B1, B2 and B2 > A1, A2 and A3 for the asymmetries of all τ in Figure 5 (C) and (F)). Distinct from the baseline conscious state, the rebound feedback connectivity was accompanied by increasing feedforward connectivity, which maintained the reduced asymmetry during ketamine anesthesia. Thus, although activity of feedback/feedforward connections was variable across time scales, the reduced asymmetry was consistently associated with the loss of consciousness. Furthermore, the feedback dominance in the baseline state and the selective inhibition of feedback connectivity during anesthesia were found irrespective of time scales.
Figure 5.
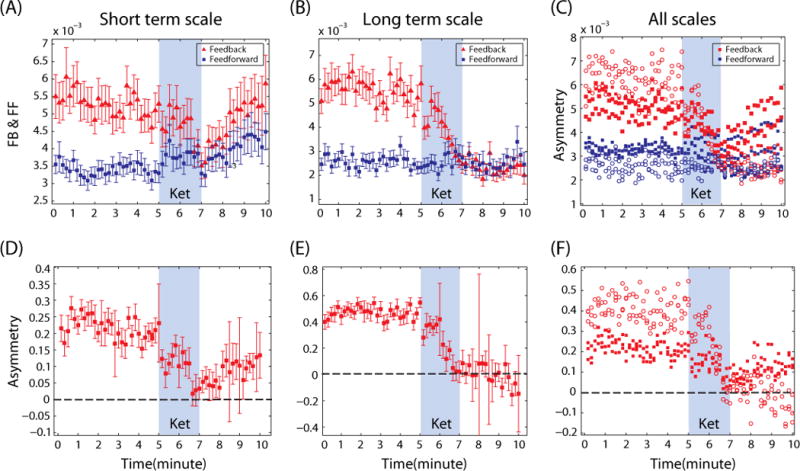
Distinct connectivity response of the frontal-parietal network at different scales. The mean feedback/feedforward (FB/FF) connectivity over 30 subjects is demonstrated for (A) a short time scale (τ=1), (B) a longer time scale (τ=20), and (C) various time scales (τ=1, 3, 5, 10, 15, 20). The shorter time scales (τ=1, 3 and 5) are denoted with filled squares and the longer time scales (τ=10, 15 and 20) are denoted with empty circles. The corresponding asymmetries of FB and FF connectivity are presented for (D) τ=1, (E) τ=20 and (F) various delay times (τ=1, 3, 5, 10, 15, 20). The ‘ket’ denotes the period of ketamine administration. Error bar reflects standard error over 30 subjects.
Robustness of NSTE measures during ketamine anesthesia
Spurious interpretation of correlation or causality can occur when measuring connectivity. As such, the time shift and permutation tests13,14 were applied to all pairs of electroencephalographic channels between frontal and parietal regions in order to test the significance and assess the false positive connections generated by NSTE analysis. To apply these tests, 10 trials (10-s long electroencephalogram epochs) and 10 corresponding shuffled datasets were generated from each substate for each subject receiving ketamine. The rejection rates of the null hypothesis for the two statistical tests are summarized in Table 1. If the null hypotheses of both tests are rejected, the strength of connectivity is deemed robust and reliably deviates from random connectivity generated from potential linear mixing. The percentage of connections passed for both tests was evaluated over all possible pairs of the subjects (2,880 pairs: 2 directions × 6 substates × 8 channel pairs for frontal and parietal regions × 30 subjects). The feedback connections in the baseline state had a higher null hypothesis rejection rate for both tests (30% among all 720 feedback connections for B1, B2 and B3), indicating that the feedback connections in the baseline state were relatively less susceptible to the potential risk of linear mixing. The feedforward connections in the baseline state had a rejection rate of 16%; the feedback and feedforward connections during ketamine anesthesia had rejection rates, respectively, of 23% and 17% on average. Comparing the directional connections, the feedforward connections had relatively lower null hypothesis rejection rates for both tests, which may be due to relatively smaller NSTE values in the feedforward direction. Regarding the dependence on state, the baseline conscious state had a higher rejection rate than the anesthetized state.
Analyzing only the connections that survived both the permutation and time shift tests for each substate, the same patterns of the feedback/feedforward connectivity were demonstrated. The selectively inhibited feedback connection and preserved feedforward connection during ketamine anesthesia, as well as the significantly reduced asymmetries of feedback/feedforward connectivity, were confirmed (F (5,179) = 9.4, p<0.0001, A2/A3 < A1 and baseline states for feedback connections; F(5,179)=0.54, p=0.74 across six substates for feedforward connections; F(5,179)=8.13, p<0.0001 for feedback/feedforward asymmetry).
Comparison of feedforward/feedback connectivity during ketamine-, propofol-, and sevoflurane-induced unconsciousness
Figure 6 (A)–(F) shows feedback/feedforward connectivity and feedback/feedforward asymmetry in frontal-parietal networks during baseline consciousness and unconsciousness induced by ketamine, propofol and sevoflurane. Since propofol and sevoflurane had longer electroencephalogram epochs for the induction of anesthesia compared to ketamine (from start of drug administration to loss of consciousness: 4.09±1 min for propofol; 3.8 ± 0.73 min for sevoflurane), we resampled the feedback and feedforward connections measured by NSTE with the same data length. For convenience of comparison, we rescaled the time axis. The epoch lengths for induction and anesthesia were set as 5 and 8 min, respectively, and lengths were matched using Matlab function (‘resample.m’). Thus, the x-axis in Figure 6 (B)(C)(E) and (F) does not represent the true timeline for each patient. The mean and standard error of NSTE for the baseline state and the mean and standard error for the ‘resampled NSTE’ for induction and anesthesia over all subjects (9 subjects for propofol and 9 subjects for sevoflurane) are presented as continuous in Figure 6 (B)(C)(E) and (F).
Figure 6.
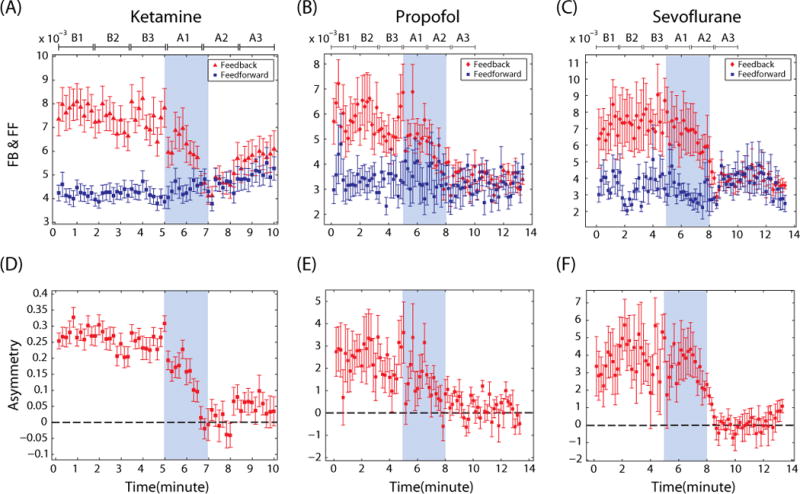
A common neural correlate of anesthetic-induced unconsciousness. The inhibition of asymmetry between the feedback (FB) and feedforward (FF) connectivity is a common feature found across three heterogeneous anesthetics. The FB (red)/FF (blue) connections (A–C) and their asymmetry (D–F) in the frontal-parietal network are shown for (A & D) ketamine (n=30), (B & E) propofol (n=9), (C & F) sevoflurane (n=9). The means and standard errors are denoted at each window. Anesthetic administration is highlighted with blue shading. Six substates (B1, B2, B3 in baseline state and A1, A2 and A3 in anesthesia) are denoted. Note that the timeline of propofol and sevoflurane induction has been rescaled for the purpose of comparison with ketamine induction.
The dominant feedback connectivity in the baseline state and the selective inhibition of feedback connectivity after induction was clearly demonstrated across all three anesthetics (F(5,179)=9.18, p<0.0001 for propofol and F(5,179)=4.11, p=0.0042 for sevoflurane across six substates). In contrast, feedforward connectivity was preserved irrespective of state, a consistent finding across all three anesthetics (F(5,179)=0.179, p=0.967 for propofol and F(5,179)=0.7, p=0.625 for sevoflurane across six substates). As a result, the reduction of feedback dominance and feedback/feedforward asymmetry (F(5,179)=4.97, p=0.0012 for propofol and F(5,179)=5.3, p=0.0008 for sevoflurane across six substates) in the frontal-parietal network was a common neural correlate of anesthetic-induced unconsciousness across ketamine, propofol, and sevoflurane, which represent three molecularly-distinct classes of anesthetics. The mean±SD of feedback and feedforward connections for six substates are presented for ketamine, propofol and sevoflurane in Table 2 of the Supplemental Digital Content 1.
Table 2.
Characteristics of Three Major Classes of General Anesthetics
| Explanatory Level | Group 1 (e.g., propofol) |
Group 2 (e.g., ketamine) |
Group 3 (e.g., sevoflurane) |
|
|---|---|---|---|---|
| Molecular | GABA agonist? | Yes | No | Yes |
| Systems Neuroscience | VLPO activation? | Yes | No | Yes |
| Neuroanatomic Target | Metabolic depression of the thalamus? | Yes | No | Yes |
| Neurophysiology | Increased alpha power? | Yes | No | Yes |
| Information theory | Inhibition of cortical feedback connectivity? | Yes | Yes | Yes |
Group 1 anesthetics include primarily γ-aminobutyric acid (GABA)A agonists such as propofol, etomidate, and thiopental. These drugs tend to be strong hypnotics, but weak immobilizers and analgesics. Group 2 anesthetics include non-GABAergic drugs (such as ketamine, nitrous oxide, and xenon) that may antagonize the N-methyl-D-aspartate glutamatergic receptor. These drugs tend to be strong analgesics, but weak hypnotics and immobilizers. Groups 3 anesthetics have a mixed profile of GABAA agonism, two-pore potassium channel agonism, and excitatory neurotransmitter antagonism. These drugs—such as sevoflurane, isoflurane, and desflurane—are strong hypnotics and immobilizers. Inhibition of cortical feedback connectivity is potentially a common mechanism of anesthetic-induced unconsciousness across all three groups. VLPO=ventrolateral preoptic nucleus, which contains neurons that are active during sleep.
Discussion
This is the first study to assess changes in directional connectivity during ketamine anesthesia in humans and also the first to provide evidence for a common neural correlate of both nonGABAergic (ketamine) and GABAergic (propofol, sevoflurane) anesthetics that is based in the neurobiology of consciousness. Despite the distinct spectral changes of ketamine compared to propofol and sevoflurane, all anesthetics inhibited feedback connectivity, preserved feedforward connectivity, and thus inhibited the feedback dominance observed during the baseline conscious state. These findings have significant implications for the measure and mechanism of general anesthesia, as well as the role and mechanism of feedback connectivity in consciousness. It is important to note that this study assessed only connected or external consciousness (i.e., consciousness of environmental stimuli), which is thought to be mediated by lateral frontoparietal networks, rather than disconnected or internal consciousness (e.g., dream states), which is thought to be mediated by more medial networks. Unresponsiveness to an unambiguous verbal command was used as a surrogate for anesthetic-induced loss of external consciousness.
General anesthetics can be coarsely organized by three groups.20 Group 1 includes primarily GABAA receptor agonists such as propofol, etomidate, and barbiturates, which induce unconsciousness but do not effectively suppress movement. Group 2 includes ketamine, nitrous oxide, and xenon, which are not thought to act primarily via GABAA receptors, but rather through N-methyl-D-aspartate (NMDA) or other receptor types. These drugs have a potent analgesic effect, but are relatively weak hypnotics and immobilizers. Finally, Group 3 drugs include volatile anesthetics such as sevoflurane, desflurane and isoflurane, which are potent hypnotics and have diverse molecular effects such as GABAA and glycine receptor agonism, two-pore potassium channel activation, and excitatory neurotransmitter receptor antagonism. As can be seen in Table 2, ketamine (Group 2) does not share the same molecular, neuroanatomic, or neurophysiologic properties of propofol (Group 1) or sevoflurane (Group 3). Ketamine is thought to act via NMDA1 or HCN13 receptors; unlike virtually all other inhaled and intravenous anesthetics, ketamine does not metabolically inhibit the thalamus.21 Furthermore, ketamine does not activate the sleep-associated ventrolateral preoptic nucleus as other anesthetics do, but rather activates numerous brainstem and diencephalic arousal centers.22 This arousal mechanism may account for the increase in high-frequency and desynchronized waveforms observed on the electroencephalogram.23 Due to their unique neurophysiologic profile, the effects of ketamine and nitrous oxide are not accurately reflected in indices generated by commercially-available brain monitors,24 which have algorithms that rely on a slowing electroencephalogram frequency. Therefore, the effects of ketamine and other non-GABAergic drugs have eluded generalized frameworks of anesthetic mechanism (Table 2) and are not reliably detected in the clinical setting by conventional monitoring technology.
The current study suggests that measurement of directional connectivity in the frontoparietal or frontotemporal region could reflect the effects of all major groups of anesthetics. Since the analytic measure of NSTE is rooted in information theory—and since the frontoparietal network is an important site of information convergence—our findings are consistent with the integrated information theory of consciousness. We predict that measures of information integration, such as the complex phi (ϕ), would also be reduced by diverse anesthetics.25 However, phi as a real-time measure of integrated information may require high-density electroencephalography, a perturbational approach such as transcranial magnetic stimulation, and significant computational burden for accurate calculation, all of which are currently impractical for a routine clinical care setting. Our past and current studies demonstrate proof-of-principle that feedback and feedforward values—as well as the asymmetry between them—can be determined with relatively few channels in human surgical patients, although real-time analysis has not yet been attempted.
A recent study using high-density electroencephalography also found selective inhibition of feedback connectivity in frontoparietal networks after propofol-induced unconsciousness and, using dynamic causal modeling, suggested that this finding reflects a true corticocortical interaction rather than the cortical signature of an underlying thalamocortical event.26 Another recent study using positronemission tomography has confirmed the unique importance of frontoparietal connectivity in the recovery of consciousness after anesthesia.27 Thus, it is likely that the measurement of feedback and feedforward connectivity demonstrated in the current study reflects a corticocortical interaction that is consistently modulated across all major classes of anesthetics and that also reflects an important role of frontal-parietal communication in consciousness and anesthesia.25,28 These findings support the hypothesis that the disruption of top-down communication from the frontal cortex is a common mediator of general anesthetic effects5 and provide a framework for future mechanistic studies of anesthetic-induced unconsciousness that link distinct molecular and neurophysiologic actions to a common information processing endpoint. For example, the thalamocortical hypersynchrony and increased power of alpha waves caused by propofol29,30 likely block the flexible corticocortical communication required for consciousness. However, we demonstrate that ketamine—unlike propofol—decreases alpha power in association with anesthetic-induced unconsciousness (although synchrony was not measured directly). Thus, there is likely an alternative neurophysiologic pathway that nonetheless results in the inhibition of frontal-parietal communication.
Feedback or recurrent processing, both within sensory modalities and across association cortices, has been proposed to be critical for consciousness.4–7 Although focused mainly on the frontal, parietal, and temporal regions using low-resolution scalp electroencephalography, our past studies11,12 and the current study demonstrate, by two distinct analytical methods, that consciousness of the environment is associated with a dominant cortical feedback originating in the frontal region. These empirical findings are consistent with a recent neural mass model based on diffusion tensor imaging of structural connectivity, in which phase lag index measures revealed a dominant flow of information from the frontal cortex to an information processing hub of the posterior parietal cortex.31 On the molecular level, it has been suggested that feedback processing is mediated by NMDA receptor activity while feedforward connectivity is mediated by α-amino-3-hydroxy-5-methyl-isoxazolepropionic acid receptors,4 which has recently been confirmed in a study of the macaque visual system.32 The current study further supports this hypothesis because ketamine—which has known NMDA-receptor antagonist effects—selectively inhibits feedback connectivity while preserving feedforward connectivity.
This investigation is limited by the spatial resolution of an eight-channel electroencephalogram and thus our findings cannot be extrapolated beyond the regions analyzed. However, obtaining such findings in surgical patients with relatively few channels in a real-world clinical setting enhances the translational potential of this study. As noted, a recent study of propofol using high-density electroencephalography is consistent with our finding and suggests that it reflects a direct corticocortical interaction; the stringent statistical tests applied in the current study also indicate that the effects of ketamine on feedback connectivity are robust. Nonetheless, further study with high-density electroencephalography and stepwise titration of multiple anesthetics will be important confirmation.
It should be noted that two recent studies assessing directional connectivity with Granger causality did not find a decrease of connectivity after propofol-induced unconsciousness.33,34 These results, however, are inconsistent with the known effects of general anesthetics. General anesthesia is associated with a metabolic deactivation of frontoparietal networks35 and a decrease in frontoparietal functional connectivity28—it is therefore unlikely that feedback connectivity would be maintained or increased under these conditions. However, we must acknowledge that different analytic techniques and protocols may yield different findings. For instance, variations in electroencephalogram reference, commands, eye opening, and time scale of analytic techniques may influence connectivity results. Furthermore, like other connectivity measures, NSTE analysis has numerous limitations that weaken the assertion of a truly “causal” interaction between brain regions. NSTE does not work well in higher dimensions (more than 5) because the number of possible symbols increases by a factorial order with dimension. Thus, NSTE requires a dataset long enough for proper estimation of conditional probability; the short stationary epoch in the electroencephalogram conflicts with this requirement. The NSTE measure itself is not sensitive to the effects of a latent third source, which can generate spurious causality. The high dimensionality, nonstationarity and third source problems limit most current analyses of connectivity; considerably more work must be done to establish definitively that a particular direction of connectivity or communication is critical to the mechanism of consciousness and anesthesia. However, the consistent results across multiple anesthetics, multiple analytic methods, and multiple studies encourage the interpretation that impaired communication in the frontal-parietal network reflects a common final pathway of anesthetic-induced unconsciousness.
In conclusion, we demonstrate that anesthetics from three major drug classes disrupt frontal-parietal communication in a characteristic and consistent way, as measured by NSTE in the feedback and feedforward directions. These data provide the foundation for a common metric and common neurobiology of anesthetic-induced unconsciousness.
Supplementary Material
Summary Statement.
This study demonstrates in human surgical patients that both GABAergic and non-GABAergic anesthetics disrupt frontal-parietal communication, despite distinct neurophysiologic profiles.
Acknowledgments
Funding: Supported by the National Institutes of Health, Bethesda, MD, USA, Grant 1RO1GM098578 (to GAM) and the Department of Anesthesiology, University of Michigan.
Footnotes
Disclosure: Dr. George A. Mashour and Dr. UnCheol Lee hold a provisional patent (through the University of Michigan, Ann Arbor) on the measurement of directional connectivity for anesthetic monitoring.
Contributor Information
UnCheol Lee, Research investigator, Department of Anesthesiology, University of Michigan Medical School, Ann Arbor, MI, USA
SeungWoo Ku, Associate Professor, Department of Anesthesiology and Pain Medicine, Asan Medical Center, University of Ulsan College of Medicine, Seoul, Korea
GyuJeong Noh, Professor, Department of Clinical Pharmacology and Therapeutics, Department of Anesthesiology and Pain Medicine, Asan Medical Center, University of Ulsan College of Medicine, Seoul, Korea
SeungHye Baek, Assistant Professor, Department of Anesthesiology and Pain Medicine, Asan Medical Center, University of Ulsan College of Medicine, Seoul, Korea
ByungMoon Choi, Assistant Professor, Department of Anesthesiology and Pain Medicine, Asan Medical Center, University of Ulsan College of Medicine, Seoul, Korea
George A. Mashour, Assistant Professor and Associate Chair for Faculty Affairs, Department of Anesthesiology; Faculty, Neuroscience Graduate Program; University of Michigan Medical School, Ann Arbor, USA.
References
- 1.Yamamura T, Harada K, Okamura A, Kemmotsu O. Is the site of action of ketamine anesthesia the N-methyl-D-aspartate receptor? Anesthesiology. 1990;72:704–10. doi: 10.1097/00000542-199004000-00021. [DOI] [PubMed] [Google Scholar]
- 2.Jevtović-Todorović V, Todorović SM, Mennerick S, Powell S, Dikranian K, Benshoff N, Zorumski CF, Olney JW. Nitrous oxide (laughing gas) is an NMDA antagonist, neuroprotectant and neurotoxin. Nat Med. 1998;4:460–3. doi: 10.1038/nm0498-460. [DOI] [PubMed] [Google Scholar]
- 3.Chen X, Shu S, Bayliss DA. HCN1 channel subunits are a molecular substrate for hypnotic actions of ketamine. J Neurosci. 2009;29:600–9. doi: 10.1523/JNEUROSCI.3481-08.2009. [DOI] [PMC free article] [PubMed] [Google Scholar]
- 4.Dehaene S, Changeux JP. Experimental and theoretical approaches to conscious processing. Neuron. 2011;70:200–27. doi: 10.1016/j.neuron.2011.03.018. [DOI] [PubMed] [Google Scholar]
- 5.Changeux JP. Conscious processing: Implications for general anesthesia. Curr Opin Anaesthesiol. 2012;25:397–404. doi: 10.1097/ACO.0b013e32835561de. [DOI] [PubMed] [Google Scholar]
- 6.Lamme VA, Supèr H, Spekreijse H. Feedforward, horizontal, and feedback processing in the visual cortex. Curr Opin Neurobiol. 1998;8:529–35. doi: 10.1016/s0959-4388(98)80042-1. [DOI] [PubMed] [Google Scholar]
- 7.Lamme VA, Roelfsema PR. The distinct modes of vision offered by feedforward and recurrent processing. Trends Neurosci. 2000;23:571–9. doi: 10.1016/s0166-2236(00)01657-x. [DOI] [PubMed] [Google Scholar]
- 8.Boly M, Garrido MI, Gosseries O, Bruno MA, Boveroux P, Schnakers C, Massimini M, Litvak V, Laureys S, Friston K. Preserved feedforward but impaired top-down processes in the vegetative state. Science. 2011;332:858–62. doi: 10.1126/science.1202043. [DOI] [PubMed] [Google Scholar]
- 9.Imas OA, Ropella KM, Ward BD, Wood JD, Hudetz AG. Volatile anesthetics disrupt frontal-posterior recurrent information transfer at gamma frequencies in rat. Neurosci Lett. 2005;387:145–50. doi: 10.1016/j.neulet.2005.06.018. [DOI] [PubMed] [Google Scholar]
- 10.Imas OA, Ropella KM, Wood JD, Hudetz AG. Isoflurane disrupts anterio-posterior phase synchronization of flash-induced field potentials in the rat. Neurosci Lett. 2006;402:216–21. doi: 10.1016/j.neulet.2006.04.003. [DOI] [PubMed] [Google Scholar]
- 11.Lee U, Kim S, Noh GJ, Choi BM, Hwang E, Mashour GA. The directionality and functional organization of frontoparietal connectivity during consciousness and anesthesia in humans. Conscious Cogn. 2009;18:1069–78. doi: 10.1016/j.concog.2009.04.004. [DOI] [PubMed] [Google Scholar]
- 12.Ku S-W, Lee U, Noh G-J, Jun I-G, Mashour GA. Preferential inhibition of frontal-to-parietal feedback connectivity is a neurophysiologic correlate of general anesthesia in surgical patients. PLoS One. 2011;6:e25155. doi: 10.1371/journal.pone.0025155. [DOI] [PMC free article] [PubMed] [Google Scholar]
- 13.Vicente R, Wibral M, Lindner M, Pipa G. Transfer entropy—a model-free measure of effective connectivity for the neurosciences. J Comput Neurosci. 2011;30:45–67. doi: 10.1007/s10827-010-0262-3. [DOI] [PMC free article] [PubMed] [Google Scholar]
- 14.Lindner M, Vicente R, Priesemann V, Wibral M. TRENTOOL: A Matlab open source toolbox to analyse information flow in time series data with transfer entropy. BMC Neurosci. 2011;12:119. doi: 10.1186/1471-2202-12-119. [DOI] [PMC free article] [PubMed] [Google Scholar]
- 15.Martini M, Kranz TA, Wagner T, Lehnertz K. Inferring directional interactions from transient signals with symbolic transfer entropy. Phys Rev E. 2011;83:011919. doi: 10.1103/PhysRevE.83.011919. [DOI] [PubMed] [Google Scholar]
- 16.Staniek M, Lehnertz K. Symbolic transfer entropy. Phys Rev Lett. 2008;100:158101. doi: 10.1103/PhysRevLett.100.158101. [DOI] [PubMed] [Google Scholar]
- 17.Schreiber T. Measuring information transfer. Phys Rev Lett. 2000;85:461–4. doi: 10.1103/PhysRevLett.85.461. [DOI] [PubMed] [Google Scholar]
- 18.Staniek M, Lehnertz K. Symbolic transfer entropy: Inferring directionality in biosignals. Biomed Tech (Berl) 2009;54:323–8. doi: 10.1515/BMT.2009.040. [DOI] [PubMed] [Google Scholar]
- 19.Gourévitch BEJ. Evaluating information transfer between auditory cortical neurons. J Neurophysiol. 2007;97:2533–43. doi: 10.1152/jn.01106.2006. [DOI] [PubMed] [Google Scholar]
- 20.Forman SA, Chin VA. General anesthetics and molecular mechanisms of unconsciousness. Int Anesthesiol Clin. 2008;46:43–53. doi: 10.1097/AIA.0b013e3181755da5. [DOI] [PMC free article] [PubMed] [Google Scholar]
- 21.Långsjö JW, Maksimow A, Salmi E, Kaisti K, Aalto S, Oikonen V, Hinkka S, Aantaa R, Sipilä H, Viljanen T, Parkkola R, Scheinin H. S-ketamine anesthesia increases cerebral blood flow in excess of the metabolic needs in humans. Anesthesiology. 2005;103:258–68. doi: 10.1097/00000542-200508000-00008. [DOI] [PubMed] [Google Scholar]
- 22.Lu J, Nelson LE, Franks N, Maze M, Chamberlin NL, Saper CB. Role of endogenous sleep-wake and analgesic systems in anesthesia. J Comp Neurol. 2008;508:648–62. doi: 10.1002/cne.21685. [DOI] [PMC free article] [PubMed] [Google Scholar]
- 23.Schwartz MS, Virden S, Scott DF. Effects of ketamine on the electroencephalograph. Anaesthesia. 1974;29:135–40. doi: 10.1111/j.1365-2044.1974.tb00611.x. [DOI] [PubMed] [Google Scholar]
- 24.Hirota K, Kubota T, Ishihara H, Matsuki A. The effects of nitrous oxide and ketamine on the bispectral index and 95% spectral edge frequency during propofol-fentanyl anaesthesia. Eur J Anaesthesiol. 1999;16:779–83. doi: 10.1046/j.1365-2346.1999.00585.x. [DOI] [PubMed] [Google Scholar]
- 25.Alkire MT, Hudetz AG, Tononi G. Consciousness and anesthesia. Science. 2008;322:876–80. doi: 10.1126/science.1149213. [DOI] [PMC free article] [PubMed] [Google Scholar]
- 26.Boly M, Moran R, Murphy M, Boveroux P, Bruno MA, Noirhomme Q, Ledoux D, Bonhomme V, Brichant JF, Tononi G, Laureys S, Friston K. Connectivity changes underlying spectral EEG changes during propofol-induced loss of consciousness. J Neurosci. 2012;32:7082–90. doi: 10.1523/JNEUROSCI.3769-11.2012. [DOI] [PMC free article] [PubMed] [Google Scholar]
- 27.Långsjö JW, Alkire MT, Kaskinoro K, Hayama H, Maksimow A, Kaisti KK, Aalto S, Aantaa R, Jääskeläinen SK, Revonsuo A, Scheinin H. Returning from oblivion: Imaging the neural core of consciousness. J Neurosci. 2012;32:4935–43. doi: 10.1523/JNEUROSCI.4962-11.2012. [DOI] [PMC free article] [PubMed] [Google Scholar]
- 28.Boveroux P, Vanhaudenhuyse A, Bruno MA, Noirhomme Q, Lauwick S, Luxen A, Degueldre C, Plenevaux A, Schnakers C, Phillips C, Brichant JF, Bonhomme V, Maquet P, Greicius MD, Laureys S, Boly M. Breakdown of within- and between-network resting state during propofol-induced loss of consciousness. Anesthesiology. 2010;113:1038–53. doi: 10.1097/ALN.0b013e3181f697f5. [DOI] [PubMed] [Google Scholar]
- 29.Ching S, Cimenser A, Purdon PL, Brown EN, Kopell NJ. Thalamocortical model for a propofol-induced alpha-rhythm associated with loss of consciousness. Proc Natl Acad Sci USA. 2010;107:22665–70. doi: 10.1073/pnas.1017069108. [DOI] [PMC free article] [PubMed] [Google Scholar]
- 30.Supp GG, Siegel M, Hipp JF, Engel AK. Cortical hypersynchrony predicts breakdown of sensory processing during loss of consciousness. Curr Biol. 2011;21:1988–93. doi: 10.1016/j.cub.2011.10.017. [DOI] [PubMed] [Google Scholar]
- 31.Stam CJ, Van Straaten ECW. Go with the flow: Use of a directed phase lag index (dPLI) to characterize patterns of phase relations in a large-scale model of brain dynamics. NeuroImage. 2012;62:1415–28. doi: 10.1016/j.neuroimage.2012.05.050. [DOI] [PubMed] [Google Scholar]
- 32.Self MW, Kooijmans RN, Super H, Lamme VA, Roelfsema PR. Different glutamate receptors convey feedforward and recurrent processing in macaque V1. Proc Natl Acad Sci USA. 2012;109:1–6. doi: 10.1073/pnas.1119527109. [DOI] [PMC free article] [PubMed] [Google Scholar]
- 33.Barrett AB, Murphy M, Bruno MA, Noirhomme Q, Boly M, Laureys S, Seth AK. Granger causality analysis of steady-state electroencephalographic signals during propofol-induced anaesthesia. PLoS One. 2012;7:e29072. doi: 10.1371/journal.pone.0029072. [DOI] [PMC free article] [PubMed] [Google Scholar]
- 34.Nicolaou N, Hourris S, Alexandrou P, Georgiou J. EEG-based automatic classification of “awake” versus “anesthetized” state in general anesthesia using Granger causality. PLoS One. 2012;7:e33869. doi: 10.1371/journal.pone.0033869. [DOI] [PMC free article] [PubMed] [Google Scholar]
- 35.Kaisti KK, Metsähonkala L, Teräs M, Oikonen V, Aalto S, Jääskeläinen S, Hinkka S, Scheinin H. Effects of surgical levels of propofol and sevoflurane anesthesia on cerebral blood flow in healthy subjects studied with positron emission tomography. Anesthesiology. 2002;96:1358–70. doi: 10.1097/00000542-200206000-00015. [DOI] [PubMed] [Google Scholar]
Associated Data
This section collects any data citations, data availability statements, or supplementary materials included in this article.