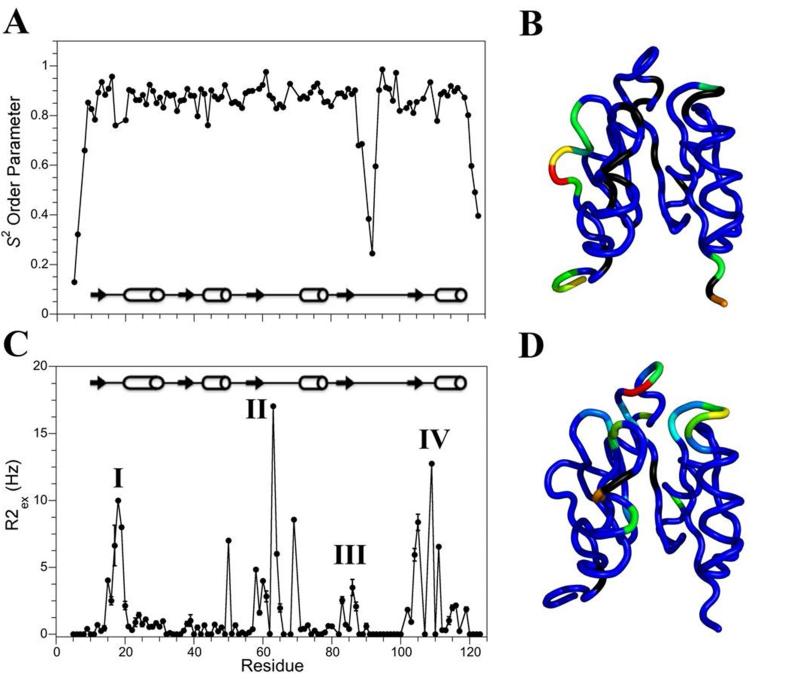
Figure 5.
Model-free analysis of Sma0114. (A) S2 order parameters. (B) S2 order parameters mapped onto the NMR structure of Sma0114. The color map goes from blue (rigid) to red (flexible). (C) R2ex values. (D) R2ex values mapped onto the NMR structure of Sma0114 with colors ranging from blue (negligible R2ex contributions) to red (large R2ex contributions). Residues for which no data are available are shown in black.

