Abstract
Recent evidence suggests that astrocytes do not serve a mere buffering function, but exhibit complex signaling pathways, disturbance of which contributes significantly to the pathophysiology of CNS diseases. Little is known regarding the intracellular signaling pathways in specialized optic nerve head astrocytes (ONHAs), the major glia cell type in non-myelinated optic nerve head. Here we show the differential subcellular expression of intracellular Ca2+ channels in ONHAs. Expression of type 1 and type 3 inositol-1-4-5,-trisphosphate receptors (IP3Rs) in the endoplasmic reticulum and type 2 IP3Rs the nuclear envelope causes differential Ca2+ release from intracellular stores in nuclear vs. cytosolic compartments. Our study identifies differential distribution and activity of Ca2+ channels as molecular substrate and mechanism by which astrocytes independently regulate Ca2+ transients in both cytoplasm and nucleoplasm, thereby controlling genomic and non-genomic cellular signaling, respectively. This provides excellent targets for therapeutics restoring pathological disturbances of intracellular Ca2+ signaling present in glaucoma and other neurodegenerative disorders with astrocyte involvement.
Keywords: optic nerve head astrocyte, optic nerve, calcium channel, calcium imaging, glaucoma, primary cell culture, drug discovery
Introduction
Over the past two decades, the appreciation of astrocytes has changed from considering them merely as metabolic buffering and support system to attributing them a crucial function in synaptic transmission and nervous system physiology (Dallerac, et al., 2013), This is largely the result of several studies in brain astrocytes showing that this cell type employs complex intracellular signaling pathways including calcium signaling (Cornell-Bell, et al., 1990, Muller, et al., 2013, Tong, et al., 2013, Yan, et al., 2013) thought to be unique for neurons (Berridge, 1998). However, detailed mechanistic analyses of such signaling pathways to identify both their molecular components and biophysical and cell biological properties, at the level of necessary detail of work done with neurons, are still needed for astrocytes in most CNS diseases and disease models. Optic nerve head astrocytes (ONHAs) are the major glia cell type in the non-myelinated optic nerve head, where they are the major contributor to extracellular matrix synthesis during development and throughout life (Hernandez, 2000). In glaucoma, a disease affecting more than 60 million people worldwide (Quigley, 2011), pathological changes include altered astrocyte gene and protein expression resulting in activation and extracellular matrix remodeling with little known regarding underlying signaling pathways. Investigation of the intracellular signaling pathways in ONHAs may thus provide novel avenues for target identification and drug discovery.
Cellular Ca2+ homeostasis is tightly regulated and changes in the intracellular Ca2+ concentration control important physiological processes, especially in cell types such as neurons where they include neurotransmitter release and gene expression (Duncan, et al., 2010). In neurons and brain astrocytes alike, these changes are mediated by either Ca2+ influx through (voltage-gated) plasma membrane Ca2+ channels (VGCCs) or release from intracellular Ca2+ stores (Beck, et al., 2004, Gleichmann and Mattson, 2011, Nag, 2011, Venance, et al., 1997, Worley, et al., 1987). Intracellular Ca2+ release is driven mainly by inositol-1,4,5,-trisphosphate receptors (IP3Rs) and ryanodine receptors (RyR) (Berridge, 1998, Koulen and Thrower, 2001), with polycystin-2 ion channels largely serving to amplify their activity upon prolonged depolarization (Koulen, et al., 2002, Koulen and Thrower, 2001). In addition to these ion channels found in membranes of intracellular Ca2+ stores, mechanisms controlling Ca2+ uptake into intracellular stores or Ca2+ extrusion into the extracellular space contribute to cellular Ca2+ homeostasis (Koulen and Thrower, 2001).
Genetic, age-related and pathological changes in Ca2+ signaling underlie a significant number of neurological and neurodegenerative disorders, including glaucoma (Duncan, et al., 2010, Gleichmann and Mattson, 2011, Payne, et al., 2013). Targeting aberrant Ca2+ signaling in neurodegeneration is widely considered a promising strategy and the target of significant drug development efforts (Payne, et al., 2013), and identifying the molecular determinants of intracellular Ca2+ signaling in ONHAs is critically important for drug discovery for glaucoma and related disorders affecting the ON and ON head.
Herein we identified differentially distributed inositol-1,4,5-trisphosphate receptors (IP3Rs) and ryanodine receptors (RyRs) in ex vivo rat ONHAs based on immunocytochemistry and optical imaging of pharmacologically-elicited changes in the intracellular Ca2+ concentration. Our data are the first report of a detailed structure-function relationship of Ca2+ signaling in this cell type of high clinical relevance and provide a novel basis for future glioprotection studies of ONHAs.
Materials and Methods
Primary culture of rat optic nerve head astrocytes
The protocol for the present studies was approved by the Institutional Animal Care and Use Committee at the University of Missouri – Kansas City, and was executed in accordance with the ARVO Statement on the Use of Animals in Ophthalmic and Visual Research.
The isolation of ONHAs was modified from the report by Murphy et al.(Murphy, et al., 2010) Three months old male Brown Norway rats were euthanized and optic nerve heads with approximately 2 mm optic nerve stump attached were dissected and cultured retina side down in a well of a 24-well plate (TTP, Midwest Scientific, St. Louis, MO), in Dulbecco’s Modified Eagle’s Medium (Lonza, Walkersville, MD) supplemented with 20% fetal bovine serum (PAA Laboratories, GE Healthcare Bio-Sciences Corp., Piscataway, NJ) 100 U/mL penicillin, and 100 µg/mL streptomycin. At 5 days in vitro (DIV), astrocytes had migrated onto the plate as confirmed under a tissue culture microscope (DM IL, Leica Microsystems, Buffalo Grove, IL). Remaining tissue and media were aspirated by vacuum suction and fresh media added. Media was subsequently refreshed every 72 hr. At DIV 10, cells had reached approximately 80% confluency in the well and were passaged into a T25 tissue culture flask (TPP, Midwest Scientific, St. Louis, MO) by trypsinization (0.25% Trypsin, 2.21 mM EDTA in Hank’s Balanced Salt Solution; MediaTech Inc., Manassas, VA). ONHA culture was successfully maintained for more than 10 passages at a sub-culturing ratio of 1:4 every 72 hr. Passages 3 – 6 were used for the experiments described herein.
Immunocytochemistry and image acquisition
Immunocytochemistry was performed essentially as described previously (Kaja, et al., 2011, Kaja, et al., 2011, Kaja, et al., 2012). Briefly, ONHAs were seeded onto poly-L-lysine coated glass coverslips (BD Biosciences, San Jose, CA) at a density of 25,000 cells. Cells were fixed in 4% paraformaldehyde in 0.1 M phosphate buffered saline for 15 min. The primary antibodies against glial fibrillary acidic protein (GFAP), IP3Rs and RyRs have previously been validated extensively for use in immunocytochemistry and are listed in Table 1. Secondary antibody was AlexaFluor® 488 labeled goat anti-rabbit IgG (1:2,000 dilution; Life Technologies, Carlsbad, CA). Cells were co-labeled with AlexaFluor® 647 Phalloidin (1:200 dilution; Life Technologies, Carlsbad, CA) to visualize actin filaments, and Hoechst 33258 (120 ng/µL; Enzo Life Sciences Inc., Farmingdale, NY) to label cell nuclei. Cells were mounted using AquaPolymount (Polysciences Inc., Warrington, PA). Images were acquired using a Leica SP5X WLL microscope (Leica Microsystems Inc., Buffalo Grove, IL). Single optical sections are shown.
Table 1.
Antibodies used for immunocytochemistry
| Epitope | Host | Cat# | Supplier | Dilution | Reference |
|---|---|---|---|---|---|
| anti-GFAP | Rabbit | Ab4674 | AbCam, Cambridge, MA | 1:2,000 | |
| Anti-IP3R1 | Goat | sc-6093 | Santa Cruz Biotechnology, Santa Cruz, CA | 1:50 | (Payne et al., 2013a) |
| Anti-IP3R2 | Goat | sc-7278 | Santa Cruz Biotechnology, Santa Cruz, CA | 1:50 | (Payne et al., 2013a) |
| Anti-IP3R3 | Goat | sc-7277 | Santa Cruz Biotechnology, Santa Cruz, CA | 1:50 | (Payne et al., 2013a) |
| anti-RyR1 | Rabbit | AB9078 | Chemicon; EMD Millipore, Bellerica, MA | 1:15,000 | (Medina-Ortiz et al., 2007; Payne et al., 2013a) |
| anti-RyR2 | Rabbit | AB9080 | Chemicon; EMD Millipore, Bellerica, MA | 1:15,000 | (Medina-Ortiz et al., 2007; Payne et al., 2013a) |
| anti-RyR3 | Rabbit | AB9082 | Chemicon; EMD Millipore, Bellerica, MA | 1:15,000 | (Medina-Ortiz et al., 2007; Payne et al., 2013a) |
We used the above subtype-specific antibodies to determine the localization and distribution of IP3Rs and RyRs in primary cultured rat ONHAs. All antibodies are well-characterized and their specificity for their respective epitopes has been shown previously.
Optical imaging of the intracellular calcium concentrations
Calcium imaging experiments and analysis were performed essentially as described previously.(Payne, et al., 2013) Experiments were conducted in Extracellular Solution buffer (ECS; 137 mM NaCl, 5 mM KCl, 1 mM Na2HPO4, 1 mM MgSO4, 10 mM HEPES, 22 mM D-(+)-glucose, and 1.8 mM CaCl2. Final concentrations of the excipient, dimethylsulfoxide (Sigma, St Louis, MO), were maintained at 0.1%. Cells were seeded as detailed above and incubated for 20 min with 1 µM Fura-2 acetoxymethyl ester (AM) (Life Technologies, Carlsbad, CA) in growth media supplemented with 3 mM sodium pyruvate (Lonza, Walkersville, MD) to counter potential effects of byproducts of the AM hydrolysis reaction.(Tiffert, et al., 1984) Coverslips were rinsed in ECS supplemented with 55 mM KCl to fill intracellular stores prior to being mounted for imaging on a Leica DMI 6000 fluorescent microscope (Leica Microsystems Inc., Buffalo Grove, IL) with an Orca-R2 C10600 digital camera (Hamamatsu, Bridgewater, NJ) with DG5 fast wavelength switcher (Sutter, Novato, CA) controlled by MetaFluor (Molecular Devices, Sunnyvale, CA) and Fura2 filter set 71000av2 (D340xv2, D380xv2, 400DCLP, D510/40m; Chroma, Bellows Falls, VT) and allowed to equilibrate in ECS for at least 5 minutes prior to imaging. Cells were imaged with a HCX PL APO 40x/1.25–0.75 oil objective (Leica Microsystems, Buffalo Grove, IL). Mounted coverslips were constantly perfused with ECS buffer warmed to 37°C by a temperature controller (TC-344B; Warner Instruments, Hamden, CT) and an inline heater/cooler (SC-20; Warner Instruments, Hamden, CT). Drugs were delivered through a software-controlled perfusion system (VC-8T; Warner Instruments, Hamden, CT) driven by high flow peristaltic pumps (P720/66; Instech, Plymouth Meeting, PA) at speed of 2 ml/min. For RyR-mediated responses, caffeine-treated coverslips were imaged at 1 Hz and were perfused with 50 mM caffeine in ECS solution for 300 s, followed by 120 s in ECS buffer. Cells did not respond to depolarization with 55 mM KCl (data not shown). Maximum release of intracellular Ca2+ was obtained from the same cells by perfusion with 2.5 µM ionomycin in ECS for 120 s, 5 min after return of the signal to baseline. For IP3R-mediated responses, cells were incubated and recorded with 10 µM Bt3Ins(1,4,5)P3/AM (AG Scientific, San Diego, CA) for 20 minutes in a total of 300 µl with a heated cover. Images were recorded at 2 Hz, to reduce photobleaching.
For pharmacological experiments, dantrolene (DAN; 20 µM; Enzo, Farmingdale, NY) and Xestospongin D (Xes D; 10 µM; EMD Millipore, Gibbstown, NJ), inhibitors of RyR and IP3R, respectively, were applied 30 min prior to application of the respective agonists, and the concentration maintained during the experiment.
Regions of Interest (ROIs) were selected based on fluorescent and brightfield images, identifying cell perimeter, cytosol and nucleus. Data was background corrected utilizing the mean fluorescence signal intensity from 5 randomly placed background ROIs in the field of view, normalized for surface area and section volume and exported to Microsoft Excel (Microsoft Corporation, Redmond, WA) for analysis, as described previously (Payne, et al., 2013). Specifically, a single ROI was used for the total cellular response by outlining the cell based on the DIC image. For subcellular analysis, a single ROI was used for the nuclear Ca2+ response, whereas 3–5 ROIs were placed in the cytosol. Signal intensity of cytosolic ROIs was averaged to obtain the mean fluorescence intensity value for each cell.
Data Analysis and Statistics
Statistical analysis was conducted using Prism version 5 (Graphpad Software Inc., La Jolla, CA). Experimental groups were compared by Student’s t-test or one-way analysis of variance (ANOVA) with Newman-Keuls post hoc test, as appropriate. Ca2+ transients were analyzed with respect to amplitude, the maximal intracellular calcium release from ER stores, and presented as mean F/F0 max, and as mean area under the curve (AUC), a correlate measure of total calcium release. This experimentally-defined AUC was calculated from the baseline (F0) to the amplitude (F/F0 max) plus the next 100 time points (equaling 100s for caffeine experiments) or 250 time points (equaling 500s for IP3-AM experiments), and is shown as integrated relative fluorescence units (iRFU). Transients were defined by thresholding at 5% above baseline (F/F0 > 1.05). The 5% threshold was applied after normalization and was used to distinguish artifacts or noise from specific signals in a standardized way. The 5% threshold served as inclusion criterion for cells responding at different intensities, thus permitting differentiation of lower cytosolic responses compared with stronger nuclear responses. Data was compiled from the number of cells (n) derived from a minimum of three to five separate experiments for each experimental condition. When referring to the number of cells responding to pharmacological stimuli, n represents a single experiment, consisting of 3–5 coverslips. For histograms, binned data (in F/F0 max = 0.05 bins, based upon the applied 5% threshold) was fitted with a non-linear regression for Gaussian distribution (1,000 iterations) and data contingency tables were compared with the Pearson’s chi squared (χ2) test, as described by us previously.(Payne, et al., 2013)
Results
ONHAs exhibit a differential subcellular expression of intracellular Ca2+ channels
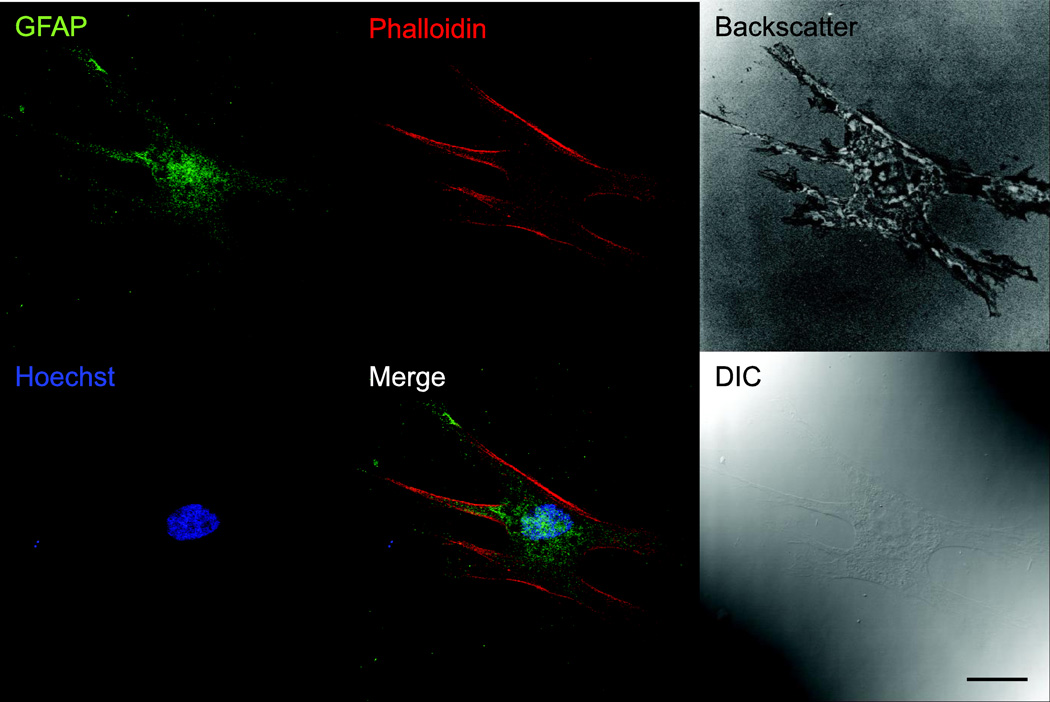
Ex vivo ONHAs showed strong immunoreactivity for glial fibrillary acidic protein (GFAP), identifying them positively as astrocytes (Fig. 1). Furthermore, ONHAs showed distinct plasma membrane labeling for the glutamate aspartate transporter (GLAST; data not shown). Cells were of a single morphology typical for CNS astrocytes, and no other cell types were observed. ONHAs were difficult to detect by DIC using confocal microscopy due to their thinness (Fig. 1). Backscatter images, obtained using 647 nm wavelength laser line, highlight adhesion and morphology of ONHAs.
Figure 1. Cultured ONHAs are positive for GFAP.
Representative images for primary cultured rat ONHAs (passage 3) stained for GFAP, colabeled with AlexaFluor® 647 Phalloidin and Hoechst 33258. Backscatter image generated with 647 nm laser illumination shows morphology and adhesion of ONHA. A differential interference contrast (DIC) image is shown for comparison. Scale bar: 25 µm.
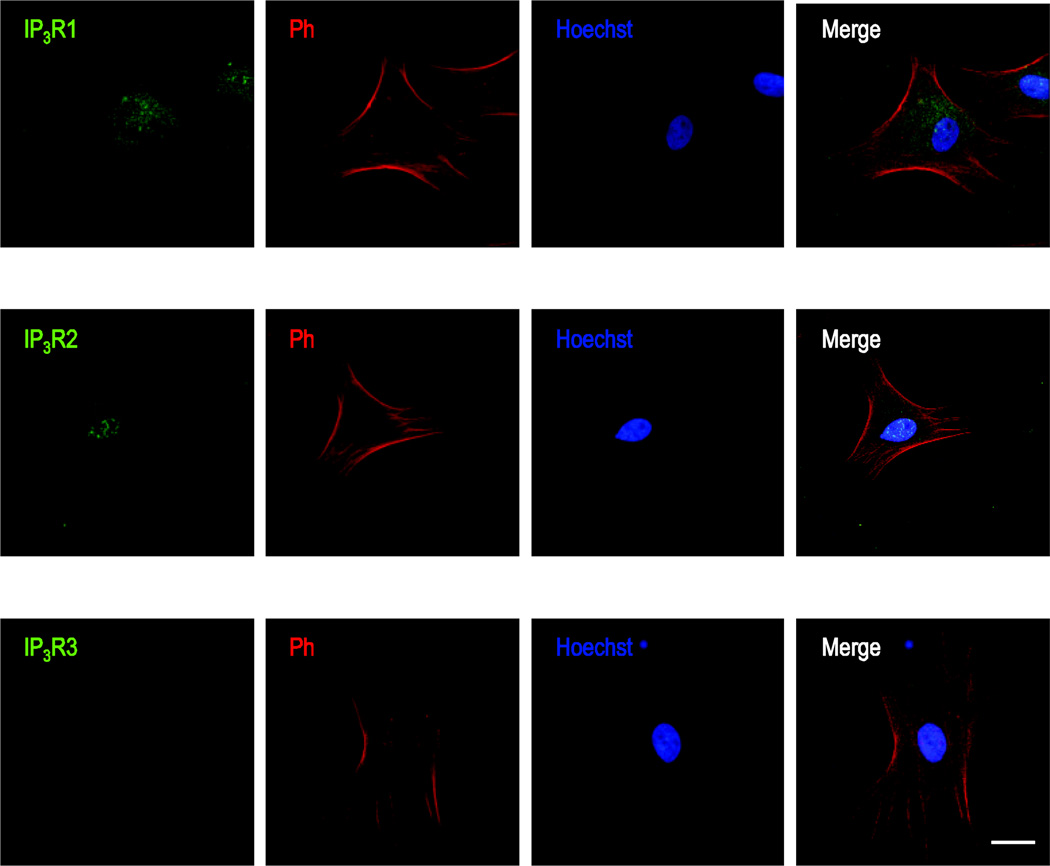
We determined the expression and distribution of all three known subtypes of IP3Rs, type 1 IP3R (IP3R1), type 2 IP3Rs (IP3R2) and type 3 IP3Rs (IP3R3). We identified significant immunoreactivity for IP3R1 and IP3R2 in primary cultured rat ONHAs using immunocytochemistry (Fig. 2). Immunoreactivity was mostly cytosolic for IP3R1s (Fig. 2A), characteristic of expression on the ER (Koulen, et al., 2000), whereas IP3R2 showed strong nuclear localization, characteristic of expression on the nuclear envelope (Fig. 2B). We did not detect IP3R3 immunoreactivity in primary cultured rat ONHAs.
Figure 2. Immunocytochemical localization of IP3Rs in primary cultured rat ONHAs.
Representative images are shown for staining against IP3R1 (A), IP3Rs (B), and IP3R3 (C), using AlexaFluor® 488-labeled secondary antibody. Cells were co-stained using AlexaFluor® 647 Phalloidin, labeling actin filaments, and with the nuclear label Hoechst 33258. Note the punctate, cytosolic immunoreactivity indicative of ER localization for IP3R1, compared to the strong nuclear immunoreactivity of IP3R2. We did not detect significant IP3R3 immunoreactivity in primary cultured rat ONHAs. Scale bars are 25 µm.
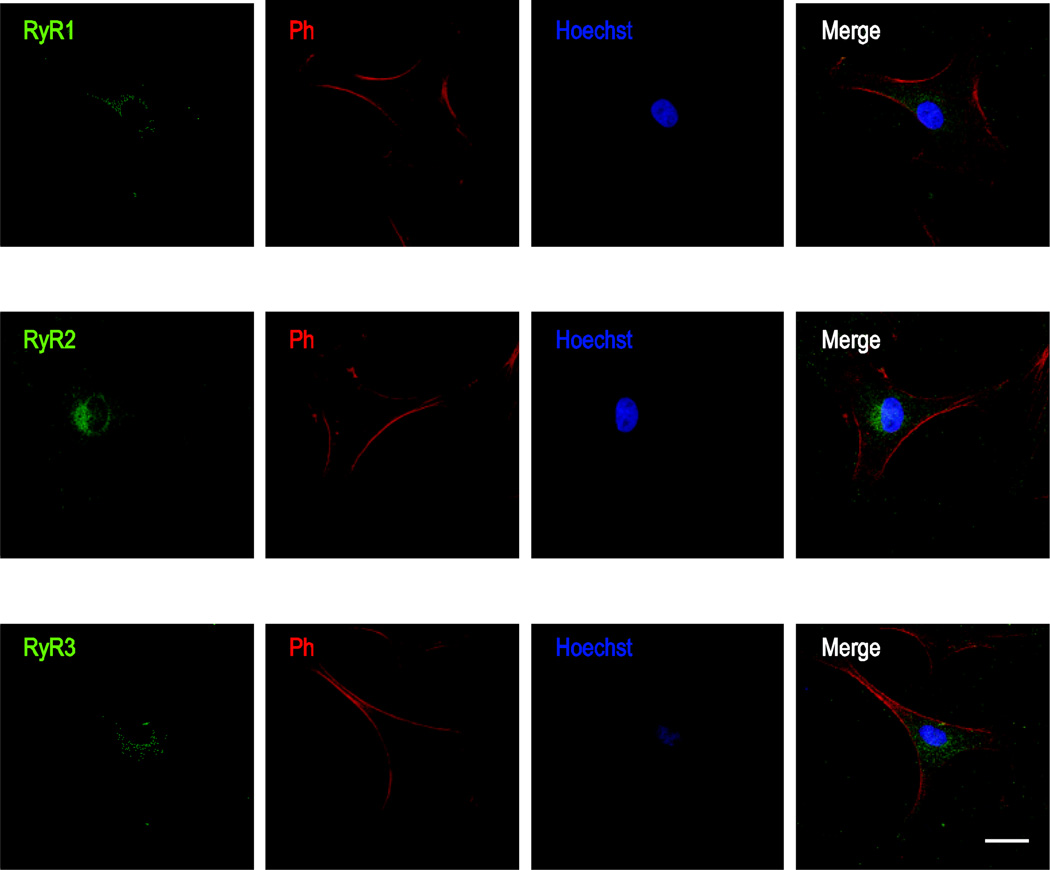
Similarly, we identified strong immunoreactivity for all subtypes of RyR in primary cultured rat ONHAs (Fig. 3). All RyR subtypes showed punctate immunoreactivity reminiscent of cytosolic and ER localization. Co-labeling with the nuclear dye Hoechst 33258 did not reveal any differentially distributed elevated localization to the nuclear envelope as seen for IP3R2s (Fig. 2B).
Figure 3. Immunocytochemical localization of RyRs in primary cultured rat ONHAs.
Representative images are shown for staining against RyR1 (A), RyR2 (B), and RyR3 (C), using AlexaFluor® 488-labeled secondary antibody. As for IP3R staining in Fig.1, cells were co-stained using AlexaFluor® 647 Phalloidin and Hoechst 33258. Note the punctate, cytosolic immunoreactivity indicative of ER localization typical for RyRs. We identified all RyR subtypes in primary cultured rat ONHAs, with RyR2 showing the strongest Scale bars are 25 µm.
IP3Rs and RyRs contribute functionally to intracellular Ca2+ release from stores
In order to identify the potential functional relevance of such a differential distribution of intracellular Ca2+ channels we next used receptor-specific pharmacology to elicit Ca2+ release from intracellular stores and performed quantitative imaging of intracellular Ca2+ concentration transients.
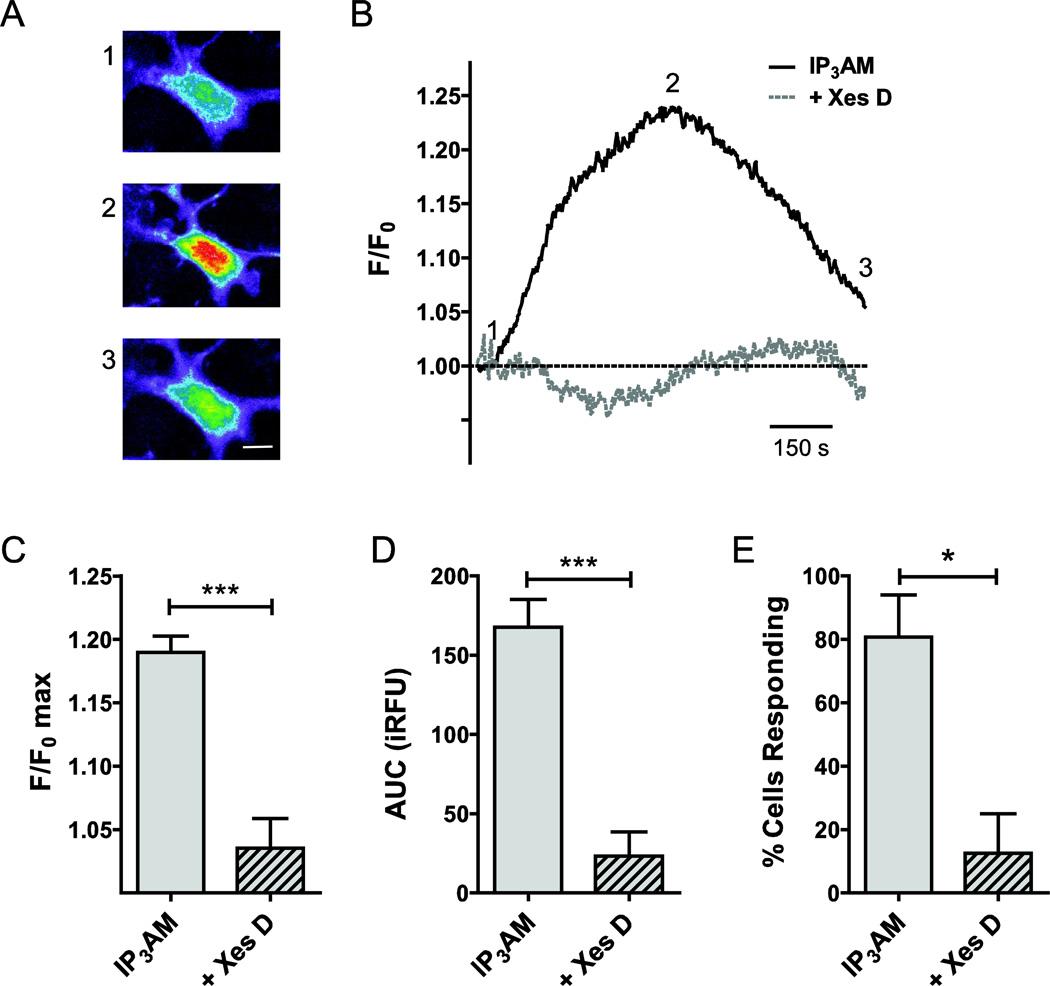
In order to determine the contribution of IP3Rs, we measured the rise in intracellular Ca2+ concentration upon stimulation with the IP3R-selective agonist, IP3 (10 µM IP3-AM). Representative raw cellular responses (excitation: 380 nm, not corrected for background) presented as heat maps (Fig. 4A) are shown alongside the matching background corrected and normalized single cell traces (F/F0 max; Fig. 4B). Stimulation resulted in a 19.0 ± 1.3% increase of normalized fluorescence intensity over baseline (F/F0 max; n=47; Fig. 4C) and resulted in an experimentally determined AUC for IP3 stimulation of 168 ± 18 iRFU (n=45; Fig. 4D). Using a threshold of 5%, we calculated a responder rate of 81 ± 13% (Fig. 4E). To test the specificity of the response, we pre-incubated cells with the IP3R blocker, Xes D, for 30 min. Xes D reduced both AUC (n=18; P<0.001; Fig. 4A) and F/F0 max (n=18; P<0.001; Fig. 4B). The number responding cells was reduced significantly by 68% (P<0.05; Fig. 4C) by the presence of Xes D.
Figure 4. Functional contributions of IP3Rs to intracellular Ca2+ release in primary cultured rat ONHAs.
In order to determine the contribution of IP3Rs to Ca2+ release from intracellular stores, we quantified the rise in intracellular Ca2+ concentration upon stimulation with the IP3R-selective agonist, IP3, using optical imaging and the Ca2+ fluorophore, Fura-2. For delivery, we used the membrane-permeable molecules IP3-AM (10 µM) and Fura-2-AM (1 µM). Representative cellular responses (A) and traces (B) are shown. Warmer colors indicate higher fluorescence intensity. IP3 stimulation resulted in a mean 19.0 ± 1.3% increase of normalized fluorescence intensity over baseline (F/F0 max; n=47; C). This corresponded to an experimentally determined AUC of 168 ± 18 iRFU (n=45; D). In our experiments, 81 ± 13% of cells responded to IP3 stimulation (n=3 separate experiments, with at least 15 cells per experiment; E). In order to determine the specificity of the response, we pre-incubated cell with the IP3R blocker, Xestospongin D (Xes D), for 30 min, and experiments performed with Xes D co-application. Xes D resulted in a 15.4 ± 2.5% reduction of F/F0 max (n=18, P<0.001; C), and reduced AUC significantly by 145 ± 30 iRFU (n=18, P<0.001; D). The number of cells responding to IP3 in the presence of Xes D was reduced significantly by 68% (P<0.05; E). * P<0.05; *** P<0.001. Scale bar: 10 µm.
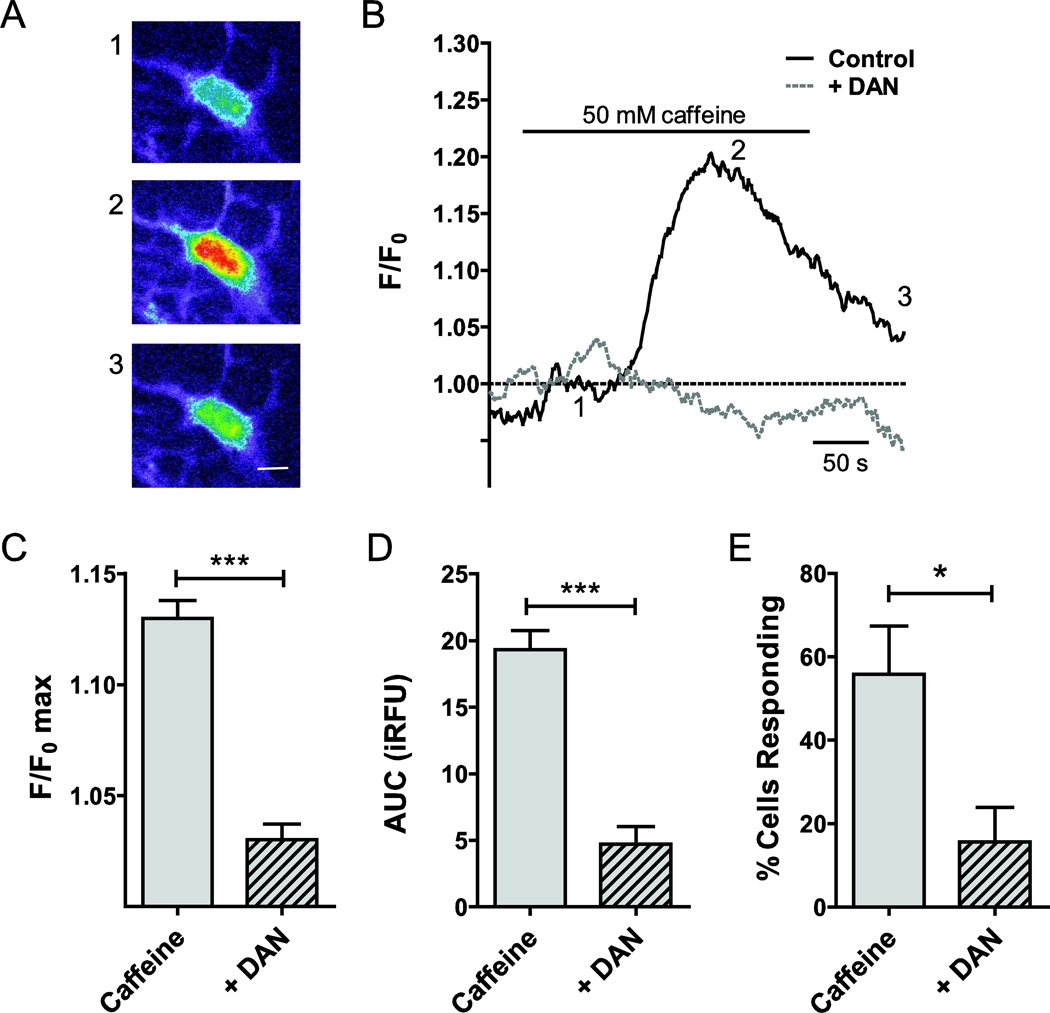
In a separate set of experiments, we measured RyR-mediated Ca2+ release using pharmacological stimulation of the receptor (50 mM caffeine). Representative cellular responses, obtained from uncorrected raw images (excitation: 380 nm) presented as heat maps are shown in Fig. 5A. The matching traces are plotted in Fig. 5B. Mean fluorescence intensity increased by 13.0 ± 0.8% over baseline (F/F0 max; n=38; Fig. 5C) following caffeine stimulation. The experimentally determined AUC was 19.5 ± 1.5 iRFU (n=38; Fig. 5D). The number of responding cells was again calculated applying a 5% threshold and was 56 ± 12% (Fig. 5E). Following a 30 min pre-incubation with the RyR inhibitor, DAN (20 µM), for 30 min, peak fluorescence intensity (F/F0 max; n=49, P<0.001; Fig. 5C) and AUC (n=49, P<0.001; Fig. 5D) were statistically significantly reduced. Similarly, the number of responding cells was significantly lower during DAN application (P<0.05; Fig. 5C). Representative traces are shown (Fig. 5D). The matching cellular responses are obtained from uncorrected raw images (excitation: 380 nm) presented as heat maps (Fig. 5E).
Figure 5. Functional contributions of RyRs to intracellular Ca2+ release in primary cultured rat ONHAs.
Caffeine (50 mM) was used as RyR agonist to quantify the contributions of RyR to stimulus-induced intracellular Ca2+ release. Representative cellular responses (A) and traces (B) are shown. Warmer colors indicate higher fluorescence intensity. We observed an average 13.0 ± 0.8% increase of normalized fluorescence intensity over baseline (F/F0 max; n=38; C). The experimentally determined AUC for RyR stimulation was 19.5 ± 1.5 iRFU (n=38; D). In our experiments, 56 ± 12% of cells responded to caffeine stimulation (n=3 separate experiments, with at least 15 cells per experiment; E). In order to determine the specificity of the response, we pre-incubated cells with the RyR inhibitor, dantrolene sodium (DAN; 20 µM), for 30 min, and experiments performed with DAN co-application. DAN reduced F/F0 max (3.0 ± 0.7%, n=49, P<0.001; C) and AUC significantly by 14.6 ± 2.0 iRFU (n=49, P<0.001; D). The number of cells responding to caffeine in the presence of DAN differed significantly by 35 ± 15% (P<0.05; E). * P<0.05; *** P<0.001. Scale bar (in A): 10 µm.
Evidence for independent regulation of nuclear and cytosolic Ca2+ signaling in ONHAs
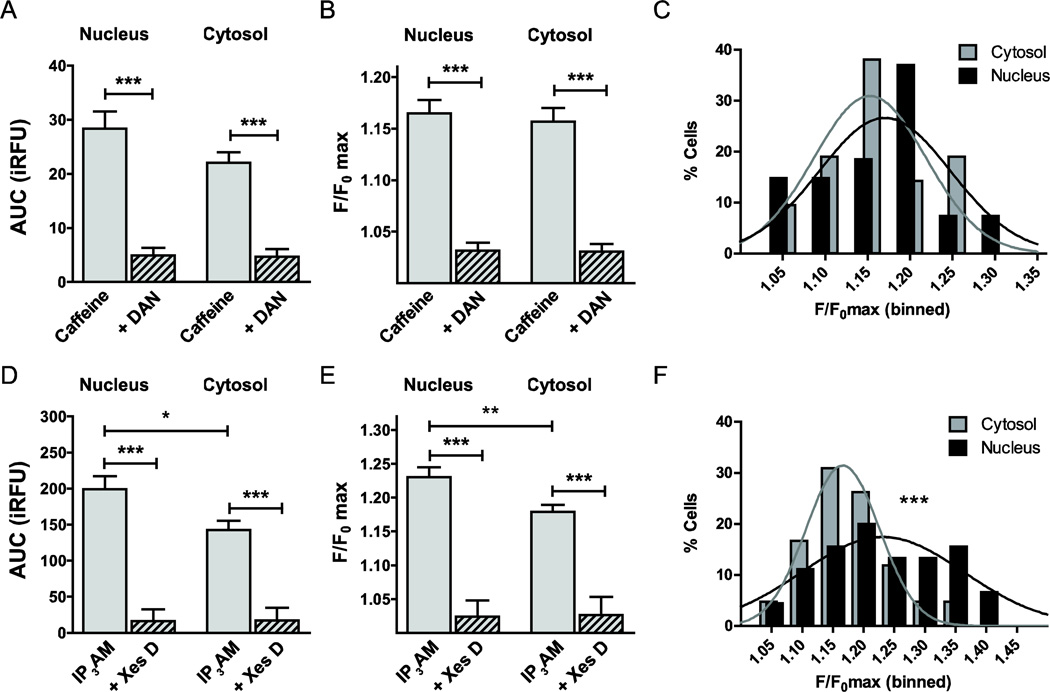
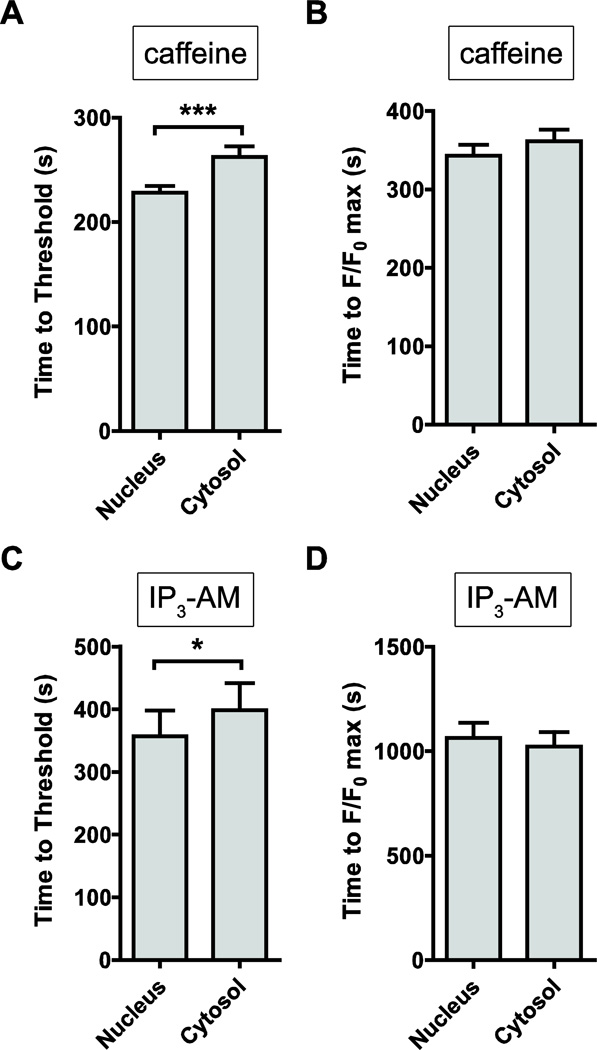
In order to account for a preferential distribution of ICCs on the membranes of the ER or the membranes of the nuclear envelope, an ER sub-compartment, we performed a subcellular analysis of our Ca2+ imaging data. Caffeine-induced, i.e. RyR-mediated Ca2+ release did not differ significantly between nuclear and cytosolic areas, as quantified by AUC (P=0.13; Fig. 6A) and the maximum fluorescence intensity F/F0 max (P=0.67; Fig. 6B). DAN blocked caffeine-mediated Ca2+ release similarly in the nucleus and the cytosol (Fig. 6A, B). Nuclear and cytosolic amplitudes of RyR-mediated Ca2+ transients binned at 5% intervals (Fig. 6C) were found to be Gaussian normally distributed (R2=0.45 and R2=0.71, respectively) and not to be statistically significantly different (Pearson’s χ2 test, P=0.41). Time to threshold was lower for nuclear responses, compared with cytosolic responses of caffeine-stimulated intracellular Ca2+ release (n=32, P<0.001; Fig. 7A). In contrast, time to peak (F/F0 max) was similar between nuclear and cytosolic responses (n=32, P=0.81; Fig. 7B).
Figure 6. Subcellular localization of stimulus-induced intracellular Ca2+ release.
Given the differential subcellular localization of ICCs on the membranes of ER or the membranes of the nuclear envelope, we performed a subcellular analysis of our Ca2+ imaging data. No statistically significant difference was identified between nuclear and cytosolic Ca2+ release upon caffeine stimulation, neither at the level of AUC (A) nor F/F0 max (B). DAN blocked caffeine-mediated Ca2+ release similarly in both regions (A, B). Amplitudes of the RyR-mediated Ca2+ transients binned at 5% intervals are Gaussian normally distributed, and the distributions for not statistically significantly different between cytosol and nucleus (P=0.41; C). In contrast, AUC of IP3R-mediated Ca2+ release was 39% higher in the nucleus compared with the cytosol (n=42, P<0.05; D). Similarly, F/F0 max was 28% higher in the nucleus vs. the cytosol (n=42, P<0.05; E). Both, binned nuclear and cytosolic F/F0 max amplitudes could be fitted with a Gaussian distribution and were highly significantly different (P<0.001; F).
Figure 7. Kinetic analysis of IP3- and caffeine-stimulated intracellular Ca2+ responses.
We measured the kinetic responses of the increase in intracellular Ca2+ concentration, following exposure to the agonists, IP3-AM and caffeine. (A) Time to reach the 5% threshold was significantly faster for nuclear responses, compared with cytosolic responses (228.1 ± 6.4 sec vs. 262.5 ± 10.0 sec, n=32, P<0.01). (B) Similarly, time to peak (F/F0 max) was faster for nuclear vs. cytosolic responses (343.3 ± 13.7 sec vs. 361.6 ± 14.7 sec, n=32, P<0.001), indicative of significant nuclear localization of RyR2 receptors. (C) IP3-AM stimulation resulted in a faster nuclear response to threshold, compared with cytosolic kinetics (357.1 ± 41.0 sec vs. 398.4 ± 43.5, n=46, P<0.05), supporting evidence for significant expression of nuclear IP3R2 receptors in the membranes of the nuclear envelope. (D) In contrast, time to peak (F/F0 max) was similar between nuclear and cytosolic responses (1063 ± 72 sec. vs. 1023 ± 68 sec, n=46, P=0.69).
In contrast, the AUC of IP3R-mediated Ca2+ release was 39% higher in the nucleus vs. the cytosol (n=42, P<0.05; Fig. 6D). Similarly, F/F0 max was 28% higher in the nucleus compared with the cytosol (n=42, P<0.05; Fig. 6E). Both, nuclear and cytosolic F/F0 max amplitudes, binned at 5% intervals, could be fitted with a Gaussian normal distribution (R2=0.71 and R2=0.82, respectively) and were highly significantly different when comparing responses using the Pearson’s χ2 test (P<0.001; Fig. 6F). Time to threshold was significantly faster for nuclear responses (n=42, P<0.05, Fig. 7C), while time to peak was similar between nucleus and cytosol (n=42, P=0.678, Fig. 7D).
Discussion
We herein describe intracellular Ca2+ signaling pathways in primary cultured adult rat ONHAs. To our knowledge, this is the first report of a quantitative analysis of Ca2+ signaling with a focus on intracellular Ca2+ channels in this highly clinically relevant cell type.
All antibodies used for immunocytochemistry have been previously validated and their specificity has been shown in a number of different cells and tissues. Furthermore, we performed appropriate controls to test for specificity, including omission of the primary antibody and pre-incubating the primary antibody with 100-fold excess of the peptide used to generate the antibodies (data not shown). We used the ratiometric fluorophore, Fura-2, to measure the stimulus-induced rise in the intracellular Ca2+ concentration. Fura-2 has been well established for live-cell imaging and the estimated KD for Ca2+ is approximately 224 nM in the cytosol of living cells (Grynkiewicz, et al., 1985, Haworth and Redon, 1998). Furthermore, due to ratiometric sampling, Fura-2 provides for experimental control over dye loading concentration, loading efficiency, illumination intensity, and photobleaching, in addition to having a very low affinity for divalent cations other than Ca2+ (Grynkiewicz, et al., 1985).
In order to measure IP3R- and RyR-mediated intracellular Ca2+ release, we used the specific agonists IP3-AM (10 µM) and caffeine (50 mM), respectively. These concentrations are within the physiological or pharmacologically relevant range of concentrations to stimulate IP3R and RyR activity, respectively (Berridge, 1998, Leite, et al., 2003). Furthermore, we have shown specificity of the responses by using the IP3R and RyR blockers, Xes D and DAN, respectively (Stutzmann, 2005, Zalk, et al., 2007). Currently, there is no selective polycystin-2 inhibitor available, making it thus impossible to test any non-specific contribution of polycystin-2 to IP3-AM- or caffeine-induced Ca2+ responses pharmacologically. However, polycystin-2 channels require prolonged depolarization and Ca2+ induced activation to mediate Ca2+ release (Koulen, et al., 2002), making their involvement unlikely.
Using immunocytochemistry, we detected IP3R1-specific immunoreactivity in primary cultured rat ONHAs. The diffuse punctate staining pattern is characteristic of cytosolic and ER localization, as seen for IP3R1 in other cell types (Kaja, et al., 2011, Medina-Ortiz, et al., 2007). In contrast, IP3R2 immunoreactivity was very strong in the nuclear envelope, consistent with reports for other cell types (Kaja, et al., 2011, Koulen, et al., 2005, Leite, et al., 2003, Medina-Ortiz, et al., 2007). This is the first description of such a molecular substrate of differential subcellular Ca2+ signaling in astrocytes. Imaging of the intracellular Ca2+ concentration allowed us to quantify the functional contribution of IP3Rs to Ca2+ release. The maximum Ca2+ release for representative Ca2+ transients was calculated to be 654 nM, using the method originally described by Grynkiewicz and colleagues (Grynkiewicz, et al., 1985). Besides IP3Rs, we identified specific immunoreactivity for all subtypes of RyRs in cultured ONHAs. RyR2 immunoreactivity was reminiscent of nuclear envelope and Golgi staining, while RyR1 and RyR3 immunoreactivity was largely localized to the ER, and to a lesser extent to the nuclear envelope. Overall, the maximum Ca2+ release following caffeine stimulation was 566 nM, calculated using the same method (Grynkiewicz, et al., 1985).
We conclude that the major driving force of intracellular Ca2+ release are IP3Rs, specifically IP3R2 and to a lesser extent IP3R1, while RyR contribute to Ca2+ signaling through Ca2+-induced Ca2+ release, leading to the amplification of intracellular Ca2+ signals generated by IP3Rs or plasma membrane driven influx of Ca2+ (Berridge, 1998).
While the membranes of the ER and the nucleus are contiguous, the nuclear envelope comprises IP3-sensitive stores separate from those of the ER (Stehno-Bittel, et al., 1995). In neuronal cells, IP3Rs show a distinct expression profile with type 1 and type 3 expressed in the ER, while type 2 IP3Rs preferentially localize in the membranes of the nuclear envelope (Kaja, et al., 2011, Koulen, et al., 2005, Leite, et al., 2003). Our detailed subcellular quantification of Ca2+ transients, which showed significantly larger nuclear vs. cytosolic/ER transients, consistent with stronger IP3R2 expression in the nucleus. The higher levels of Ca2+ release were evident both at the level of the maximum amplitude and the integrated density of the Ca2+ transient. Furthermore, time to threshold was faster for nuclear vs. cytosolic transients. In this context it is important to note that IP3R2 possesses the highest ligand affinity of all IP3R subtypes, activating at concentrations well below those needed for IP3R1 and IP3R3 (Koulen and Thrower, 2001, Koulen, et al., 2005, Leite, et al., 2003) and while IP3R1 shows a pronounced inhibition by higher Ca2+ concentrations, IP3R2 do not inactivate as readily under conditions of prolonged high cytosolic Ca2+ concentrations (Koulen and Thrower, 2001). We have previously reported the selective up-regulation of IP3R2 under conditions of oxidative stress in neuronal HT-22 cells (Kaja, et al., 2011) indicating that the high physiological relevance of IP3R2 for normal ONHA Ca2+ signaling could become even more pronounced under disease conditions associated with oxidative stress. Of particular relevance, aberrant Ca2+ signaling has been described both in preclinical glaucoma models and glaucoma patients (reviewed in Crish and Calkins, 2011) and is considered a viable target for neuroprotection (Duncan, et al., 2010, Payne, et al., 2014, Payne, et al., 2013).
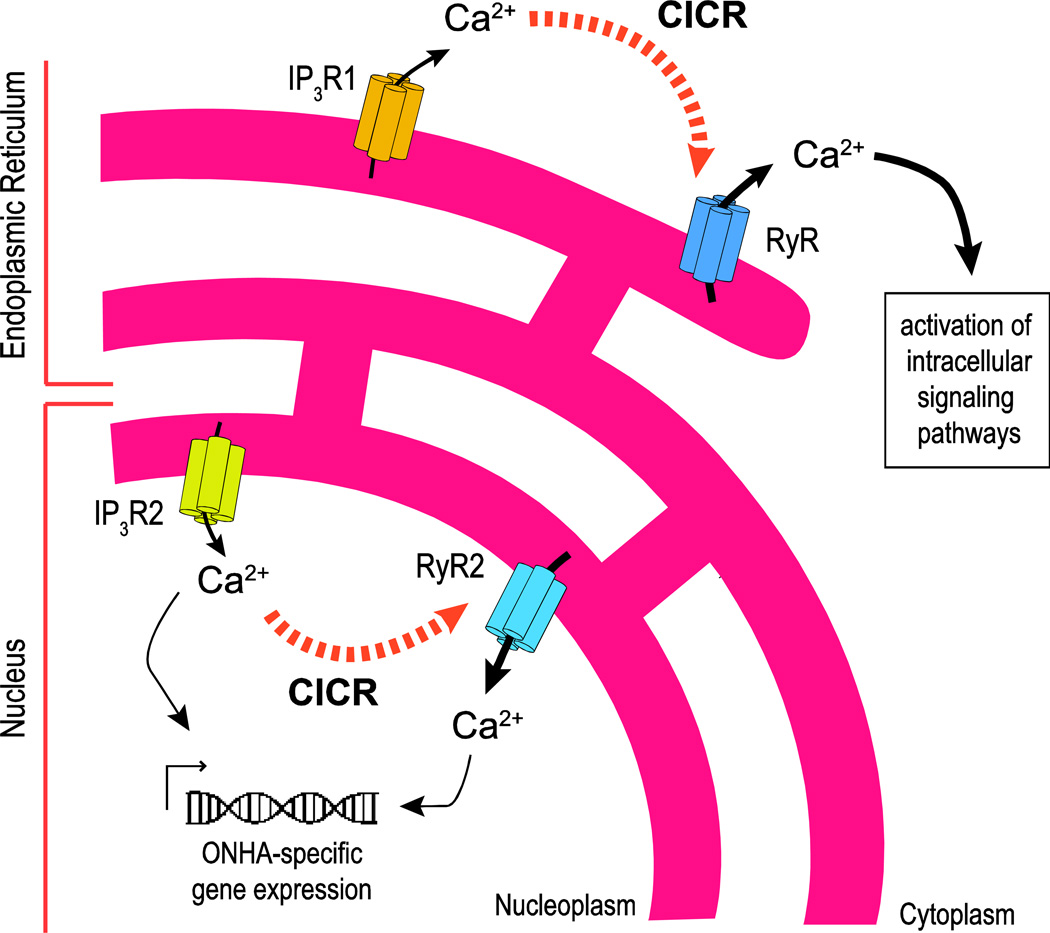
The subcellular quantification of RyR-mediated Ca2+ release did not reveal statistically significant differences between cytosolic regions and the nuclear envelope, i.e. there is a significant number of RyRs in the nuclear envelope that mediate Ca2+ release from dedicated nuclear stores. Nuclear RyR-elicited transients reached threshold and peak amplitude faster than cytosolic ones. To our knowledge this is the first report of differential nuclear vs. cytosolic RyR-mediated Ca2+ transients in primary cells. Based on the specific distribution of intracellular Ca2+ channels, and the subcellular quantification of Ca2+ transients, we conclude that IP3R2 signaling is linked to RyR2 mediated Ca2+ release from the nuclear envelope, while all RyR subtypes amplify IP3R1-specific Ca2+ signals from the ER (Fig. 8).
Figure 8. Schematic representation of intracellular Ca2+ signaling in primary cultured rat ONHAs – differential distribution of intracellular Ca2+ channels provides the molecular substrate for distinct and temporally and spatially independent subcellular Ca2+ signaling patterns.
IP3R2 is the major subtype of IP3Rs in ONHAs, expressed differentially in the membranes of the nuclear envelope, which are contiguous with the membranes of the ER. Ca2+ release from IP3R2 in the nuclear envelope into the nucleoplasm is amplified through RyR2 by Ca2+-induced Ca2+ release (CICR; black dotted arrows), leading to Ca2+-mediated regulation of gene expression. All types of RyR contribute to Ca2+ release into the ER via amplification of IP3R1-mediated Ca2+ release potentially mediating non-genomic functions of Ca2+signaling in ONHAs.
Taken together, IP3R2 is the major subtype of IP3Rs in ONHAs; Ca2+ release from the nuclear envelope is likely amplified through RyR2. This differential pattern of Ca2+ signaling in ONHAs therefore potentially regulates gene expression (Hwang, et al., 2009, Koulen, et al., 2008) (Fig. 8) to adapt to changes in the astrocytic milieu and synaptic signaling, in accordance with the generally accepted view of astrocytes contributing critically to synaptic signaling and homeostasis (Dallerac, et al., 2013).
Our current knowledge regarding signaling pathways in ONHAs upstream and downstream of intracellular Ca2+ release is very limited. However, intracellular Ca2+ release through endothelin A receptor activation (Murphy, et al., 2011) and Gq-mediated IP3 generation leading to activation of IP3Rs (Biber, et al., 1997) has been documented in primary cultures of rat ONHAs. Our results indicate that the molecular and functional framework for these phenomena is composed of a complex differentially distributed set of intracellular Ca2+ release channels, but more importantly have also direct mechanistic relevance to help explain reported changes in Ca2+ signaling in response to stress and/or injury. For instance, hydrostatic pressure-induced intracellular Ca2+ release has been found to occur via RyRs, resulting in extracellular signal-regulated kinase (Erk) phosphorylation (Mandal, et al., 2010), and to involve signaling pathways that control intracellular Ca2+ signaling effector proteins in assays measuring the migratory ability of ONHAs and potentially underlying ONH remodeling in glaucoma (Tezel, et al., 2001). In similar studies of human ONHAs in vitro, a molecular substrate responsible for differential Ca2+ signaling was inferred based on phenotypic studies and pharmacological activation of purinergic receptors (Chen, et al., 2009). Similarly, partial transection of the ON, a widely used model for ocular drug discovery, resulted in the dysregulation of Ca2+ homeostasis, increased levels of oxidative stress and increased immunoreactivity of both the GluR1 subunit of the α-amino-3-hydroxy-5-methyl-4-isoxazolepropionic acid receptor and aquaporin 4 (Wells, et al., 2012).
Conclusion
The data presented herein is the first report of quantification of intracellular Ca2+ signaling and its molecular correlates in ONHAs. ONHAs utilize a set of differentially distributed intracellular Ca2+ channels to control intracellular homeostasis. Our data provides a foundation for future studies investigating potential changes in Ca2+ signaling in ONHAs in glaucomatous retinopathy and other disorders affecting the optic nerve and optic nerve head.
Highlights.
First description of differential IP3R-mediated Ca2+ signaling in astrocytes.
IP3Rs are the major driving force of intracellular Ca2+ release in ONHAs.
Differentially-distributed RyRs in ONHAs contribute to Ca2+ signaling via CICR.
ONHAs have larger nuclear vs. cytosolic/ER Ca2+ transients.
Ca2+ signaling in ONHAs is a druggable target for glaucoma and related disorders.
Acknowledgements
Research reported in this publication was supported by grants from the National Eye Institute (EY014227 and EY022774), the Institute on Aging (AG010485, AG022550 and AG027956), the National Center for Research Resources and National Institute of General Medical Sciences (RR022570 and RR027093) of the National Institutes of Health (PK). The content is solely the responsibility of the authors and does not necessarily represent the official views of the National Institutes of Health. Additional support by the Felix and Carmen Sabates Missouri Endowed Chair in Vision Research, a Challenge Grant from Research to Prevent Blindness and the Vision Research Foundation of Kansas City is gratefully acknowledged.
The authors would like to thank Mark A. Moore and Bryan C. Gerdes for excellent technical assistance. The authors thank Margaret, Richard and Sara Koulen for generous support and encouragement.
Abbreviations
- AM
acetoxymethyl ester
- DAN
dantrolene
- ECS
extracellular solution
- IOP
intraocular pressure
- IP3R
inositol-1,4,5,-trisphosphate receptor
- ON
optic nerve
- ONHA
optic nerve head astrocyte
- Ph
Phalloidin
- RGC
retinal ganglion cell
- RyR
ryanodine receptor
- Xes D
Xestospongin D
Footnotes
Publisher's Disclaimer: This is a PDF file of an unedited manuscript that has been accepted for publication. As a service to our customers we are providing this early version of the manuscript. The manuscript will undergo copyediting, typesetting, and review of the resulting proof before it is published in its final citable form. Please note that during the production process errors may be discovered which could affect the content, and all legal disclaimers that apply to the journal pertain.
Conflict of interest:
No conflicting relationship exists for any author.
References
- 1.Beck A, Nieden RZ, Schneider HP, Deitmer JW. Calcium release from intracellular stores in rodent astrocytes and neurons in situ. Cell Calcium. 2004;35:47–58. doi: 10.1016/s0143-4160(03)00171-4. [DOI] [PubMed] [Google Scholar]
- 2.Berridge MJ. Neuronal calcium signaling. Neuron. 1998;21:13–26. doi: 10.1016/s0896-6273(00)80510-3. [DOI] [PubMed] [Google Scholar]
- 3.Biber K, Klotz KN, Berger M, Gebicke-Harter PJ, van Calker D. Adenosine A1 receptor-mediated activation of phospholipase C in cultured astrocytes depends on the level of receptor expression. The Journal of neuroscience : the official journal of the Society for Neuroscience. 1997;17:4956–4964. doi: 10.1523/JNEUROSCI.17-13-04956.1997. [DOI] [PMC free article] [PubMed] [Google Scholar]
- 4.Chen L, Lukas TJ, Hernandez MR. Hydrostatic pressure-dependent changes in cyclic AMP signaling in optic nerve head astrocytes from Caucasian and African American donors. Mol Vis. 2009;15:1664–1672. [PMC free article] [PubMed] [Google Scholar]
- 5.Cornell-Bell AH, Finkbeiner SM, Cooper MS, Smith SJ. Glutamate induces calcium waves in cultured astrocytes: long-range glial signaling. Science. 1990;247:470–473. doi: 10.1126/science.1967852. [DOI] [PubMed] [Google Scholar]
- 6.Crish SD, Calkins DJ. Neurodegeneration in glaucoma: progression and calcium-dependent intracellular mechanisms. Neuroscience. 2011;176:1–11. doi: 10.1016/j.neuroscience.2010.12.036. [DOI] [PMC free article] [PubMed] [Google Scholar]
- 7.Dallerac G, Chever O, Rouach N. How do astrocytes shape synaptic transmission? Insights from electrophysiology. Front Cell Neurosci. 2013;7:159. doi: 10.3389/fncel.2013.00159. [DOI] [PMC free article] [PubMed] [Google Scholar]
- 8.Duncan RS, Goad DL, Grillo MA, Kaja S, Payne AJ, Koulen P. Control of intracellular calcium signaling as a neuroprotective strategy. Molecules. 2010;15:1168–1195. doi: 10.3390/molecules15031168. [DOI] [PMC free article] [PubMed] [Google Scholar]
- 9.Gleichmann M, Mattson MP. Neuronal calcium homeostasis and dysregulation. Antioxid Redox Signal. 2011;14:1261–1273. doi: 10.1089/ars.2010.3386. [DOI] [PMC free article] [PubMed] [Google Scholar]
- 10.Grynkiewicz G, Poenie M, Tsien RY. A new generation of Ca2+ indicators with greatly improved fluorescence properties. J Biol Chem. 1985;260:3440–3450. [PubMed] [Google Scholar]
- 11.Haworth RA, Redon D. Calibration of intracellular Ca transients of isolated adult heart cells labelled with fura-2 by acetoxymethyl ester loading. Cell Calcium. 1998;24:263–273. doi: 10.1016/s0143-4160(98)90050-1. [DOI] [PubMed] [Google Scholar]
- 12.Hernandez MR. The optic nerve head in glaucoma: role of astrocytes in tissue remodeling. Prog Retin Eye Res. 2000;19:297–321. doi: 10.1016/s1350-9462(99)00017-8. [DOI] [PubMed] [Google Scholar]
- 13.Hwang JY, Duncan RS, Madry C, Singh M, Koulen P. Progesterone potentiates calcium release through IP3 receptors by an Akt-mediated mechanism in hippocampal neurons. Cell Calcium. 2009;45:233–242. doi: 10.1016/j.ceca.2008.10.006. [DOI] [PMC free article] [PubMed] [Google Scholar]
- 14.Kaja S, Duncan RS, Longoria S, Hilgenberg JD, Payne AJ, Desai NM, Parikh RA, Burroughs SL, Gregg EV, Goad DL, Koulen P. Novel mechanism of increased Ca2+ release following oxidative stress in neuronal cells involves type 2 inositol-1,4,5-trisphosphate receptors. Neuroscience. 2011;175:281–291. doi: 10.1016/j.neuroscience.2010.11.010. [DOI] [PMC free article] [PubMed] [Google Scholar]
- 15.Kaja S, Hilgenberg JD, Rybalchenko V, Medina-Ortiz WE, Gregg EV, Koulen P. Polycystin-2 expression and function in adult mouse lacrimal acinar cells. Invest Ophthalmol Vis Sci. 2011;52:5605–5611. doi: 10.1167/iovs.10-7114. [DOI] [PMC free article] [PubMed] [Google Scholar]
- 16.Kaja S, Mafe OA, Parikh RA, Kandula P, Reddy CA, Gregg EV, Xin H, Mitchell P, Grillo MA, Koulen P. Distribution and function of polycystin-2 in mouse retinal ganglion cells. Neuroscience. 2012;202:99–107. doi: 10.1016/j.neuroscience.2011.11.047. [DOI] [PMC free article] [PubMed] [Google Scholar]
- 17.Koulen P, Cai Y, Geng L, Maeda Y, Nishimura S, Witzgall R, Ehrlich BE, Somlo S. Polycystin-2 is an intracellular calcium release channel. Nat Cell Biol. 2002;4:191–197. doi: 10.1038/ncb754. [DOI] [PubMed] [Google Scholar]
- 18.Koulen P, Janowitz T, Johnston LD, Ehrlich BE. Conservation of localization patterns of IP(3) receptor type 1 in cerebellar Purkinje cells across vertebrate species. J Neurosci Res. 2000;61:493–499. doi: 10.1002/1097-4547(20000901)61:5<493::AID-JNR3>3.0.CO;2-9. [DOI] [PubMed] [Google Scholar]
- 19.Koulen P, Madry C, Duncan RS, Hwang JY, Nixon E, McClung N, Gregg EV, Singh M. Progesterone potentiates IP(3)-mediated calcium signaling through Akt/PKB. Cell Physiol Biochem. 2008;21:161–172. doi: 10.1159/000113758. [DOI] [PubMed] [Google Scholar]
- 20.Koulen P, Thrower EC. Pharmacological modulation of intracellular Ca(2+) channels at the single-channel level. Mol Neurobiol. 2001;24:65–86. doi: 10.1385/MN:24:1-3:065. [DOI] [PubMed] [Google Scholar]
- 21.Koulen P, Wei J, Madry C, Liu J, Nixon E. Differentially distributed IP3 receptors and Ca2+ signaling in rod bipolar cells. Invest Ophthalmol Vis Sci. 2005;46:292–298. doi: 10.1167/iovs.04-0939. [DOI] [PubMed] [Google Scholar]
- 22.Leite MF, Thrower EC, Echevarria W, Koulen P, Hirata K, Bennett AM, Ehrlich BE, Nathanson MH. Nuclear and cytosolic calcium are regulated independently. Proc Natl Acad Sci U S A. 2003;100:2975–2980. doi: 10.1073/pnas.0536590100. [DOI] [PMC free article] [PubMed] [Google Scholar]
- 23.Mandal A, Shahidullah M, Delamere NA. Hydrostatic pressure-induced release of stored calcium in cultured rat optic nerve head astrocytes. Invest Ophthalmol Vis Sci. 2010;51:3129–3138. doi: 10.1167/iovs.09-4614. [DOI] [PMC free article] [PubMed] [Google Scholar]
- 24.Medina-Ortiz WE, Gregg EV, Brun-Zinkernagel AM, Koulen P. Identification and functional distribution of intracellular ca channels in mouse lacrimal gland acinar cells. Open Ophthalmol J. 2007;1:8–16. doi: 10.2174/1874364100701010008. [DOI] [PMC free article] [PubMed] [Google Scholar]
- 25.Muller MS, Obel LF, Waagepetersen HS, Schousboe A, Bak LK. Complex actions of ionomycin in cultured cerebellar astrocytes affecting both calcium-induced calcium release and store-operated calcium entry. Neurochemical research. 2013;38:1260–1265. doi: 10.1007/s11064-013-1021-4. [DOI] [PubMed] [Google Scholar]
- 26.Murphy JA, Archibald ML, Baldridge WH, Chauhan BC. Endothelin-1-induced proliferation is reduced and Ca(2)(+) signaling is enhanced in endothelin B-deficient optic nerve head astrocytes. Invest Ophthalmol Vis Sci. 2011;52:7771–7777. doi: 10.1167/iovs.11-7699. [DOI] [PubMed] [Google Scholar]
- 27.Murphy JA, Archibald ML, Chauhan BC. The role of endothelin-1 and its receptors in optic nerve head astrocyte proliferation. Br J Ophthalmol. 2010;94:1233–1238. doi: 10.1136/bjo.2009.172098. [DOI] [PubMed] [Google Scholar]
- 28.Nag S. Morphology and properties of astrocytes. Methods Mol Biol. 2011;686:69–100. doi: 10.1007/978-1-60761-938-3_3. [DOI] [PubMed] [Google Scholar]
- 29.Payne AJ, Gerdes BC, Naumchuk Y, McCalley AE, Kaja S, Koulen P. Presenilins regulate the cellular activity of ryanodine receptors differentially through isotype-specific N-terminal cysteines. Exp Neurol. 2013;250C:143–150. doi: 10.1016/j.expneurol.2013.09.001. [DOI] [PMC free article] [PubMed] [Google Scholar]
- 30.Payne AJ, Kaja S, Naumchuk Y, Kunjukunju N, Koulen P. Antioxidant drug therapy approaches for neuroprotection in chronic diseases of the retina. Int J Mol Sci. 2014;15:1865–1886. doi: 10.3390/ijms15021865. [DOI] [PMC free article] [PubMed] [Google Scholar]
- 31.Payne AJ, Kaja S, Sabates NR, Koulen P. A case for neuroprotection in ophthalmology: developments in translational research. Mo Med. 2013;110:429–436. [PMC free article] [PubMed] [Google Scholar]
- 32.Quigley HA. Glaucoma. Lancet. 2011;377:1367–1377. doi: 10.1016/S0140-6736(10)61423-7. [DOI] [PubMed] [Google Scholar]
- 33.Stehno-Bittel L, Luckhoff A, Clapham DE. Calcium release from the nucleus by InsP3 receptor channels. Neuron. 1995;14:163–167. doi: 10.1016/0896-6273(95)90250-3. [DOI] [PubMed] [Google Scholar]
- 34.Stutzmann GE. Calcium dysregulation, IP3 signaling, and Alzheimer’s disease. Neuroscientist. 2005;11:110–115. doi: 10.1177/1073858404270899. [DOI] [PubMed] [Google Scholar]
- 35.Tezel G, Hernandez MR, Wax MB. In vitro evaluation of reactive astrocyte migration, a component of tissue remodeling in glaucomatous optic nerve head. Glia. 2001;34:178–189. doi: 10.1002/glia.1052. [DOI] [PubMed] [Google Scholar]
- 36.Tiffert T, Garcia-Sancho J, Lew VL. Irreversible ATP depletion caused by low concentrations of formaldehyde and of calcium-chelator esters in intact human red cells. Biochim Biophys Acta. 1984;773:143–156. doi: 10.1016/0005-2736(84)90559-5. [DOI] [PubMed] [Google Scholar]
- 37.Tong X, Shigetomi E, Looger LL, Khakh BS. Genetically encoded calcium indicators and astrocyte calcium microdomains. Neuroscientist. 2013;19:274–291. doi: 10.1177/1073858412468794. [DOI] [PubMed] [Google Scholar]
- 38.Venance L, Stella N, Glowinski J, Giaume C. Mechanism involved in initiation and propagation of receptor-induced intercellular calcium signaling in cultured rat astrocytes. The Journal of neuroscience : the official journal of the Society for Neuroscience. 1997;17:1981–1992. doi: 10.1523/JNEUROSCI.17-06-01981.1997. [DOI] [PMC free article] [PubMed] [Google Scholar]
- 39.Wells J, Kilburn MR, Shaw JA, Bartlett CA, Harvey AR, Dunlop SA, Fitzgerald M. Early in vivo changes in calcium ions, oxidative stress markers, and ion channel immunoreactivity following partial injury to the optic nerve. J Neurosci Res. 2012;90:606–618. doi: 10.1002/jnr.22784. [DOI] [PubMed] [Google Scholar]
- 40.Worley PF, Baraban JM, Colvin JS, Snyder SH. Inositol trisphosphate receptor localization in brain: variable stoichiometry with protein kinase C. Nature. 1987;325:159–161. doi: 10.1038/325159a0. [DOI] [PubMed] [Google Scholar]
- 41.Yan E, Li B, Gu L, Hertz L, Peng L. Mechanisms for L-channel-mediated increase in [Ca(2+)]i and its reduction by anti-bipolar drugs in cultured astrocytes combined with its mRNA expression in freshly isolated cells support the importance of astrocytic L-channels. Cell Calcium. 2013;54:335–342. doi: 10.1016/j.ceca.2013.08.002. [DOI] [PubMed] [Google Scholar]
- 42.Zalk R, Lehnart SE, Marks AR. Modulation of the ryanodine receptor and intracellular calcium. Annu Rev Biochem. 2007;76:367–385. doi: 10.1146/annurev.biochem.76.053105.094237. [DOI] [PubMed] [Google Scholar]


