

Abstract
The goal of the current analysis was to examine the maturation of cortical auditory evoked potentials (CAEPs) from three months of age to eight years of age. The superior frontal positive-negative-positive sequence (P1, N2, P2) and the temporal site, negative-positive-negative sequence (possibly, Na, Ta, Tb of the T-complex) were examined. Event-related potentials were recorded from 63 scalp sites to a 250- ms vowel. Amplitude and latency of peaks were measured at left and right frontal sites (near Fz) and at left and right temporal sites (T7 and T8). In addition the largest peak (typically corresponding to P1) was selected from global field power (GFP). The results revealed a large positive peak (P1) easily identified at frontal sites across all ages. The N2 emerged after 6 months of age and the following P2 between 8 and 30 months of age. The latencies of these peaks decreased exponentially with the most rapid decrease observed for P1. For amplitude, only P1 showed a clear relationship with age, becoming more positive in a somewhat linear fashion. At the temporal sites only a negative peak, which might be Na, was clearly observed at both left and right sites in children older than 14 months and peaking between 100 and 200 ms. P1 measures at frontal sites and Na peak latencies were moderately correlated. The temporal negative peak latency showed a different maturational timecourse (linear in nature) than the P1 peak, suggesting at least partial independence. Distinct Ta (positive) and Tb (negative) peaks, following Na and peaking between 120 and 220 ms were not consistently found in most age groups of children, except Ta which was present in 7 year olds. Future research, which includes manipulation of stimulus factors, and use of modeling techniques will be needed to explain the apparent, protracted maturation of the temporal site measures in the current study.
1. Introduction
The maturational timecourse of cortical Auditory Evoked Potentials (CAEP) has become an increasing focus of interest because it has become clear that a number of developmental disorders include deficits in auditory processing, and these deficits can be reflected in CAEPs. The focus of the current paper is on the CAEPs recorded at the frontal and temporal sites. An increasing number of studies have examined maturation of CAEPs at frontal sites (e.g., Sharma, et al., 1997; Ponton, et al., 2000, Ceponiene, et al., 2002; Kushnerenko, et al., 2002; Sussman et al. 2008; 2011; Choudhury & Benasich, 2011; Sharma, et al., 2014, this issue), and at temporal sites (e.g., Tonnquist-Uhlen, et al., 2003; Pang & Taylor, 2000, Ceponiene, et al., 1998; Groen, et al., 2008; Shafer, et al., 2011b; Bishop, et al., 2012; Mahajan & MacArthur, 2013; however, no studies have compared maturation of frontal and temporal CAEPs from infancy through childhood.
1.1. Frontal site CAEPs
CAEPs recorded at the frontal central sites include the obligatory sequence of peaks, P1, N1b, P2, in adults and an additional N2 peak in children. Dipole modeling suggests that the P1-N1-P2-N2 peaks have primary sources in the superior plane of auditory cortex (Näätänen & Picton, 1987; Scherg & Von Cramon, 1986; Ponton, et al., 2002).
At rapid rates of presentation (under 1 sec) the adult N1b-P2 sequence is attenuated and the P1 (also called P100), peaking between 50 and 200 ms, followed by N2 (also called N250), peaking between 150 and 300 ms, dominate the response at fronto-central sites in both infants (Kushnerenko, et al., 2002; Choudhury & Benasich, 2011; Shafer, et al., 2011a), and older children (e.g., Ponton, et al., 2000; Shafer, et al., 2000; Ceponiene, et al., 2002; Sussman, et al., 2008; Shafer, et al., 2010). P1 and/or N2 have been examined in a number of maturational studies (e.g., Kusherenko, et al., 2002; Ponton, et al., 2000; Ceponiene, et al., 2002; Sussman et al., 2008; Choudhury & Benasich, 2011; Shafer, et al., 2011). These studies have observed earlier latencies for the P1 peak at older compared to younger ages, but changes in amplitude are less clear (Kushnerenko, et al., 2002; Ponton, et al., 2002; Sussman, et al., 2008), although P1 amplitude is larger in children than adults (e.g., Ponton, et al., 2000; Sussman et al., 2008). The reported changes in latency and amplitude for the N2 peak across childhood are inconsistent across studies. The N2 peak appears to be considerably smaller in amplitude and more difficult to identify in infancy (Kushnerenko, et al., 2002) compared to childhood (e.g., Ceponiene, et al., 2002); but N2 is considerably larger in amplitude in children than teenagers and adults (Ponton, et al., 2000; Ceponiene, et al., 2002; Sussman et al., 2008). For N2 latency, some studies have found increases in latency with increasing age (e.g., Martin, et al., 1988; Ponton,et al., 2000) and others have observed decreases in latency with increasing age (e.g., Cunningham, et al., 2000).
Several studies have found differences in P1 amplitude, latency and/or morphology between typically-developing children and children with altered auditory experience (e.g., cochlear implants; Sharma et al., 2014 for review) or developmental disorders (e.g., Bishop et al.2012; Shafer, et al., 2007; Choudhury & Benasich, 2011; Lovio et al, 2010). Studies have also found differences between clinical and control children for the N2 (e.g., Choudhury & Benasich, 2011). One explanation for these differences is maturational delays in the sources underlying the CAEPs measured at frontal sites (e.g., Bishop & MacArthur, 2005; Shafer, et al., 2007)
1.2. Temporal Site CAEPs
Temporal site CAEPs in adults and older children consist of a series of three peaks called the T-complex found between 50 and 300 ms, which are elicited in response to an auditory stimulus. These peaks are typically measured at lateral temporal sites, T7 and T8 (10-10 system, previously named T3 and T4 in the 10-20 system), which are placed approximately 1- to 2 cm above each ear. These peaks have been termed Na, Ta and Tb (or N1c), respectively, with Na and Tb showing negative polarity (with respect to a nose or average reference) and Ta showing positivity polarity (Näätänen & Picton, 1987; Connolly, 1993; Tonnquist-Uhlen et al., 2003; Wolpaw & Penry, 1975). Dipole modeling suggests that the primary underlying sources of the T-complex peaks Ta and Tb are in lateral aspects of auditory cortex and that these sources differ from the primary sources for the obligatory components, P1 and N1b (Näätänen & Picton, 1987; Scherg & Von Cramon, 1986; Howard, et al., 2000; Ponton, et al. 2002; Bishop et al., 2011).
T-complex peaks have been examined in children as young as three- to four years of age (Bruneau, et al., 1997; 1999; Pang & Taylor, 2000), and a few studies have examined maturation across different age-spans. Several of these studies have found that with increasing age, latency decreases for the Na peak (Pang & Taylor, 2000; Tonnquist-Uhlen, et al., 2003), for the Ta peak (Albrecht, et al., 2000) and for the Tb peak (Gomes, et al., 2001). However, some studies have not seen this pattern, finding no difference in latency of Ta (Tonnquist-Uhlen, et al., 2003, Bishop et al., 2011) and Tb (Pang & Talor, 2000; Tonnquist-Uhlen, et al., 2003) compared to adult controls. Most of these studies have shown decreases in amplitude for the Na (Pang & Taylor, 2000; Tonnquist-Uhlen, et al., 2003) and Tb peaks (Albrecht, et al., 2000, Pang & Taylor, 2000; Tonnquist-Uhlen, et al., 2003; Bishop et al., 2011). The findings for amplitude have been more variable, with Ta shown to decrease (Albrecht et al., 2000; Bishop, et al., 2011) or not to differ across age (Ponton, et al., 2002).
The current interest in the maturation of lateral temporal site CAEPs is related to a number of studies finding atypical responses in children with developmental disorders; these atypical patterns are seen as attenuated amplitudes, delayed latencies and/or poor waveform morphology (e.g., Mason & Mellor, 1984; Tonnquist-Uhlen et al. 1996; Shafer, et al. 2011b; Bishop et al., 2012). In addition, studies of other disorders, such as Autism and Down's Syndrome, have found atypical temporal site CAEPs (Bruneau, et al., 1999; Dunn & Bates, 2005; Groen, et al., 2008). Several of these studies have speculated that the atypical responses may be indications of delayed maturation (e.g., Shafer, et al., 2011).
In summary, this pattern of development suggests that children under five years of age might show more positive peak amplitudes for the Ta peak (measured relative to a prestimulus baseline) and more negative peak amplitudes for Na and Tb, compared to their older peers. In addition, younger children would be expected to have later latencies for these peaks. Considering that older children with Specific Language Impairment (SLI) showed attenuated Ta amplitude (Shafer, et al., 2011b, Bishop et al., 2012), it is of considerable interest to determine how Ta amplitudes are modulated by maturation in typically-developing children.
1.3 Hemispheric Differences in Temporal Site CAEPs
A few of the papers examining the T-complex peaks in children have observed differences in amplitude, latency or variability related to hemisphere (e.g., Tonnquist-Uhlen, et al., 1996; Shafer, et al., 2011b) or have observed significant differences between language impaired and typical controls over one, but not both hemispheres (e.g., left temporal site, Mason & Mellor, 1984). Pang and Taylor (2000) found greater right than left amplitude for the Na peak to speech in children from three to 12 years of age and then a reverse in asymmetry for older ages. Shafer and colleagues (2011b) found larger Ta peak amplitudes at right compared to left sites and generally found less variability in T-complex measures at the right site. Hemispheric differences could not be evaluated in several other studies examining the T-complex because stimuli were delivered monaurally (e.g., left ear: Tonnquist-Uhlen, et al., 2003; right ear: Albrecht, et al., 2000). These findings across studies suggest that maturation of CAEPs should be evaluated at both left and right sites.
1.4 The present study
To date, no study has systematically examined temporal site CAEPs in children under the age of three years. In addition, only one study has examined CAEPs from 6 months to four years of age (Choudhury & Benasich, 2011) and this study focused only on frontal site CAEPs.
The present study examined the maturation of CAEP peaks elicited by a vowel stimulus in typically-developing children between the ages of three months and eight years. All children were from monolingual English speaking homes. ERPs were elicited to a 250-ms vowel stimulus [ε] (as in the word “bet”). This vowel was also used in a previous experiment with 8-10 year-old children (Datta, et al., 2010; Shafer, et al., 2007; Shafer et al., 2011b). This previous study had several different design features and used a different amplifier system (Neuroscan, Inc.) and electrode montage (31 scalp sites, 10-10 placement). The current study sampled from 65 sites, arranged geodesically (Geodesic Inc.), which included electrodes within 0.5 cm of the 10-10 positions for T7 and T8 (T3 and T4 in the 10-20 system) and within 1 cm of Fz (left, site 8, right site 3). In addition, in the current experiment, the vowel stimuli were presented free field from speakers, rather than using ear inserts. The stimuli were also presented using a different oddball design, using a sequence of ten stimuli with two, deviant [I] vowels in each sequence and a longer ISI between sequences (Shafer, et al., 2012). The free-field presentation was likely to affect amplitudes and latencies, since perceived loudness and ambient background noise differ from what would be found for ear-insert presentation. In particular, the latencies of the CAEP peaks were expected to be later for free field than ear inserts for the same stimuli, since previous research has shown later latencies for less intense sounds (Bruneau et al., 1999; Cacace et al., 1988; Connolly, 1993). The current study also recorded responses from adults to serve as a reference for the endpoint of development; in addition, the adult data will help interpret any differences across studies that might be related to differences in instrumentation and stimulus delivery.
The following questions and predictions were addressed:
Do the latencies of the CAEP peaks shift earlier in time with increasing age? Many of the previous studies found decreasing latency for these peaks with increasing age, and, thus, we predicted this pattern.
Are the amplitudes of the CAEP peaks modulated by age? Previous studies have shown inconsistent findings regarding amplitude. We predict that amplitude for CAEPs peaks will not correlate with age in a linear fashion, although it may differ between some age groups.
Do the latencies and amplitudes of the temporal site CAEPs follow a different developmental timecourse than those found for the frontal sites CAEPs? Previous analyses with older children indicate different underlying sources for the obligatory CAEPs recorded at frontocentral sites versus those measured at the temporal sites, suggesting that a difference in developmental timecourse may be observed. We predicted no more than weak correlations between frontal and temporal site peak latencies.
Are the patterns at left and right temporal sites similar? Several previous studies suggest different maturational trajectories at the left and right temporal sites. In particular, we predicted that the children would show more robust peaks at the right than the left temporal sites, similar to previous studies using speech.
2. Method
The experiment reported here was approved by The Graduate Center, CUNY Internal Review Board.
2.1 Participants
Fifty-nine monolingual children were recruited between the ages of three months and four years of age. Ten children were not included in the analyses for the following reasons: three were tested using a different paradigm, three refused to be tested, two showed indications of language impairment, and two had missing or corrupt data files. Of the remaining forty-nine children, 25 were male and 24 were female. Ninety data sessions are included in this analysis with 19 of the children being tested two to six times at different ages in a longitudinal design (8 males, 11 females) and 30 children tested at one age (17 males, 13 females). The pre-school children ranged in age from 93 days (3 months) to 1409 days (46 months). These data are the same as reported in Shafer, et al. (2011a), except that several additional children were added to the study and some children returned at later ages (73 monolingual sessions were used in Shafer, et al., 2011a).
Twenty-seven children (14 males) between four and eight years of age were recruited (nine children in addition to the 18 reported in Shafer, et al., 2010). Five of the children were tested at more than one age (each session at least one year apart; two data points for three participant, three data points for one participant, and five data points for one participant). A total of 36 sessions were collected from children. Note that the one participant who was tested five times was tested within two weeks of his birthday from four to eight years of age. In addition, five of these 27 children had been tested at one or more times before the age of four years (three at one younger age, one at two younger ages, and two at five and six time points, respectively, between 3 months and four years of age). Fourteen adult participants (24-40 years) were also tested and served to identify the endpoint of development.
All participants were typically developing and showed language scores within the normal range on standardized tests (Preschool Language Scales-4 for children under three years of age; Peabody Picture Vocabulary Test-3 for children older than three years of age, and Clinical Evaluation of Language Fundamentals-4 for children four years of age and older) (3-47 months, mean standard score for all language tests = 101, SD = 12.3; 4 – 8 years, mean standard for all language tests across participants = 110, SD =10). Participants older than three years of age passed a hearing screening. Children and adult were monolingual and were without histories (or family histories) of language impairment or developmental disorder.
2.2 Stimuli
Two, 250-ms re-synthesized vowels [ε], as in “bet” and [I] as in “bit” that differed in F1 and F2 formant frequencies (F1, 650 Hz, 500 Hz, F2: 1980 Hz, 2160 Hz, respectively) were used (Shafer, et al., 2007; Datta, et al., 2010; Shafer, et al., 2011). The analyses in the current paper focused on ERP responses to the [ε] stimulus, which served as the standard stimulus in the study (80% of trials). Participants received 1600 standard trials. The stimuli were presented at 86.5 dB SPL free-field over two speakers, located 1 m in front of and 1 m slightly above and behind the child's head.
2.3 ERP Procedures
A 65-channel EGI geodesic net (63 channels for children under four years of age; Eugene, Oregon, see Figure 1 for site locations), which evenly distributes electrodes across the scalp, was placed on the participants' head. The vertex (Cz) served as the reference during data collection and a right-posterior inferior electrode as the ground. The impedances of electrodes were maintained at or below 50 kOhms (acceptable for amplifiers with input impedance of 200 MegaOhms).
Figure 1.

Electrode montage for the Geodesic Net. Site 24 and site 52 are labeled T7 and T8, respectively. Site 8 (left of Fz) and site 3 (right of Fz) were used in the analyses. The triangle represents the nose and the crescents represent the ears.
The electroencephalogram (EEG) was recorded using Netstation amplifiers and Netstation 4.1 software at a 250-Hz sampling rate and 0.1 to 30 Hz bandpass. The EEG was time-locked to the onset of the vowel stimulus. The stimuli were delivered (via Eprime software) in sequences of 10 stimuli with an ISI of 350 ms between stimuli in the sequence (stimulus onset asynchrony, SOA, of 600 ms), and 1500 ms between each sequence of 10. A total of 1600 standards (80%) and 400 deviants (20%) were delivered. The standard stimuli used in the current analysis were in positions four through 10 and never followed a deviant stimulus.
Infants and toddlers were seated in a booster seat or on their caretaker's lap. Young children watched a video with muted sound to keep them content and compliant for the 45-minutes of the study (Shafer, et al., 2011a). Older children (who could read) and adults watched a video with muted sound and written subtitles.
2.4 Analysis
The continuous EEG was segmented with a pre-stimulus interval of 200 ms and 800 ms post-stimulus interval and baseline corrected using the pre-stimulus 100 ms mean amplitude. Epochs with electrical activity exceeding +/- 140 μV at any electrode site were rejected (+/- 70 μV for adults), and bad channels (i.e, bad on =/< 20% of trials) were replaced by spline interpolation. The data were re-referenced to an average reference (excluding eye channels) for further analysis. The first three standards in the sequence of ten were excluded, as well as standards following a deviant (leaving 1000 standard trials). The mean number of trials for the standard after artifact reject for the three- to 46- month-old participants was 601 (SD = 217) and for the four to eight year olds was 654 (SD = 158). Epochs (-200 to 800 ms) were averaged for the standard for each participant.
Global field power (standard deviation calculated across the electrode sites) was calculated. In general, only one peak was clearly delineated in GFP and this peak appeared to correspond to the large positive (P1) peak observed at frontal sites. The peak latency of the largest GFP peak was identified for each participant as the highest amplitude peak between 50 and 300 ms. In all but a few cases there was one clear peak. In those cases where there were two possible peaks of similar amplitude, the ERPs at frontal sites were plotted and the peak corresponding to a positivity at Fz and Cz was identified. A peak in this latency range was readily identified from GFP for all but one participant (a 12 month old).
The sequence of peaks observed at frontal sites to the left (site 8) and right (site 3) of Fz were identified for each participant. Site 8 and site 3 were selected because the P1 obligatory peak is largest at the frontal sites near Fz and we wanted left and right frontal measures to compare to left and right temporal measures.
For infants and children, the most positive peak (P1) was found between 110 and 270 ms for infants and children; the following negative-going peak (N2) was identified as the most negative peak between 220 and 388 ms (the window was determined from the grand means). This N2 was followed by a positive going deflection (which we will call P2). The P2 was identified as the most positive peak (following P1) between 250 and 410 ms.
The adults showed a different sequence of peaks consisting of P1, N1 and P2, followed by a very small negative deflection (N2). The first positive peak, P1, fell between 80 and 140 ms. The N1 peak was found between 110 and 160 ms in adults (mean = 140 ms, SD = 16 averaged across site 3 and site 8). We will not examine this peak further since in is not found in children when stimuli are presented at the fast rate used in the current study. The P2 in adults peaked between 164 and 224 ms (mean = 191 ms, SD=16). The P2 peak in adults precedes the N2, and it is unclear how it is related to the P2 peak in the children. The subsequent negative-going peak was very small in adults. A negative peak between 230 and 300 ms could be identified for all but one adult (mean= 266 ms, SD=24). There were often subsequent negative peaks between 300 and 600 ms, as the waveform returned to baseline, but the grand mean waveforms of the GFP did not indicate any clear latency range for selecting a later peak.
Temporal site peaks were identified from T8 (site 52) and T7 (site 24) for each participant. The most negative peak was generally found between 90 and 200 ms. Many participants showed a double-peaked negativity in this interval. Infants under approximately 14 months of age typically showed a double-peaked negativity in which the second peak was more negative, but this second peak corresponded to the P1 latency. In these cases, the earlier peak was selected and labeled as Na, the following positive-going peak was labeled Ta (generally very small in infants) and the subsequent negative-going peak as Tb. With increasing age, the Na peak could be identified with greater certainty in individuals. The Ta and Tb peaks were not easily identified in about 1/3 of the participants. More specifically, in some of the cases there was no peak or only a change in slope in the latency range of the Ta or Tb that might indicate emergence of these peaks. These cases were counted as absent peaks in our analyses. In a few cases there was a clear peak that was well outside of the latency range for children of the same age. These early or late peak values were counted as absent when calculating percentages of each age range showing the peak. However, the peak latencies were included in the correlational analyses with age and with the P1 peak latency.
The relationship between age and peak latency was examined for P1, N2 and P2 at the left (site 8) and right frontal (site 3) electrodes and for Na, Ta and Tb at the left (T7-site 24) and right (T8-site 52) electrodes using Pearson's r. In addition, the relationship between the latency of the most prominent peak identified using GFP and the P1 peak latency at site 3 and site 8 was examined. Finally, the relationship between the P1 peak measures (at site 8 and site 3) and the temporal site measures (at site 24 and site 52) were examined. Only cases that showed identifiable peaks (including early and late peaks) were included in these comparisons. We also examined the relationship between age and peak amplitude for these peak measures (P1, P2, N2, Na, Ta, Tb).
Two-tailed t-tests were used to compare age groups to help explain the pattern of maturation shown by the curve fits. We decided not to use ANOVAs because our decision about where to divide the children into age groups was somewhat arbitrary and the number of cases for various peaks differed because some peaks were unclear, particularly at younger ages. We compared groups that were well separated in age (e.g., children from 3-5 months vs. 8-14 months) as well as adjacent age ranges (e.g., 3-5 vs. 6-8 months) for various peak measures, but in some cases we had to collapse age groups, if there were insufficient cases in a narrower age range.
3. Results
3.1. Frontal site peaks
Figure 2 shows grand means for each age group from three months of age to seven years of age at frontal sites. Adults are also displayed and serve as a reference for the endpoint of maturation. Infants and children showed a large positive peak (P1) that decreased in latency with increasing age. It also increased in amplitude up to four years of age. Following this P1 peak, infants and children showed a negative (N2) peak that shifted earlier in time up to three years of age. The children older than approximately seven months of age also showed a positive peak (P2) following the N2 peak. The P2 appears to shift earlier from 18 to 24 months of age, but to change little between 24 months and 8 years of age. Table 1 provides the proportion of children who showed clear P1, N2 and P2 peaks for each of the age ranges. The latency of the P1, N2 and P2 peaks measures were highly correlated between the left (site 8) and right (site 3) locations (r = 0.96, 0.98 and 0.91, respectively). Table 2 provides the means and standard deviations for the peak latency for each age range, averaged across the two sites.
Figure 2.
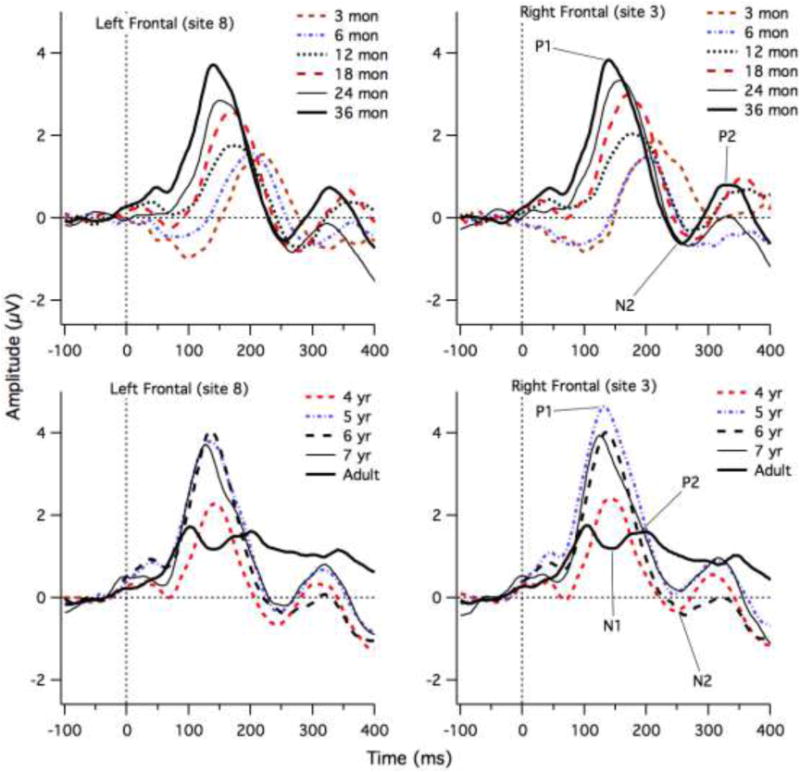
Grand Mean ERP waveforms for each age group at left frontal (site 8) and right frontal (site3) electrodes. The P1, N2 and P2 peaks are shown for some age groups to illustrate the approximate latencies.
Table 1.
Percentage of children in each age group with clearly identifiable peaks for P1, N2 and P2 and left frontal (site 8) and right frontal (site 3) electrode.
| Group | N | P1 GFP | Left P1 | Left N2 | Left P2 | Right P1 | Right N2 | Right P2 |
|---|---|---|---|---|---|---|---|---|
| 3-6 months | 10 | 100% | 100% | 50% | 50% | 80% | 50% | 50% |
| 6-8 months | 19 | 100% | 100% | 84% | 68% | 100% | 84% | 68% |
| 8-14 months | 14 | 92% | 92% | 86% | 71% | 92% | 86% | 64% |
| 14-21 months | 17 | 100% | 100% | 88% | 76% | 100% | 94% | 88% |
| 21-30 months | 14 | 100% | 100% | 71% | 71% | 100% | 71% | 71% |
| 30-48 months | 15 | 100% | 100% | 100% | 100% | 100% | 100% | 100% |
| 4 years | 11 | 100% | 100% | 91% | 82% | 100% | 91% | 82% |
| 5 years | 9 | 100% | 100% | 100% | 89% | 100% | 100% | 89% |
| 6 years | 10 | 100% | 100% | 100% | 100% | 100% | 100% | 100% |
| 7 years | 6 | 100% | 100% | 100% | 100% | 100% | 100% | 100% |
| adult | 14 | 100% | 100% | 93% | 93% | 100% | 100% | 93% |
Table 2.
Mean Latency in milliseconds and standard deviation (in parentheses) of identifiable peaks (percentage provided in Table 1) averaged across left frontal site 8 and right frontal site 3. Adults also showed an N1 peak (mean= 140 ms, SD=17).
| Group | P1 GFP | Frontal P1 | Frontal N2 | Frontal P2 |
|---|---|---|---|---|
| 3-6 months | 220 (21) | 213(27) | 326(33) | 387 (31) |
| 6-8 months | 205 (28) | 196 (26) | 296(29) | 373 (30) |
| 8-14 months | 175 (25) | 173 (22) | 273(25) | 351 (36) |
| 14-21 months | 173 (16) | 173 (20) | 273 (24) | 360 (21) |
| 21-30 months | 150 (17) | 158 (21) | 257 (17) | 332 (21) |
| 30-48 months | 145 (15) | 141 (10) | 253 (17) | 324 (25) |
| 4 years | 140 (12) | 139 (15) | 240 (16) | 312 (21) |
| 5 years | 133 (7) | 131 (9) | 249 (20) | 313 (22) |
| 6 years | 136 (8) | 137 (8) | 259 (21) | 314 (23) |
| 7 years | 124 (6) | 126 (10) | 246 (14) | 308 (15) |
| adult | 103 (11) | 105 (15) | 266 (24) | 191 (16) |
The grand means for each age group revealed one dominant peak, which is apparent in GFP, as shown in Figure 3a. The largest peak of GFP generally corresponded in latency with the P1 peak selected at frontal sites. Figure 3b shows the high correlation between GFP peak latency and the frontal peak latency (averaged across site 8 and site 3). (Pearson's r = 0.90 (intercept = 23. ± 5.66; slope = 0.84 ± 0.03, 95% confidence intervals (CI) = 0.86 to 0.93). For the most extreme outlier from the line fit, the GFP reflected a negative deflection preceding the P1 peak that was selected at frontal sites for a 12-month-old child. In a second case (also a twelve month old) the P1 peak selected at frontal sites was the first (and larger) of a double peak, whereas the larger peak in the GFP corresponded to the second peak of this double peak. A third case was a 13-month-old child, who was the only child who did not show a clear peak in the GFP or a clear P1 at frontal sites.
Figure 3.
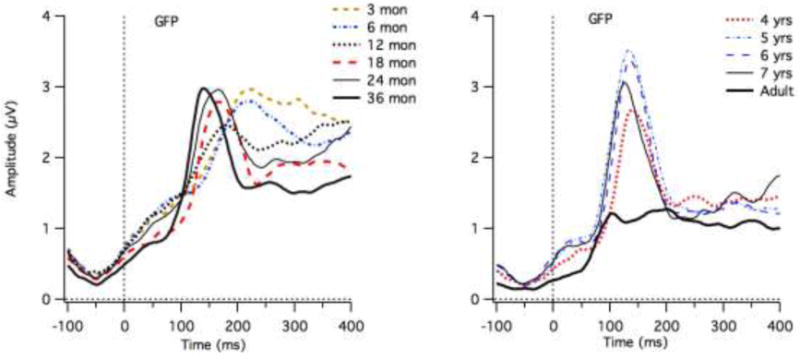
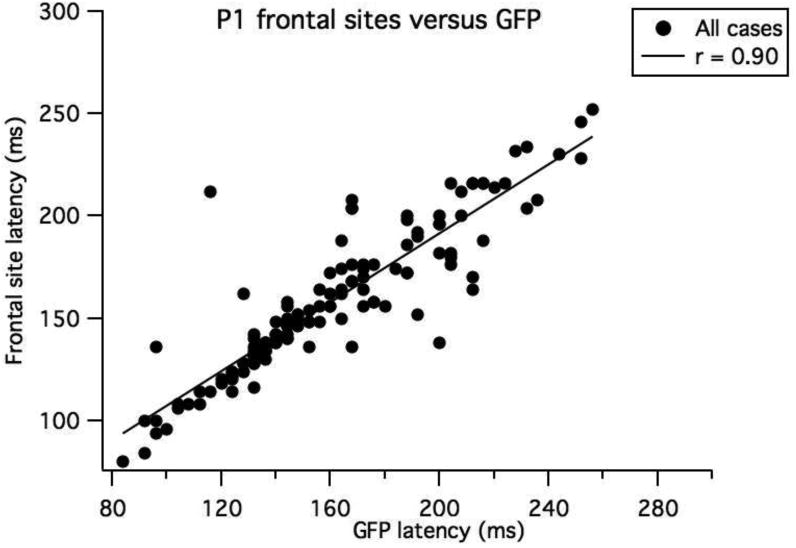
a) Grand means for the GFP measures for each age group. b the relationship between the GFP peak latency and the P1 latencies selected averaged across the left and right frontal sites.
P1 peak latency and age were significantly correlated for straight line fits (Pearson's r = -0.73, 95%, CI = -0.80 to -0.64); however, Figure 4 (top graph) illustrates that the fit was improved by using an exponentially decaying function. This curve fit indicates that the rate of change in latency slows with increasing age (Yfit = b0 + A*exp(-(Age - x0)/tau), with X0 =93 days (starting point), b0 =131 ms ± 4 (ending latency), A = 80 ± 5 ms (amount by which latency is decreasing from beginning to end) and tau = 546 ± 98 days (timescale for decreasing latency). Thus, after 546 days (19 months) the P1 latency has decayed by 37%. The correlation coefficient = -0.86 for this non-linear function. We performed two-tailed t-tests on adjacent age groups (e.g., three vs. six months) and groups with one intervening age group (e.g., three vs. 12 months). The P1 latency was significantly earlier (p < 0.02) for older than younger children up to four years of age, for the comparisons across the intervening age (3 vs. 12 months, 6 vs. 18 months, 18 vs. 36 months and 36 months versus 4 years), except for the 12 month olds, where it approached significance (12 versus 24 months, p = 0.07). In addition, some adjacent groups differed (6 vs. 12 month, 18 vs. 24 and 24 vs. 36 months, p < 0.05). The 36 month olds showed later latencies than 5 year olds (p = 0.023). There were no differences in latency among the four- five-, six- and seven-year olds, except between the six and seven year olds (p = 0.034). The adults showed significantly earlier P1 latencies than all the child groups (p < 0.001).
Figure 4.
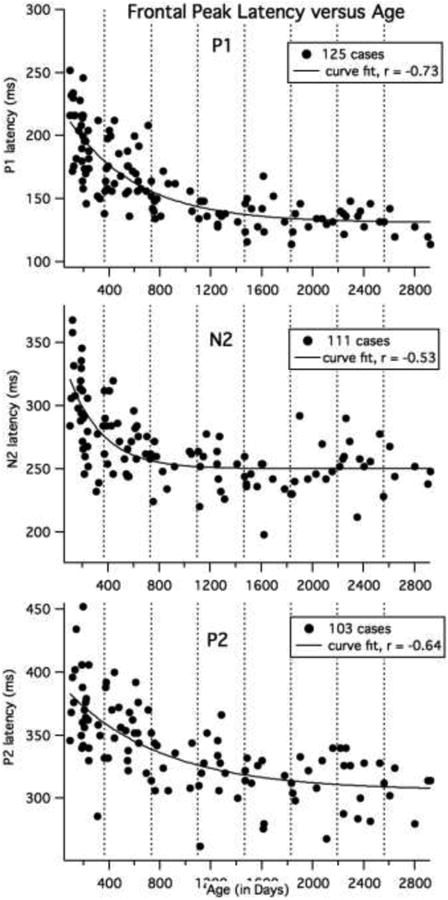
Curve fits for child data for age for P1, N2 and P2 latencies. All 125 child cases were included for the P1 analyses. The number of cases included for the N2 and P2 are shown in the legend. The latency values were averaged across the left (site 8) and right (site 3) electrode locations. The vertical dotted lines show one-year age intervals.
N2 and P2 correlations with age were calculated after excluding cases where there was no clear peak (and excluding adults). Outlier cases (clear peaks, but earlier or and later than our defined window) were included in this analysis. The left and right site values were averaged for each participant. As displayed in Figure 4 (middle graph), N2 showed a rapid decline in latency during the first year with no apparent change after two years of age (f0 =102 days, b0 =250 ms ± 3 (ending latency), A = 71 ± 8 ms, tau = 266 ±65 days; Pearson's r for a straight line fit = -0.53, 95% CI = -0.65 to -0.38); Note that the youngest three children (under 114 days) did not show an N2 peak. For the 20 children between 114 and 199 days, ¼ did not show clear N2. Two-tailed t-tests showed significantly earlier N2 latency for older groups in the first year (3 vs. 6 months, 3 vs. 12 months, 6 vs. 12 months, p < 0.05), but the decline in latency was much slower after the first year, with 36 month olds showing earlier latencies than 12 and 18 month olds, but no differences seen between age groups from 24 months to seven years of age (see Table 2 and Figure 4), except that the four year olds showed earlier N2 latencies than the six year olds (p = 0.03). The adults showed marginally later N2 latencies than the 7 year olds (p < 0.09).
As shown in Figure 4, bottom graph, the P2 latency declined more gradually, but still showed less change at later ages (X0 =93 days, b0 =306 ms ± 8 (ending latency), A = 77 ± 8.2 ms, tau = 749 ± 246 days. Pearson's r for a linear fit = -0.64, 95% CI = -0.74 to -0.51). However, only half on the youngest 23 participants (3 and 6 months olds under 199 days) showed a P2 peak and one-quarter of the eight 12 to 14 months old children (370 to 412 days) showed clear P2 peaks. Two-tailed t-tests showed significantly earlier latencies for 36 months olds compared to younger age groups (p < 0.04), with no difference in latency from 36 months to seven years of age (see Table 2). The adult P2 latency was significantly different from all child groups (p < 0.0001), however, it is likely that these two peaks do not reflect the same functional and structural systems.
The amplitudes for the P1, N1 and P2 peak measurements at the left and right sites were highly correlated (r=0.83 for all three peaks, 95% CI for 125 case = 0.77 to 0.88). Table 3 provides the means and standard deviations for the peak amplitudes for each age range. Peak amplitude was positively correlated with age for only the P1 peak (y intercept = 2.21 ± 0.21, slope =0.0009 ± 0.0002, r = 0.43, 95% CI = 0.28 to 0.56). Four children under 405 days showed P1 peaks that had negative amplitude averaged across left and right sites (relative to the prestimulus baseline). However, after this age, every child showed a positive P1 peak (at both the left and right sites). Two-tailed t-tests reveal that P1 amplitude showed a marginal increase from 6 to 18 months 12 to 24 months and 18 to 36 months (p = 0.05). The P1 amplitude was significantly smaller for the four year olds compared to three year olds and older children (P< 0.03). No difference in amplitude was found from five to seven years of age. The adults showed considerably smaller P1 amplitude than the children (p < 0.001) (see Table 3). There were no differences in N2 amplitude between adjacent age groups or age groups separated by an intervening age (p > 0.26). P2 amplitude was larger for 12 and 18 month olds compared to the 36 month old children (p< 0.04), but there were no differences in amplitude from 36 months to seven years of age.
Table 3.
Mean Amplitude (in μV) and standard deviation (in parentheses) of identifiable peaks (percentage provided in Table 1). Values are averaged across the left (site 8) and right (site 3) frontal locations. Adults also showed N1 (mean = 0.89, SD=1.04).
| Group | P1 | N2 | P2 |
|---|---|---|---|
| 3-6 months | 2.0 (1.74) | -1.86 (2.05) | 1.18 (2.67) |
| 6-8 months | 1.93 (1.88) | -1.47 (1.77) | 0.25 (1.83) |
| 8-14 months | 2.37 (1.46) | -0.87 (1.47) | 1.45 (2.27) |
| 14-21 months | 3.00 (1.01) | -1.24 (1.26) | 1.29 (1.03) |
| 21-30 months | 3.46 (1.38) | -1.19 (1.38) | 0.51 (1.45) |
| 30-48 months | 3.91 (1.59) | -0.78 (2.17) | 1.04 (2.27) |
| 4 years | 2.67 (0.97) | -0.69 (1.58) | 1.19 (1.46) |
| 5 years | .432 (1.14) | -0.43 (1.09) | 1.01 (1.37) |
| 6 years | 4.21 (0.95) | -0.59 (1.51) | 0.44 (1.48) |
| 7 years | 4.07 (1.40) | -0.19 (1.29) | 0.99 (1.24) |
| adult | 2.01 (0.7) | 0.77 (0.89) | 1.31 (1.06) |
In summary, the latency of the P1, N2 and P2 peaks shifted earlier with increasing age, with a more rapid decline in latency during the first year, compared to later years, particularly for the P1 peak. The dominant peak in GFP reflected the P1 peak for almost all of the children. The N2 peak was clearly observed for most children, except the very youngest (under 114 days). The P2 peak was not consistently observed (i.e., in over 50% of cases) until the latter half of the 6th month following birth. The P1 amplitude increased with age up to about four years of age, and was easily identified, except in one case (a twelve month old child). The amplitude of the N2 and P2 peaks had no straightforward relationship with age, except that the N2 and P2 was not present in some of the youngest children.
3.2. Temporal Site Peaks
Figure 5 shows grand means for each age group from three months of age to seven years of age at the left and right temporal sites. The adult waveforms serve as a reference for the endpoint of maturation. The adults clearly show a negative-positive sequence of peaks consistent with Na and Ta, and a negative-going later deflection that is likely to be Tb. In all adult cases, it was possible to select the Na-Ta-Tb sequence. With regards to the infants and children it is apparent from the grand means that the children who were under 14 months of age show a highly different pattern from the older children; their responses were generally more positive (relative to the prestimulus baseline) than found for older children. In addition, the most negative peak fell quite late in time, between 150 and 250 ms for children under 14 months of age. From 15 months to 36 months of age, the waveforms between 100 and 250 ms were generally negative relative to the pre-stimulus baseline, with a peak between 120 and 200 ms, and this peak appeared to shift earlier with increasing age. From four to seven years of age the most negative peak continued to shift earlier, and the latency approached adult values for the Na peak. For the seven-year-old children, a positive-going peak (Ta) at the right site (T8, site 52) can be observed in Figure 5, but later in time than the Ta peak for adults (lower, right graph). This positivity is followed by a negative deflection in the latency range of the adult Tb. Thus, the grade-school children showed increased positivity of the waveform in the Ta latency range, suggesting emergence of Ta and some of these older children also showed a negative-going peak following the Ta, which is consistent with the Tb peak.
Figure 5.
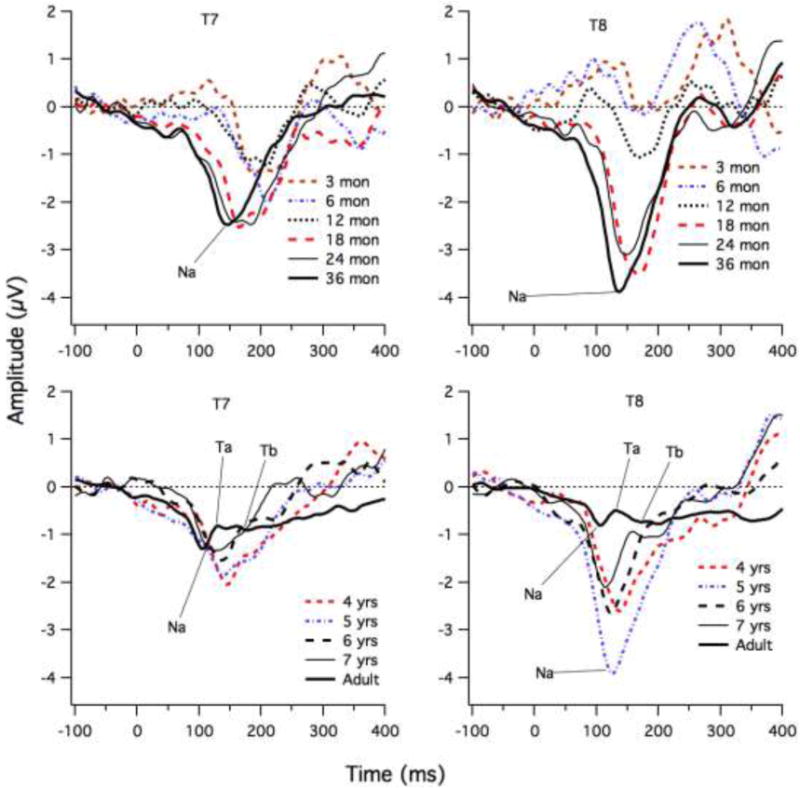
ERP waveforms for each age group at left (T7) and right (T8) sites. The Na, Ta and Tb peaks are shown for some age groups to illustrate the approximate latencies.
Table 4 shows the percentage of identifiable Na, Ta and Tb peaks for each age range. After 22 months of age, a prominent negative peak (which we will call Na) could be identified in almost all of the children (63 of 65 cases) (for the left Na, 56 of 65 cases). At younger ages, a clear, negative peak was not present in some individuals (75% had a clear peak). A following positive-going peak (which we will call Ta) and negative-going peak (which we will call Tb) were not easily identified in children. Less than 2/3 of children showed a Ta peak at the left or right sites. For Tb, 2/3 of the children showed a negative peak in the expected time range at the left site, but only about 1/2 at the right site. Examination of Table 4 reveals that left Ta was found in more older than younger children, but for the right site, only the four and seven-year olds had large proportions with clear Ta peaks. Many five and six year olds did not clearly show the Ta peak at right sites. Thus, Ta appears in many children at four years of age, but then disappears and reappears at seven years of age. At the left site, Tb is difficult to identify in older children (i.e., no peak), particularly for the six year olds. This suggests that the apparent large “Tb” negativity found for some children younger than 22 months may actually be an inversion of the P1 peak.
Table 4.
Percentage of children in each age group with a clearly identifiable peak.
| Group | N | Left Na | Left Ta | Left Tb | Right Na | Right Ta | Right Tb |
|---|---|---|---|---|---|---|---|
| 3-6 months | 10 | 60% | 50% | 80% | 60% | 30% | 50% |
| 6-8 months | 19 | 58% | 63% | 89% | 84% | 58% | 52% |
| 8-14 months | 14 | 57% | 71% | 79% | 57% | 50% | 57% |
| 14-21 months | 17 | 71% | 59% | 82% | 76% | 53% | 59% |
| 21-30 months | 14 | 71% | 57% | 71% | 93% | 64% | 50% |
| 30-48 months | 15 | 87% | 33% | 27% | 100% | 53% | 40% |
| 4 years | 11 | 82% | 73% | 73% | 91% | 91% | 82% |
| 5 years | 9 | 89% | 78% | 56% | 100% | 56% | 56% |
| 6 years | 10 | 90% | 70% | 20% | 100% | 50% | 10% |
| 7 years | 6 | 83% | 67% | 50% | 100% | 83% | 67% |
| adult | 14 | 100% | 100% | 100% | 100% | 100% | 100% |
Table 5 shows mean latency of the peaks, for the cases in which a clear peak was identified. For the three- and six-month olds, the Tb latencies were similar to P1 latencies (see Table 2). For the 12- and 18-month olds, the P1 latencies were generally 10 to 25 ms earlier than Tb, and were closest to the Ta latency. For the older age groups, P1 latency was much earlier (40 to 70 ms earlier) than Tb, and was closest to the Na latency.
Table 5.
Mean latency (in ms) and standard deviation (in parentheses) of identifiable peaks (percentage provided in Table 4) at the left and right temporal sites.
| Group | Left Na | Left Ta | Left Tb | Right Na | Right Ta | Right Tb |
|---|---|---|---|---|---|---|
| 3-6 months | 179(9.6) | 206(11) | 215(15) | 163(23) | 201(16) | 222(18) |
| 6-8 months | 165(11) | 181(12) | 215(12) | 158(17) | 181(10) | 206(22) |
| 8-14 months | 157(16) | 170(20) | 201(13) | 162(13) | 181(17) | 198(24) |
| 14-21 months | 155(12) | 174(13) | 195(16) | 151(14) | 172(15) | 182(9) |
| 21-30 months | 147(10) | 167(14) | 195(19) | 146(10) | 178(14) | 188(13) |
| 30-48 months | 139(15) | 165(9) | 203(30 | 138(11) | 168(15) | 196(33) |
| 4 years | 144(13) | 174(6) | 197(11) | 132(11) | 167(9) | 194(28) |
| 5 years | 140(11) | 162(8) | 189(17) | 127(9) | 153(9) | 181(18) |
| 6 years | 132(15) | 159(21) | 178(14) | 128(12) | 170(9) | 204(NA) |
| 7 years | 122(12) | 144(24) | 183(15) | 120(14) | 158(18) | 199(8) |
| adult | 109(12) | 140(21) | 172(27) | 108(16) | 145(14) | 183(19) |
Figure 6 shows the line fits for the temporal site peaks (excluding adults). Only cases for which clear peaks were identified were included (the numbers are shown in the legend). For these line fits, we also included cases where the peak latencies were earlier or later than the defined time window. For the Na latencies, the best fits were straight lines. For the T7 (site 24) peak, Pearson's r = -0.49 (95% CI = -0.62 to -0.32) (intercept = 160 ± 3; slope = -0.013 ± 0.002); the peak latency of T7 Na shifted earlier by 6 ms per year. The Na peak at the right site (site 52) showed a stronger relationship with age (Pearson's r = -0.65, 95% CI = -0.74 to -0.52, intercept = 158 ± 2, slope =-0.015 ± 0.002); the T8 Na Peak latency shifted earlier by approximately 6 ms per year. The peak latencies at the left and right sites were moderately correlated (r = 0.51, 95% CI = 0.35 to 0.64; intercept = 57 ± 15, slope =0.63 ± 0.11; 95 cases had both left and right Na measures).
Figure 6.
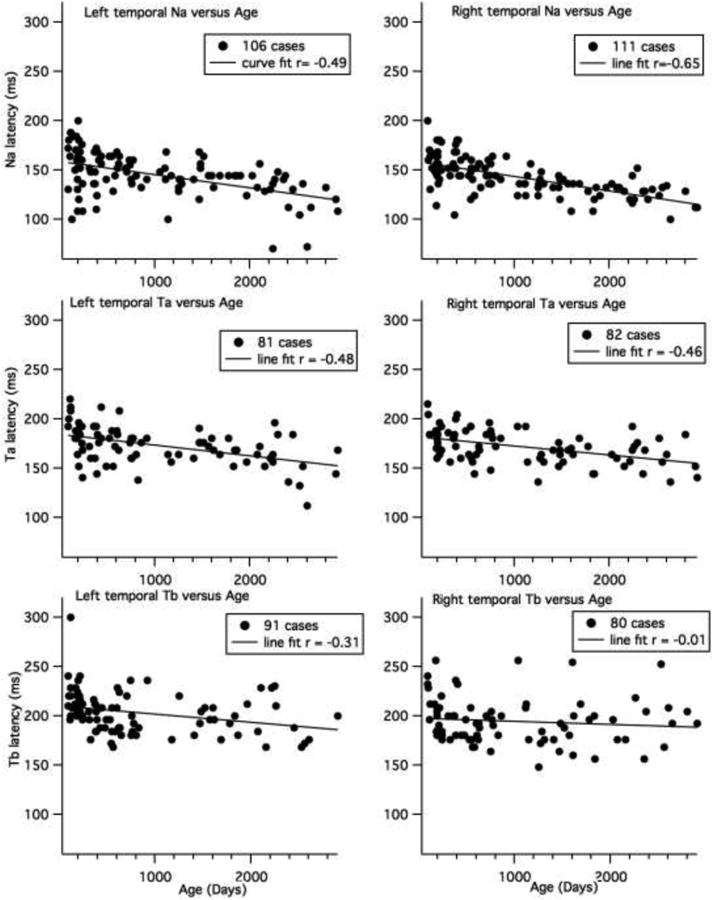
Line fits for child data for age at left and right Na, Ta and Tb latencies. The number of cases included for each analysis is shown in the legend. Cases for which there was no peak were excluded.
Two-tailed t-tests reveal significantly earlier Na latencies for 6 and 12 month olds compared to 3 month olds at the left site (p < 0.024) and significantly earlier latencies for 36 month olds compared to children in the 18 month old group and younger groups (p < 0.01). In addition, the seven year olds had earlier Na latencies at the left temporal site than all the younger age groups, except six year olds (p < 0.017). At the right temporal site, the children older than 24 months of age showed earlier latencies than the youngest three age groups (3, 6 and 12 months, p < 0.002). However, even though 18 month olds showed significantly earlier Na latencies than 12 month olds (p = 0.047), they showed no difference from six month olds. This is because Na latency increased slightly from six to 12 months of age (see Table 5). The latency of the Na at the right site also decreased significantly for 36 versus 18 months, four years versus 24 months, and five years versus 36 months (p < 0.024), but was stable from four to seven years of age. There was no difference in Na latency between the adults and seven year old group at left or right sites, but there were significant differences between adults and all younger age groups (p < 0.001). The Na latency was earlier at the right compared to left sites, but only for the four to seven year old children (p = 0.002).
The Ta latencies also showed a significant negative correlation with age, shifting earlier by 3 to 4 ms per year (T7 peak, Pearson's r = -0.48, 95% CI = -0.63 to -0.29 (intercept = 184.46 ± 3.03; slope = -0.011102 ± 0.0023); T8 peak, Pearson's r = -0.46, 95% CI = -0.62 to -0.30 (intercept = 181.54 ± 2.74, slope =-0.0091775 ± 0.00198) (Figure 6, middle graphs). The left and right Ta latencies were, at most, weakly correlated in children (r = 0.30, 95% CI = 0.05 to 0.51, based on 61 cases with both left and right measures) and there were no differences in latency between the left and right temporal sites for children (p > 0.05, 61 cases). Two-tailed t-tests were only performed for the older children. At both the left and right sites, five year olds showed significantly earlier latencies than four year olds (p = 0.011); but then latency increased from five to six year of age at the right site (p = 0.017). However, only half of the five and six year olds showed clear Ta at the right sites. The adults did not differ from the seven-year-old group, but they showed significantly earlier latencies than all the younger groups (six years of age and younger (p > 0.05).
The Tb latency at the left site was weakly correlated with age (T7 peak, Pearson's r = -0.31, 95% CI = -0.48 to -0.11 (intercept = 210 ± 3.06; slope =-0.008 ± 0.003). No correlation was found with age for the right site (r = -0.01, 95% CI = -0.23 to -0.21) (Figure 6, bottom graphs). The left and right measures were not correlated (r=0.24, 95% CI = 0.46 to -0.01, based on 62 cases). As can be seen in Figure 6, there are many missing data points for the Tb peak, which interfered with quantifying Tb latency. Two-tailed tests showed not difference in Tb latency from 24 months to 8 years of age (We did not test younger ages because so few had clear peaks). The adults show significantly earlier Tb latencies than children under five years of age at the left site (p < 0.023).
No significant correlations were found between age and amplitude of the Na, Ta or Tb peaks. The only clear pattern is that after approximately 18 months, the left and right Na peaks were more negative than the baseline for over 90% of the children (all but 6 cases at T7 and 3 cases at T8). For the younger children, a larger proportion showed Na peaks above the baseline (20% for the left site and 26% for the right site) (see Figure 5). The two-tailed t-tests showed a difference in amplitude between the 12 and 18 month olds for the Ta and Tb peaks at the left site, but no differences between other child age groups. The adults showed more positive responses than the children younger than four years of age for both Ta and Tb at the right site and at the left site for Tb (p < 0.05). The adult Tb was also more positive at the right site than found for four to six year olds children (who had identifiable Tb) (p = 0.02), but did not differ from the seven year olds.
There was, no relationship between left and right amplitude measures for Na, Ta or Tb (r > 0.06). The Na and Ta amplitudes were generally more negative at the right compared to left sites for children (p < 0.02), for cases who with both the left and right site peak measures (81 for Na and 62 of Ta), but were not different for Tb (62 cases).
3.3. Relationship between Frontal and Temporal Peaks
It is possible that the peaks at the temporal sites reflect the inverse of the frontal peaks (i.e., the opposite pole of dipolar sources. Regression line fits between the temporal and frontal sites revealed that T7 and T8 Na latencies were moderately correlated with P1, as shown in Figure 7 (the number of cases included are shown in the graph legends). The correlation between the right frontal P1 and right temporal Na was stronger (r = 0.60, 95% CI = 0.47 to 0.71, intercept = 29 ± 16.4, slope = =0.90 ± 0.11) than found for the left sites P1 and Na (r = 0.43, 95% CI = 0.26 to 0.57 intercept = 67 ± 20, slope = 0.64 ± 0.13). Note that removing children under one year of age (370 days), changes the correlations as follows: left site, r increases to 0.52; right site, r decreases to 0.49).
Figure 7.
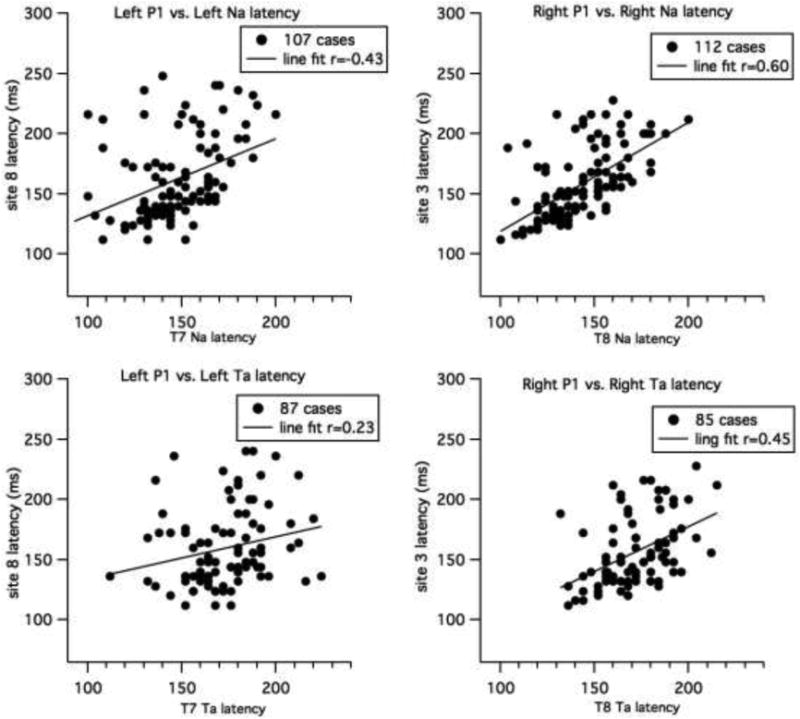
Line fits for child data for P1 latency versus Na latency (top graph) and between P1 and Ta (middle graphs). Left sites are shown on the left and right sites on the right. The number of cases used in each analysis is shown in the legend.
A significant correlation was also found between right P1 latency and right Ta that was weak to moderate (r = 0.45, 95% CI = 0.26 to 0.61), and, at most, weak between the left frontal (site 8) P1 and T7 Ta latency (r = 0.23 95% CI = 0.02 to 0.42). There was no relationship between frontal P1 measures and temporal Tb measures.
4. Discussion
The goal of the current analysis was to document the maturation of CAEPs at frontocentral and temporal sites to a speech sound in children from three months to eight years of age, which would provide benchmarks for analysis of CAEPs in special populations. To summarize the general pattern of findings, at frontocentral sites, a prominent positive peak (P1) was clearly present across all age groups, but the N2 and P2 peaks were clearly observed, only at older ages (older than six months and 14 months, respectively). All three frontal peaks showed an exponential decline in latency with increasing age. The P1 peak amplitude was related to age, showing an increase in amplitude with increasing age across childhood.
The temporal sites showed a clear negative peak between 100 and 200 ms at both the left and right temporal site in most children after 30 months of age and at the right site in children older than 14 months of age. The latency of this negative peak was later than found for the adult Na, but possibly could be the Na, considering its maturational trajectory. This negative peak showed a linear shift earlier in time with increasing age. This differed from the nonlinear pattern found for frontocentral peaks, and in particular, the P1 peak. A distinct positive peak (Ta), following Na and peaking between 120 and 200 ms was not consistently found in most age groups of children. Ta could be identified in all adults and in 5 of the 6 seven- to eight-year-old children. In addition, at the right site (T8), Ta was identifiable in most of the four-year-old children. For other age groups many children did not show a clear Ta peak. The Tb peak was only clearly present in the adult groups and four year olds. The apparent “Tb” in some younger children (under 15 months) in the Tb latency range at the left site is likely to be an inversion of the P1 peak, which falls in the same latency range in infants.
The P1 peak latencies at frontal sites and Na latencies at temporal sites were moderately correlated. At early ages, frontal site P1 latency was closer to temporal site Tb latency, but by about 30 months of age, P1 latency was similar to temporal site Na latencies.
Below we discuss these findings in greater detail in relation to previous studies of functional and structural cortical maturation.
4.1 Presence of frontal CAEPs across age
The P1 peak dominated the ERP waveforms and this peak could be easily identified, except for one child. All children had over 200 trials in the averaged waveform (and most over 400 trials), so the signal/noise was excellent for identifying relatively large amplitude CAEPs, such as P1. The classic, adult N1 (N1b) was only observed in the adult group. This pattern of large P1 and absent N1b is consistent with previous maturational studies that have used similar, short ISIs (or rapid stimulus onset asynchrony-SOA) that are less than one second (e.g., Cunningham, et al., 2000; Ponton, et al., 2002; Sussman et al., 2008; Choudhury & Benasich, 2010; Sharma et al., 2014). The P1 peak was followed by a negative-positive (N2-P2) sequence of peaks. The N2 peak was clearly observed in most children after approximately 8 months of age (i.e., in over 85%) and the P2 in children older than 13 months of age (over 70%). Almost all of the children between 30 months and eight years of age showed clear N2-P2 peak sequences following the P1.
N2 and a following positivity (P2) have been observed in newborn to 12 month old infants (Kushnerenko, et al., 2002) and these peaks are robustly present in children up to 10 years of age (e.g., Ceponiene, et al., 2002; Ponton, et al., 2002; Sussman et al., 2008). This N2-P2 sequence appears to be robust only in children. The adults in our study did not show a clear positive peak following the N2 (see Figure 2), and, thus, we did not attempt to quantify this peak in adults; they did show a small negative deflection following the classic adult P2 peak and peaking before 300 ms; however, most of our adults showed a series of small negative-positive deflections following the P2 that returned to baseline after 400 ms. We decided to select the first of these small peaks as N2, but “N2” could be a subsequent peak. Other studies have also observed very small or absent N2 in adults to auditory stimuli in passive paradigms (Cunningham, et al., 2000; Sussman,et al. 2008). In the study by Ceponiene and colleagues (2002), N2 was found in adults only at a short stimulus onset asynchrony (SOA) (700 ms SOA), with no N2 observed at a long SOA (2.8-7.7 s). In the study by Ponton et al. (2002), which examined children between 5 and 20 years of age, the N2 and the following positivity (not labeled) became less prominent (i.e., closer to the 0 baseline) with increasing age. After approximately 16 years for N2 and 13 years for the following positivity, neither is clear in the ERP waveforms (see Fig. 3 Ponton, et al., 2002), The positive peak that we called P2 in the current study is comparable to this late positive peak following N2 in the children younger than 13 years of age (see Ponton, et al., 2002, Fig. 3)
The N2-P2 sequence in our study is also comparable in latency to the N250-P350 found in infants (Kushnerenko, et al., 2002). In our study, the mean latency of the N2 peak fell between 270 and 350 ms and for P2 between 340 to 380 ms for infants under 14 months of age; however, only half of our children under 6 months of age showed an N2-P2 peak sequence, whereas Kushnerenko et al. (2002), report that the peak is present from birth in the majority of the 15 children that they studied. They suggest that the absence of a clear peak in the grand means of the youngest infants may be due to latency variability across individuals, which is large in young infants (Shucard, et al., 1987). Other investigations of very young infants have observed a large, broad positivity, followed by a very late negativity peaking after 400 ms (Barnet, 1975), although the N250 deflection in young infants has been reported (e.g., Novak et al., 1989; Molfese, 2000). It is likely that stimulus factors (e.g., duration) and ISI influence the detectability of these small peaks, particularly in the youngest infants.
4.2. Maturation of Frontal CAEPs
The relationship between latency and age for the frontal site CAEP peaks was best described using exponentially decaying functions. Eggermont (1988) demonstrated a similar pattern in CAEP and auditory brainstem data from infants and children from a number of studies. In our study, the time constant for the P1 latency decline was about 18 months and the P2 latency decline was about 25 months. The time constant for the N2 latency decline was shorter, at approximately 6 months. In the studies by Ponton and colleagues (2000; 2002), the time constant for N2 was two years, but for P1, it was longer, at 4 years; however, these studies examined children from five to 20 years of age. P1 latency is changing at a much slower rate in children over five years of age, which is consistent with our findings. Specifically, the four- to six-year-old groups did not differ in P1 or N2 latencies. Only the seven-year-old group showed a shift to earlier latency, at both frontal sites for P1 and at the left site for N2. The child P2 latency did not change significantly from 24 months of age to eight years of age. The adult P2 latency is considerably earlier than the P2 found in children, and may reflect functionally and structurally different processes.
Other maturation studies have also found that obligatory CAEPs measured at frontal sites shifted earlier in latency with increasing age. In particular, studies consistently show that the P1 latency shifts earlier with increasing age. The Choudhury & Benasich (2010) study observed that P1 latencies in children under 17 months shifted earlier in 24 to 48 month old children. Kushnerenko et al., (2002) found that P1 latency shifted earlier from 3- 6 months (by 30 ms) and from 6 to 9 months (by 20 ms), but observed no difference from 9 to 12 months in a longitudinal study of 15 infants. This pattern is comparable to our finds, with more rapid decline seen in younger infants. In addition, we observed no change, or a slight increase in latency for some of the infants in the eight to 18 month old range.
In maturational studies of older children, latencies of these frontal CAEPs were generally found to shift earlier with increasing age. Most studies have shown consistent results with P1 elicited to stimuli presented at fast rates, with fairly small changes in latency ranging from between 3 and 10 ms per year in grade school children up to 10 years of age (e.g., Ceponiene, et al., 2002; Ponton, et al., 2002; Sussman, et al., 2008). P1 continues to shift earlier in time, but it is important to recognize that the N1b can be observed at faster rates of stimulation in children over 10 years of age (Ponton, et al., 2002). Thus, the shift in P1 latency after 9 or 10 years of age could be related to the increase in N1 amplitude following the P1.
With regards to P1 amplitude, we observed increases in amplitude from infants to toddlers (about 24 months), and then stable amplitude until about 5 years of age, when amplitude increased again and then remained stable across our older children (5 to 8 years of age). Kushnerenko et al. (2002), only saw an increase from newborns to three months, and then stable amplitude to 12 months of age. Other maturational studies of grade school children suggest stable P1 amplitude, with a drop in P1 amplitude between grade school years (9-10 years) and the teenage and adult years (e.g., Ceponiene, 2002; Ponton, et al., 2002; Sussman et al., 2008).
The pattern for N2 and P2 peaks were less clear. Kushnerenko, et al (2002), found no latency change in N250 or P350 from newborns to 12 months of age. Choudhury and Benasish (2010) observed earlier latencies for N2 (their N1) and for P2 in children under 17 months of age compared to 24 and 48 month olds.
Some studies showed no change in N2 latency during the grade school years and other studies showed increased latency. Ceponiene, et al. (2002) found little difference in N2 latencies between four- and nine-year old children, which matches with our results. However, N2 latencies have also been shown to shift earlier with increasing age from grade school to older age in some studies (e.g., Cunningham, et al., 2000; Sussman, et al., 2008), but to shift later in other studies (Ponton, et al., 2002). Sussman et al. (2008) found earlier latencies for 10 year olds than for 8 year olds, but no difference between the 10 year olds and older children (11 and 16 years of age). In the Ponton et al. (2002) study, the later N2 latencies are likely to be due to the emergence of the adult-like P2, which peaked around 150 ms in the Ponton (2002) study. However, both studies that compared N2 latencies in different rate of presentation conditions, did not find a difference in N2 latency (Ceponiene, et al., 2002; Sussman et al., 2008).
N2 peak amplitudes in our data did not show a clear relationship with age. Studies of grade school children indicate that N2 amplitude declines (i.e., becomes less negative) with increasing age from grade school into adolescents and adulthood (Ponton, et al., 2002; Sussman, et al., 2008). Ceponiene et al., (2002) showed a decline in amplitude between four and nine year old children. The very small N2 in adults in our study is consistent with this decline in amplitude. Ceponiene et al. (2002) suggest that increasing inhibitory control by adults leads to this small N2 amplitude and refers to studies that found increases in N2 amplitudes during sleep (e.g., Nielson-Bohlman, et al., 1991, cited in Ceponiene, et al., 2002).
The P2 positivity, which followed the N2 was found to increase in amplitude from 3 to 6 months and then to decrease in amplitude to 12 months of age in the Kushnerenko, et al., (2002) study, but it did not change in amplitude from six months to 48 months of age in Choudhury and Benasich (2010). Our study also did not show a change in amplitude for the P2 peak. However, since we did not see the P2 in many children under one year of age, this is consistent with an emerging P2 during the first year followed by no change between 12 months and seven years of age.
In sum, our maturational changes for frontal CAEPs are similar to other studies, showing clear decreases in latency of the P1 peak with age, but to a lesser extent for N2 and P2, and more rapid changes at younger ages (i.e., exponential changes). However, the data suggest that increases in latency can occur in the 6 to 18 month age range. These increases may be the result of functional changes to two or more underlying sources of CAEPs that shift in latency at different rates, and thus, when summed at the scalp lead to apparent increases in latency. Alternatively, this increase may be the result of noise (unrelated activity masking the “true” peak). A study examining test-retest reliability in sessions in a narrow age range (e.g., one week) will be needed to evaluate these explanations.
4.3. Presence of Temporal Site CAEPs
The current study showed an identifiable negative peak, that we called Na, in a large proportion of the children, but a subsequent positive-negative peak sequence, consistent with the Ta and Tb peaks, was apparent only in some of the grade school children and in the adults. Pang and Taylor (2000), who examined children as young as three years of age, did not report the percentage of children showing clear peaks in their study. However, in their description of peak selection, they indicated that in cases showing only one distinct negativity, this negativity (from 50 to 110 ms for tones) was selected as Na and a following “shoulder” was selected to represent Tb. This statement implies that Na was more reliably identifiable than Tb. In the study by Tonnquist-Uhlen and colleagues (2003), they stated that all three peaks (Na, Ta, Tb) could be identified in most children, including their youngest children (five to six years), but that the peaks are less distinct at T3 (renamed T7 in 10-10 system). Examination of their figures also reveals that the Ta peak is very small in their youngest age group and at the left site for the seven year olds.
It is likely that the relative magnitude (as well as latency) of the T-complex peaks is related to a number of design decisions. To make it easier to evaluate these design decision, Table 7 presents the factors used in specific child studies that are likely to contribute to differences in amplitude and distinct peaks. These consist of ISI, stimulus type, delivery type (e.g., headphones), and reference electrode. For example, in the Tonnquist-Uhlen et al. (2003) study, stimuli were presented only to the left ear, which is likely to account for the clearer, larger-amplitude peaks at the contralateral, right sites.
Table 7. Design features of ERPs studies investigating the T-complex in children.
| Study | Age | ISI | Stimuli | Delivery | Reference | Peaks |
|---|---|---|---|---|---|---|
| Mason & Mellor, 1984 | 9;8/12 (SD = 1 8/12) | 1800 ms | 1000 Ha, 200 ms tones, 70 dB SpL | Headphones Monaural, binaural | Nose | Na (N1), Tb (N2) |
| Tonnquist-Uhlen et al., 1996 | 9-15 years | 1000 ms | 500 Hz, 100 ms, 75 dB HL | Monaural, left and right | Bimental (chin) | Ta, Tb |
| Ceponiene, et al. 1998 | 7-9 years | 350, 700,1400 ms | 1000 Hz, 100 ms tones, 75 dB SPL | Speakers | Mastoid | Ta (P100/130) Tb (N190) |
| Bruneau, et al., 1999 | 4-8 years | 750 Hz, 200 ms tones, 50, 60, 70, 80 dB SPL | Speakers | Earlobes | Tb (N1c) | |
| Albrecht et al. 2000 | 5-16 years | 825 ms | 1000 Hz, 175 ms, 86 dB SPL | Earphones, binaural | Average (21 sites) | Ta (P1r), Tb (N1r) |
| Pang & Taylor, 2000 | 3-16 years | 600 ms | 2000 Hz tone, 36 ms, 77 dB SL; [da], 212 ms, 72 dB SL | Speaker | Average (26 sites) | Na (N1a), Tb (N1c) |
| Gomes et al., 2001 | 6-12 years | 3900 ms | 1000 Hz, 300 ms, 85 dB SPL | Earphones, binaural | Average (30 sites) | Tb (N1) |
| Ponton, et al., 2002 | 5-20 years | 1282 ms | Click trains, 18.1 ms, 65 n HL | Earphones, Monaural left ear | Average | Ta, Tb |
| Tonnquist-Uhlen et al., 2003 | 5-20 years | 1282 ms | Click trains, 18.1 ms, 65 n HL | Ear insert, Monaural left ear | Average (30 sites) | Na, Ta, Tb |
| Groen, et al., 2008 | 10-12 years | 1550 (SD 30 ms) | [a], 576 Hz simple tone, complex tone, 300 ms, 50 dB SPL | Ear insert, Monaural right ear | Average (21 sites) | Na, Ta, Tb |
| Shafer, et al., 2011 | 6-10 years | 350 to 1000 ms | [ε], 50 ms, 250 ms, “the”, CVC words, 65-85 dB SPL | Earphones, binaural | Nose | Na, Ta, Tb |
| Bishop, et al., 2011 | 7 and 9 years | 1500 ms | 1000 Hz, 50 ms, 80 dB SPL | Headphones | Mastoid (ICA may have used average) | Ta |
| Stefanics, et al., 2011 | 7 -10 years | 500 ms | 500-Hz, 200 ms, 75 dB SPL | Headphones | Average (65 site, Geodesic net) | Tb |
| Mahajan & McArthur, 2013 | 10-18 years | 725-925 ms | 1000 Hz, s tone, [da], 175 ms, 80 dB SPL | Headphones | Mastoid | Na, Ta, Tb |
| Current Study | 3 months to 8 years | 350 ms | [e], 250 ms, 85.6 dB SPL | Speakers | Average (63 sites) | Na, Ta, Tb |
Studies that used a mastoid or nose reference also show a relatively prominent Tb peak (compared to Na). It is possible that the inversion of the P2 peak at the mastoids contributes to this pattern (e.g., Mahajan & MacArthur, 2013). In our earlier study, which used the same vowel stimuli (but binaural delivery over ear insert phones), we used a nose reference (Shafer, et al., 2011a). Re-referencing previous data from Shafer et al. (2011a) to an average reference led to a more distinct “Na” peak and more negative amplitude values for all three T-complex peaks compared to the nose referenced data. In addition, the Na peak becomes more distinct. Importantly, the latencies of these peaks are nearly identical under the two different reference schemes. We could not re-reference our data to a nose reference (infants do not tolerate a nose electrode). However, we did examine the temporal peaks after re-referencing to the nasion (site 10). In younger age groups, the later negativity (around Tb latency) increased slightly, but the first peak (which we called Na) was still the most prominent. In the oldest child age group, the Tb peak also increased slightly at the right site.
Even studies using average references are not directly comparable if the montage differs substantially. For example, Groen, et al. (2008) used an average reference of 21 sites, but 2/3 of these sites were superior locations. In their study, Tb was the most prominent peak in 10-12 year old children; Similarly, Albrecht et al. (2000) used a montage of 21 sites at standard 10-20 positions. In their dipole analysis, they observed a prominent positive (Ta) and negative (Tb) component in the youngest age groups (5-6 years). The Geodesic montage, used in this study, includes a greater balance of electrodes at superior and inferior sites, and this will result in an average of all sites that is closer to zero (with regards to dipolar sources). A study by Stefanics et al. (2011) with nine-year-old children used the same geodesic montage as we did and an average reference. They observed a prominent Tb (N1c) peaking between 184 and 204 ms; however, they measured N1c at sites anterior to T7 and T8. Examination of these sites in our data (not shown) also reveals that a late negativity is prominent at these sites, and that the earlier “Na” negativity is not found. However, this later negativity is also consistent with the N2 peak that we are measuring at the frontal sites.
The interstimulus interval can also influence the amplitude of the Ta and Tb peaks. Ceponiene et al. (1998) found that the Tb peak increased in amplitude (i.e., became more negative) in seven- to nine-year-old children with increasing ISI. The Ta peak decreased in amplitude with increasing ISI. The influence of ISI on latency will be discussed further, below.
Stimulus factors, such as intensity of delivery and stimulus type (e.g., speech, rise-time) have also been shown to influence the amplitude of various peaks. Less intense sounds result in later latencies and smaller amplitudes for the Tb peak (N1c; Bruneau, et al., 1999). Thus, it is likely that stimulus delivery over speakers rather than headphones might lead to the same effect, since low-level ambient background noise would lead to lower signal/noise ratio for the auditory stimuli. Specifically speaker versus headphone/earphone deliver is likely to result in smaller (and later) Tb peaks.
Despite the many design differences across studies, most have generally observed decreasing amplitude of the T-complex peaks selected for measurement, as age increases (see Table 7 for these studies). The current study showed a similar finding for the negativity that we called Na from 18 months to adulthood, but children under 18 months of age showed less negative Na amplitude. In part, this may be because more than half of the infants (three to -14 months of age) did not show a clear Na peak. The analysis of peak amplitude showed no clear relationship of Na peak amplitude with age across children, but t-tests showed that 18 month olds had more negative Na than 12 month old infants, but no difference in amplitude was observe among the older age groups. Two studies examined children in age ranges overlapping with our study, and examined Na. Pang and Tayler (2000) found that Na to tones and speech was larger in amplitude at T4 (T8) for 3-4 year olds and 7-8 year olds than adults. Tonnquist-Uhlen et al. (2003) showed an increase in Na amplitude from 5-6 years to seven years and then a decrease to adulthood.
With regards to the Ta peak, it was not clearly present until older ages, emerging at four years of age in our data. It was not clearly present in many five- and six-year olds at the right site, but was again present in seven-year olds. The Tonnquist-Uhlen et al. (2003) data also do not show a distinct Ta in 5-6 year olds in their grand mean data. The peak amplitude increased in positivity from 7 to 11 years, and then declined in positivity across older ages. The five-, six -, and seven- year-old and adult data in our study are consistent with this pattern. The Albrecht et al. (2000) study showed no change in the left Ta amplitude from 5-6 to 7-8 years, and then a decline in amplitude, but showed an increase at the right site from 5-6 to 7-8 years and then a decrease with age. Thus, the right T8 site showed a similar pattern to other studies.
A later negativity, consistent with Tb latency, in the current study was only clearly present in four-year old children (74-82%, T7, T8 respectively), 4 of the 6 seven-year-old children, and the adults. Relative to the Ta amplitude, Tb was only slightly more negative. Albrecht, et al., (2000) observed a distinct Tb in 5-6 and 7-8 year olds that was around 3 μV more negative than Ta. The dipole modeling technique or the electrode montage may have led to the more prominent Tb. Tonnquist-Uhlen et al. (2003) found a prominent Tb at the right site that increased in amplitude from five years to adulthood. At the left site, the Tb was small in 5-6 year olds, but then increased in amplitude up to 11 years and then declined in amplitude. This study used a very long ISI (1282 ms), which may account for the considerably larger Tb. It is also relevant that the Stefanics et al., paper identified a negativity that they called N1c at sites slightly anterior to T7 and T8. In our data a negative peak in the Tb latency is more prominent at these anterior sites compared to T7 and T8. However, it is not clear to what extent the peaks at these more anterior sites are distinct from the frontal N2.
4.4 Maturational Changes in Latency of Temporal Site Peaks
The current study revealed linear decreases in latency for the prominent temporal sites negativity (which we called Na) from 3 months to 8 years of age. However, the relationships were moderate, accounting for 25% (left site) and 42% of the variance (right site). Note that we could increase the correlation by removing many of the younger children, who showed peak latencies outside of the expected window for Na, particularly for the youngest children. However, this would simply be another manner of indicating that the Na peak (or what it reflects) is very immature in the first year. For children who showed the following positive peak “Ta” the latency also decreased with age. However, it is possible that the Ta peak is noise in the younger children, in which case the latency decrease reflects the fact that Ta was selected as a peak following the Na. The Tb peak latency did not show a clear relationship with age. These changes in latency are consistent with reports from other studies, which generally showed latency decreases of Na, Ta, and/or Tb across age. Pang and Tayler (2000) found a decrease in latency with age to tones and speech for the Na peak, but not for the Tb peak. Note that the latencies of the Na and Tb peaks were considerably later to the speech syllable [da], at approximately 147 ms and 219 ms, respectively (similarly, at the 350 ms ISI, the Tb peaked is at 199 ms, in Ceponiene, et al., 1998). This study also delivered stimuli via speakers and these latencies are somewhat similar to those found in our study for five to eight year olds. The Tonnquist-Uhlen study (2003) showed a slight increase in latency for Na and Ta from five-six to seven years and then a decrease to adulthood; the Tb latency generally showed decreased latency across age. Similarly, the Albrecht et al. (2000), study showed an increase in latency of Ta from 5-6 years to 7-8 years and then a decline in latency with age, and a general decline in latency with age for the Tb peak. Because so few of our six-year-old children had a distinct Tb, it was difficult to compare findings. However, the difficulty in identifying Ta and Tb in this age group may indicate that maturational changes in several sources are overlapping in such a way to mask the Tb in our data, and this circumstance shifted the peak later than expected in these other studies.
The emergence of Ta and Tb at four years of age, and then disappearance and re-emergence at 7 years of age in our data suggested that changes in multiple underlying sources may overlap to mask a peak at certain ages. Also, individual variability in the location and orientation of auditory cortex relative to the electrode placements could account from some of the variability found across the children. Dipole modeling may be helpful in attempting to separate these overlapping sources (Ponton, et al., 2002). This type of model will be even more successful, if we have improved information regarding structural brain development across childhood.
4.5 Differences between Frontal and Temporal Site Peaks
We found that P1 and the negative peak, Na, initially showed a different maturational timecourse, with the P1 showing a rapid decline in latency in the first year, and then slowing to a more similar rate to the Na peak latencies. This difference suggested some independence of the sources underlying the two peaks. In addition, if the “Na” peak was simply the inversion of P1, then we should have been able to identify it in all children. However, in children under 30 months of age, the peak could be identified in less than ¾ of the cases. In children older than 30 months, the right temporal sites showed a clear peak for all but one case. Recall that P1 could be clearly identified for all but one case. It is also possible that the P1 peak has a different orientation and/or reflects processing in different cortical layers during the first year of life compared to later years (see section 4.6 for further discussion). A dipole analysis will be one way to address for which age groups the “Na” peak can be clearly separated from the P1 peak. Below, we discuss maturation of underlying cortical sources of CAEPs and will further address how to relate the scalp-recorded potentials to these sources.
4.6. Sources of CAEPs
The changes in latency of the T-complex peaks are likely to be due to increases in speed of transmission, related to myelination, axonal diameter, and processes underlying perceptual learning (particularly for speech) (Vaughan & Kurtzberg, 1992). In addition, overlap of different sources may lead to some apparent discontinuities in the developmental trajectory. A combination of modeling techniques and experimental manipulations will be needed to explore this latter possibility.
In the current study, we found evidence that the P1 peak observed in adults can be traced back, at least to the second year of life, since latency changed in a fairly smooth fashion. P1 is believed to reflect a primary generator in the intermediate portions of Heschel's gyrus as well as additional contributions from multiple generators with sources in primary auditory cortex (mesial Heschl's gyrus) and the planum temporale (Sussman, et al., 2008). The source of N2 is hypothesized to be in the supratemporal plane of auditory cortex (Ceponiene, et al., 2002; Bruneau & Gomot, 1998). In contrast, the sources of the temporal sites Ta and Tb are proposed to be in lateral aspects of auditory cortex (Ponton, et al., 2002; Howard, et al., 2000).
It is important to interpret our findings in light of what we know about infant brain development. Studies by Moore and colleagues reveal that only Layer I cortical axons are mature before six months of age (Eggermont & Moore, 2012). From 6 months to five years of ate, deep cortical layers (layers IV, V and VI) mature. These deep layers “communicate” with peripheral structures (i.e., thalamo-cortical pathways). It is not until after five years of age that more superficial cortical layers II and III mature (Eggermont & Moore, 2014). These superficial layers “communicate” with other cortical regions. Maturation in these layers includes increases in axon diameter and myelination, which lead to faster transmission time and increased synchrony (Vaughan & Kurtzberg, 1992). The current data show considerably later P1 peaks for the three- and six-month-old children compared to older children, which may reflect the shift from Layer I activity (which regresses after six months of age) to sources in deep layers. Alternatively, P1 may be generated in deep layers in the first six months, but the late broad peak may indicate considerable immaturity. Ponton and colleagues have proposed that P1 sources are in deep layers, and thus mature more rapidly than the sources of N1b, which are hypothesized to be in Layers II and III (Ponton, et al., 2002). Tonnquist-Uhlen et al. (2003) suggested that sources contributing to Ta and Tb might be in Layer IV because they appeared to mature early. However, many of the younger infants in our study only showed a clear P1 peak. It is possible that the other peaks (N2, P2) are not generated by Layer I activity and, thus, must wait for maturation of deeper cortical layers, resulting in their absence in infants under 6 months of age. In contrast, Kushnerenko and colleagues (2002) argued that the N2 (N250) and a following P2 (P350) were present from birth, because they could observe a slight negative-going deflection between two positive peaks in 2-4 day old infants. In addition, Na after 14 months of age may reflect maturation and changes in topography of the sources underlying P1. In other words, Na may largely reflect the opposite end of the P1 dipole after 14 months of age.
We saw an increase in latency of the P1 from 6 months of age to 12 or 18 months of age for some cases. It is possible that this discontinuity is related to a shift in the sources contributing to P1 (from layer I to deeper layers). As Eggermont and Moore (2012) pointed out, a puzzle in describing human auditory development is that the structural data show considerable cortical immaturity during the first six post-natal months, whereas neurophysiological and behavioral data are used to suggest fairly sophisticated processing. Moore and Linthecum (2007) have suggested that auditory discrimination must be supported by brainstem mechanisms or by layer I function during this early period. With this in mind, we also need to recognize that the absence of clear peaks for N2, P2, Na, Ta and Tb in many of the younger children may simply indicate that the underlying sources are highly immature and not yet functioning or that their function is variable (leading to considerable latency jitter). Our results suggest that 8-14 months is an important period of maturation for the sources underlying the P1 frontocentral peak, but that sources underlying the other peaks mature much later. Additional research will be needed to clarify the presence and sources of the N2, P2 and “Na” peaks in children under six months of age. In particular, it will be useful to use age-specific structural models to allow more precise modeling of source orientation. In particular, a careful examination of cortical maturation of Heschel's gyrus and the lateral surface of posterior superior temporal gyrus, believed to contribute to these different components (Howard, et al., 2000), and changes in orientation of these surfaces related to brain growth would help constrain modeling.
4.7. Hemispheric differences
Our study found more negative Na and Ta (when present) at right than left sites. Previous studies have found larger T-complex peaks at right compare to left sites (Tonnquist-Uhlen, et al.,2003; Shafer et al., 2011; Bishop et al., 2012). In these studies Ta was more positive at right than left sites, as well. The greater negativity of the Ta at the right sites in our study is likely to be due to the Na peak amplitude. That is, the positive-going deflection begins at a more negative point at the right than left site. It was difficult to evaluate whether Ta was more prominent (Na to Ta amplitude) at right sites compared to left in our study because so few of the younger children showed clear Ta peaks and older children might show the peak at only one of the temporal sites. For the seven oldest children, Ta was present at right sites and for five of these children Ta was more well-defined at the right than the left sites. Thus, our findings for the oldest children are consistent with previous studies suggesting more robust T-complex peaks at the right compared to left sites.
4.8 Limitations and Future Directions
It is possible that the radial and tangential sources underlying CAEPs that were identified by Ponton and colleagues (2002) have different orientations in children under five years of age and that these differences result in mixing that leads to a different patial pattern than found for adults. More specifically, it is possible that the prominent negativity we observed at the temporal sites partially reflects P1 sources. However, it is also possible that frontal site peaks may be influenced by T-complex sources in these age groups. Unmixing the underlying sources from the surface scalp distribution is not a trivial task. Approaches such as current source density (CSD) analysis (Pernier et al., 1989; Steinschneider, et al., 2011), independent component analysis (ICA) (e.g., Bishop et al., 2011) and dipole analysis (Albrecht et al., 2000; Ponton, et al., 2002;) can help in this process, but given the issue that the number of sources is often unknown, modeling by itself, cannot clarify the sources. Careful experimentation is also necessary. Several papers have suggested that some of the T-complex peaks mature at different rates than the frontocentral CAEPs. In particular, the frontocentral N1b is highly attenuated at ISIs less than 1000 ms in children under nine years of age. Gomes and colleagues (2001) have suggested that the lateral N1c (Tb) has a faster recovery rate from refractoriness (also see Ceponiene et al., 1998). This possibility suggests that a future study could use differences in adaptation and recovery rates for various underlying sources to help separate the contributions from these sources to the peaks measured at temporal and frontocentral sites. In addition, knowledge of cortical structure maturational patterns in infants and young children will help further constrain the possible sources of CAEPs in these young age groups (Eggermont & Moore, 2014).
We also have longitudinal data on a subset of the participants. A preliminary analysis of these data indicated a similar pattern of maturation as reported in the current paper. It will be important to examine these longitudinal data in relations to the multiple measures that are available from these children, which will provide insight on how other factors, such as language and cognitive development, modulate these ERP responses.
4.9 Clinical Implications
The pattern of findings reveals that the P1 peak at frontal sites and the large negative (Na) peak at temporal sites are the most likely measures that would be suitable for clinical use during the first year of life. Subsequently, the frontocentral N2 becomes robust in the second year of life. The Ta and Tb peaks are not reliably present earlier than four years of age. However, studies varying factors, such as ISI, stimulus and stimulus delivery will be necessary to support this conclusion. In addition the attenuated Ta amplitudes in 6-10 year of children with SLI observed in Shafer, et al. (2011b) (also see Bishop, et al., 2012) may indicate immaturity, since this pattern is consistent with the findings for younger children, who do not show clear Ta peaks.
5. Conclusions
The current study revealed dramatic changes in the CAEPs recorded over frontal and temporal sites from three-months of age to eight years of age. For the youngest children (less than 15 months), the frontal and temporal site patterns were very different from older children, with less-well defined and later peaks. Only the P1 peak was clearly present across all ages, although it differed substantially between children under eight months of age and over 12 months of age, suggesting that this time interval is an important period of maturation for the sources underlying P1. The frontal N2 peak was clearly identifiable by six months of age. A robust negative peak at temporal sites was clearly present in children older than 15 months of age, and shifted earlier in latency with increasing age. This negativity may be the emerging Na, or, alternatively it may partially or wholly reflect the inversions of P1. The Ta and Tb peaks were not identifiable until four years of age. The latency of these peaks shifted earlier with increasing age, and the amplitudes declined, once these peaks had emerged. In seven and eight year olds, the T-complex peaks had not yet reached adult values, indicating further maturation was required.
Table 6.
Mean amplitude (in μV) and standard deviation (in parentheses) of identifiable peaks (percentage provided in Table 4) at the left and right temporal sites.
| Group | Left Na | Left Ta | Left Tb | Right Na | Right Ta | Right Tb |
|---|---|---|---|---|---|---|
| 3-6 months | -1.78 (3.0) | -0.13 (3.3) | -2.5 (3.0) | -1.47 (1.5) | -0.62 (1.8) | -1.66 (1.9) |
| 6-8 months | -1.76 (1.6) | -0.59 (1.8) | -2.46 (2.1) | -0.68 (2.5) | 0.08 (2,4) | -1.08 (1.7) |
| 8-14 months | -1.59 (2.2) | -0.15 (2.2) | -1.64 (2.4) | -1.04 (1.6) | -0.97 (1.2) | -1.79 (1.5) |
| 14-21 months | -2.84 (1.8) | -1.96 (1.9) | -3.32 (2.4) | -4.5 (3.5) | -2.59 (4.1) | -3.79 (3.4) |
| 21-30 months | -2.63 (1.6) | -0.89 (1.5) | -3.03 (1.7) | -3.55 (1.9) | -1.55 (1.6) | -2.43 (1.2) |
| 30-48 months | -3.17 (2.5) | -1.27 (2.9) | -3.05 (2.4) | -4.1 (2.1) | -2.51 (2.7) | -2.79 (2.2) |
| 4 years | -2.32 (2.3) | -1.39 (2.2) | -1.72 (2.2) | -2.74 (2.4) | -1.36 (2.4) | -2.24 (1.9) |
| 5 years | -2.34 (2.3) | -0.43 (1.1) | -1.05 (1.0) | -4.15 (2.0) | -2.48 (2.7) | -3.16 (2.2) |
| 6 years | -2.32 (2.2) | 0.19 (2.7) | -1.65 (2.2.) | -2.58 (1.3) | -1.09 (1.6) | -1.82 (NA) |
| 7 years | -2.18 (0.9) | 0.04 (1.9) | -1.00 (1.4) | -2.46 (1.4) | -0.4 (1.7) | -1.24 (0.9) |
| adult | -1.29 (0.8) | -0.57 (0.7) | -1.24 (0.7) | -1.41 (1.3) | -0.33 (1.1) | -0.94 (1.0) |
Highlights.
The T-complex peak, Na, emerged earliest and shifted earlier in latency with increasing age
Ta and Tb emerged after three years of age and were not adult-like by eight years of age
The T-complex shows a protracted time course of maturation
Acknowledgments
This research was supported by NIH HD46193 to V. L. Shafer. The content of this paper is solely the responsibility of the authors and does not necessarily represent the official views of the National Institutes of Health or the National Science Foundation. We would like to thank A. Barias and M. Wroblewski for helping collect and analyze data, B. Tagliaferri for technical support and W. Strange and R. G. Schwartz for advice on the design. We also would like to thank the two anonymous reviewers and the Guest Editor, Elyse Sussman, for their insightful comments, which substantially improved the paper.
Footnotes
Publisher's Disclaimer: This is a PDF file of an unedited manuscript that has been accepted for publication. As a service to our customers we are providing this early version of the manuscript. The manuscript will undergo copyediting, typesetting, and review of the resulting proof before it is published in its final citable form. Please note that during the production process errors may be discovered which could affect the content, and all legal disclaimers that apply to the journal pertain.
References
- Albrecht R, Suchodoletz WV, Uwer R. The development of auditory evoked dipole source activity from childhood to adulthood. Clinical Neurophysiology. 2000;111(12):2268–76. doi: 10.1016/s1388-2457(00)00464-8. [DOI] [PubMed] [Google Scholar]
- Bishop DV, Hardiman MJ, Barry JG. Auditory deficit as a consequence rather than endophenotype of specific language impairment: Electrophysiological evidence. PLoS One. 2012;7(5):e35851. doi: 10.1371/journal.pone.0035851. [DOI] [PMC free article] [PubMed] [Google Scholar]
- Bishop DV, Anderson M, Reid C, Fox AM. Auditory development between 7 and 11 years: An event-related potential (ERP) study. PLoS One. 2011;6(5):e18993. doi: 10.1371/journal.pone.0018993. [DOI] [PMC free article] [PubMed] [Google Scholar]
- Bruneau N, Gomot M. Auditory evoked potentials (N1 wave) as indices of cortical development throughout childhood. In: Garreau B, editor. Neuroimaging in Child Neuropsychiatric Disorders. Springer Verlag; 1998. pp. 113–124. [Google Scholar]
- Bruneau N, Roux S, Adrien JL, Barthelemy C. Auditory associative cortex dysfunction in children with autism: Evidence from late auditory evoked potentials (N1 wave-T complex) Clin Neurophysiol. 1999;110(11):1927–34. doi: 10.1016/s1388-2457(99)00149-2. [DOI] [PubMed] [Google Scholar]
- Bruneau N, Roux S, Guerin P, Barthelemy C, Lelord G. Temporal prominence of auditory evoked potentials (N1 wave) in 4-8-year-old children. Psychophysiology. 1997;34(1):32–8. doi: 10.1111/j.1469-8986.1997.tb02413.x. [DOI] [PubMed] [Google Scholar]
- Cacace AT, Dowman R, Wolpaw JR. T complex hemispheric asymmetries: Effects of stimulus intensity. Hear Res. 1988;34(3):225–32. doi: 10.1016/0378-5955(88)90002-0. [DOI] [PubMed] [Google Scholar]
- Čeponienė R, Westerfield M, Torki M, Townsend J. Modality-specificity of sensory aging in vision and audition: evidence from event-related potentials. Brain research. 2008;1215:53–68. doi: 10.1016/j.brainres.2008.02.010. [DOI] [PubMed] [Google Scholar]
- Ceponiene R, Rinne T, Naatanen R. Maturation of cortical sound processing as indexed by event-related potentials. Clin Neurophysiol. 2002;113(6):870–82. doi: 10.1016/s1388-2457(02)00078-0. [DOI] [PubMed] [Google Scholar]
- Ceponiene R, Cheour M, Näätänen R. Interstimulus interval and auditory event-related potentials in children: Evidence for multiple generators. Electroencephalogr Clin Neurophysiol. 1998;108(4):345–54. doi: 10.1016/s0168-5597(97)00081-6. [DOI] [PubMed] [Google Scholar]
- Choudhury N, Benasich AA. Maturation of auditory evoked potentials from 6 to 48 months: Prediction to 3 and 4 year language and cognitive abilities. Clinical Neurophysiology. 2011;122(2):320–38. doi: 10.1016/j.clinph.2010.05.035. [DOI] [PubMed] [Google Scholar]
- Connolly JF. The influence of stimulus intensity, contralateral masking and handedness on the temporal N1 and the T complex components of the auditory N1 wave. Electroencephalogr Clin Neurophysiol. 1993;86(1):58–68. doi: 10.1016/0013-4694(93)90067-6. [DOI] [PubMed] [Google Scholar]
- Cunningham J, Nicol T, Zecker S, Kraus N. Speech-Evoked Neurophysiologic Responses in Children with Learning Problems: Development and Behavioral Correlates of Perception. Ear & Hearing. 2000;21:554–568. doi: 10.1097/00003446-200012000-00003. [DOI] [PubMed] [Google Scholar]
- Datta H, Shafer VL, Morr ML, Kurtzberg D, Schwartz RG. Electrophysiological indices of discrimination of long-duration, phonetically similar vowels in children with typical and atypical language development. J Speech Lang Hear Res. 2010;53(3):757–77. doi: 10.1044/1092-4388(2009/08-0123). [DOI] [PubMed] [Google Scholar]
- Dunn MA, Bates JC. Developmental change in neutral processing of words by children with autism. Journal of Autism and Developmental Disorders. 2005;35(3):361–76. doi: 10.1007/s10803-005-3304-3. [DOI] [PubMed] [Google Scholar]
- Eggermont JJ, Moore JK. Morphological and Functional Developmentof the Auditory Nervous System. In: Werner Lynne A, G, Fay Richard R, Popper Arthur N., editors. Human Auditory Development. Springer; New York: 2012. [Google Scholar]
- Eggermont JJ. On the rate of maturation of sensory evoked potentials. Electroencephalo- graphy and Clinical Neurophysiology. 1988;70:293–305. doi: 10.1016/0013-4694(88)90048-x. [DOI] [PubMed] [Google Scholar]
- Gilley PM, Sharma A, Dorman M, Martin K. Developmental changes in refractori- ness of the cortical auditory evoked potential. Clinical Neurophysiology. 2005;116:648–657. doi: 10.1016/j.clinph.2004.09.009. [DOI] [PubMed] [Google Scholar]
- Gomes H, Dunn M, Ritter W, Kurtzberg D, Brattson A, Kreuzer JA, Vaughan HG., Jr Spatiotemporal maturation of the central and lateral N1 components to tones. Dev Brain Res. 2001;129(2):147–55. doi: 10.1016/s0165-3806(01)00196-1. [DOI] [PubMed] [Google Scholar]
- Groen MA, Alku P, Bishop DV. Lateralisation of auditory processing in down syndrome: A study of T-complex peaks ta and tb. Biol Psychol. 2008;79(2):148–57. doi: 10.1016/j.biopsycho.2008.04.003. [DOI] [PMC free article] [PubMed] [Google Scholar]
- Howard MA, Vokov IO, Mirsky R, Garell PC, Noh MD, Granner M, Damasio H, Steinschneider M, Reale RA, Hind JE, Brugge JP. Auditory cortex on the human posterior superior temporal gyrus. The J of Comparative Neuro. 2000;416:79–92. doi: 10.1002/(sici)1096-9861(20000103)416:1<79::aid-cne6>3.0.co;2-2. [DOI] [PubMed] [Google Scholar]
- Kushnerenko E, Ceponiene R, Balan P, Fellman V, Huotilainen M, Näätänen R. Maturation of the auditory event-related potentials during the ¢rst year of life. NeuroReport. 2002;13:47–51. doi: 10.1097/00001756-200201210-00014. [DOI] [PubMed] [Google Scholar]
- Mahajan Y, McArthur G. Maturation of the auditory t-complex brain response across adolescence. International Journal of Developmental Neuroscience. 2013;31(1):1–10. doi: 10.1016/j.ijdevneu.2012.10.002. [DOI] [PubMed] [Google Scholar]
- Martin L, Barajas JJ, Fernandez R, Torres E. Auditory event-related potentials in well-characterized groups of children. Electroencephalography and Clinical Neurophysiology/Evoked Potentials Section. 1988;71(5):375–381. doi: 10.1016/0168-5597(88)90040-8. [DOI] [PubMed] [Google Scholar]
- Mason SM, Mellor DH. Brain-stem, middle latency and late cortical evoked potentials in children with speech and language disorders. Electroencephalogr Clin Neurophysiol. 1984;59(4):297–309. doi: 10.1016/0168-5597(84)90047-9. [DOI] [PubMed] [Google Scholar]
- Molfese DL. Predicting dyslexia at 8 years of age using neonatal brain responses. Brain and language. 2000;72(3):238–245. doi: 10.1006/brln.2000.2287. [DOI] [PubMed] [Google Scholar]
- Moore JK, Linthicum FH., Jr The human auditory system: a timeline of development. Int J Audiol. 2007;46(9):460–78. doi: 10.1080/14992020701383019. [DOI] [PubMed] [Google Scholar]
- Näätänen R, Picton T. The N1 wave of the human electric and magnetic response to sound: A review and an analysis of the component structure. Psychophysiology. 1987;24(4):375–425. doi: 10.1111/j.1469-8986.1987.tb00311.x. [DOI] [PubMed] [Google Scholar]
- Nielson-Bohlman L, Knight RT, Woods DL, Woodward K. Differential auditory processing continues during sleep. Electroenceph Clin Neurophysiol. 1991;79:281–290. doi: 10.1016/0013-4694(91)90124-m. [DOI] [PubMed] [Google Scholar]
- Novak GP, Kurtzberg D, Kreuzer JA, Vaughan HG., Jr Cortical responses to speech sounds and their formants in normal infants: Maturational sequence and spatiotemporal analysis. Electroencephalography and Clinical Neurophysiology. 1989;73:295–305. doi: 10.1016/0013-4694(89)90108-9. [DOI] [PubMed] [Google Scholar]
- Ohlrich ES, Barnet AB, Weiss IP, Shanks BL. Auditory evoked potential development in early childhood: A longitudinal study. Electroencephalography and Clinical Neurophysiology. 1978;44:411–423. doi: 10.1016/0013-4694(78)90026-3. [DOI] [PubMed] [Google Scholar]
- Pang EW, Taylor MJ. Tracking the development of the N1 from age 3 to adulthood: An examination of speech and non-speech stimuli. Clinical Neurophysiology. 2000;111(3):388–97. doi: 10.1016/s1388-2457(99)00259-x. [DOI] [PubMed] [Google Scholar]
- Pernier J, Perrin F, Bertrand O. Scalp current density fields: Concept and properties. Electroencephalogr Clin Neurophysiol. 1989;69:385–389. doi: 10.1016/0013-4694(88)90009-0. [DOI] [PubMed] [Google Scholar]
- Ponton C, Eggermont JJ, Khosla D, Kwong B, Don M. Maturation of human central auditory system activity: Separating auditory evoked potentials by dipole source modeling. Clin Neurophysiol. 2002;113(3):407–20. doi: 10.1016/s1388-2457(01)00733-7. [DOI] [PubMed] [Google Scholar]
- Ponton CW, Eggermont JJ, Kwong B, Don M. Maturation of human central auditory system activity: Evidence from multi-channel evoked potentials. Clin Neurophysiol. 2000;111(2):220–36. doi: 10.1016/s1388-2457(99)00236-9. [DOI] [PubMed] [Google Scholar]
- Scherg M, Von Cramon D. Evoked dipole source potentials of the human auditory cortex. Electroenceph clin Neurophysiol. 1986;65:344–360. doi: 10.1016/0168-5597(86)90014-6. [DOI] [PubMed] [Google Scholar]
- Shafer VL, Ponton C, Datta H, Morr ML, Schwartz RG. Neurophysiological indices of attention to speech in children with specific language impairment. Clinical Neurophysiology: Official Journal of the International Federation of Clinical Neurophysiology. 2007;118(6):1230–1243. doi: 10.1016/j.clinph.2007.02.023. [DOI] [PMC free article] [PubMed] [Google Scholar]
- Shafer VL, Sussman E. Predicting the future: ERP markers of language risk in infancy. Clin Neurophysiol. 2011;122(2):213–4. doi: 10.1016/j.clinph.2010.07.001. [DOI] [PubMed] [Google Scholar]
- Shafer VL, Yu YH, Garrido-Nag K. Neural mismatch indices of vowel discrimination in monolingually and bilingually exposed infants: Does attention matter? Neurosci Lett. 2012;526(1):10–4. doi: 10.1016/j.neulet.2012.07.064. [DOI] [PMC free article] [PubMed] [Google Scholar]
- Shafer VL, Schwartz RG, Martin B. Evidence of deficient central speech processing in children with specific language impairment: The T-complex. Clin Neurophysiol. 2011;122(6):1137–55. doi: 10.1016/j.clinph.2010.10.046. [DOI] [PMC free article] [PubMed] [Google Scholar]
- Shafer VL, Yu YH, Datta H. The development of English vowel perception in monolingual and bilingual infants: Neurophysiological correlates. J Phon. 2011;39(4):527–45. doi: 10.1016/j.wocn.2010.11.010. [DOI] [PMC free article] [PubMed] [Google Scholar]
- Shafer VL, Yu YH, Datta H. Maturation of speech discrimination in 4- to 7-yr-old children as indexed by event-related potential mismatch responses. Ear Hear. 2010;31(6):735–45. doi: 10.1097/AUD.0b013e3181e5d1a7. [DOI] [PubMed] [Google Scholar]
- Sharma A, Campbell J, Cardon G. Developmental and cross-modal plasticity in deafness: Evidence from the P1 and N1 event related potentials in cochlear implanted children. International Journal of Psychophysiology. 2014 doi: 10.1016/j.ijpsycho.2014.04.007. [DOI] [PMC free article] [PubMed] [Google Scholar]
- Sharma A, Kraus N, McGee TJ, Nicol TG. Developmental changes in P1 and N1 central auditory responses elicited by consonant-vowel syllables. Electroencephalography and Clinical Neurophysiology. 1997;104(6):540–5. doi: 10.1016/s0168-5597(97)00050-6. [DOI] [PubMed] [Google Scholar]
- Shucard DW, Shucard JL, Thomas DG. Auditory event-related potentials in waking infants and adults: a developmental perspective. Electroencephalography and Clinical Neurophysiology. 1987;68(4):303–10. doi: 10.1016/0168-5597(87)90051-7. [DOI] [PubMed] [Google Scholar]
- Stefanics G, Fosker T, Huss M, Mead N, Szucs D, Goswami U. Auditory sensory deficits in developmental dyslexia: A longitudinal ERP study. NeuroImage. 2011;57:723–732. doi: 10.1016/j.neuroimage.2011.04.005. [DOI] [PubMed] [Google Scholar]
- Steinschneider M, Liegeois-Chauvel C, Brugge J. Auditory evoked potentials and their utility in the assessment of complex sound processing. In: Winer JA, Schreiner C, editors. The Auditory Cortex. Chapter 25. New York: Springer; 2011. [Google Scholar]
- Sussman E, Steinschneider M, Gumenyuk V, Grushko J, Lawson K. The maturation of human evoked brain potentials to sounds presented at different stimulus rates. Hear Res. 2008;236(1-2):61–79. doi: 10.1016/j.heares.2007.12.001. [DOI] [PMC free article] [PubMed] [Google Scholar]
- Sussman ES, Steinschneider M. Attention modifies sound level detection in young children. Dev Cogn Neurosci. 2011;1(3):351–60. doi: 10.1016/j.dcn.2011.01.003. [DOI] [PMC free article] [PubMed] [Google Scholar]
- Tonnquist-Uhlen I. Topography of auditory evoked long-latency potentials in children with severe language impairment: The T complex. Acta Otolaryngol. 1996;116(5):680–9. doi: 10.3109/00016489609137907. [DOI] [PubMed] [Google Scholar]
- Tonnquist-Uhlen I, Ponton CW, Eggermont JJ, Kwong B, Don M. Maturation of human central auditory system activity: The T-complex. Clin Neurophysiol. 2003;114(4):685–701. doi: 10.1016/s1388-2457(03)00005-1. [DOI] [PubMed] [Google Scholar]
- Vaughan H, Kurtzberg D. Electrophysiologic indices of human brain maturation and cognitive development. In: Gunnar MR, Nelson CA, editors. Developmental behavioral neuroscience. Hillsdale, NJ, England: Lawrence Erlbaum Associates; 1992. [Google Scholar]
- Wolpaw JR, Penry JK. A temporal component of the auditory evoked response. Electroencephalogr Clin Neurophysiol. 1975;39(6):609–20. doi: 10.1016/0013-4694(75)90073-5. [DOI] [PubMed] [Google Scholar]