Abstract
Acoustic radiation force impulse (ARFI) imaging and shear wave elasticity imaging (SWEI) use the dynamic response of tissue to impulsive mechanical stimulus to characterize local elasticity. A variant of conventional, multiple track location SWEI (MTL-SWEI), denoted single track location SWEI (STL-SWEI) offers the promise of creating speckle-free shear wave images. This work compares the three imaging modalities using a high push and track beam density combined acquisition sequence to image inclusions of different sizes and contrasts. STL-SWEI is shown to have significantly higher CNR than MTL-SWEI, allowing for operation at higher resolution. ARFI and STL-SWEI perform similarly in the larger inclusions, with STL-SWEI providing better visualization of small targets ≤2.5 mm in diameter. The processing of each modality introduces different trade-offs between smoothness and resolution of edges and structures; these are discussed in detail.
Keywords: Acoustic Radiation Force, Shear Wave Elasticity Imaging, Single Track Location
Background
Acoustic Radiation Force Impulse Imaging
Acoustic Radiation Force Impulse (ARFI) Imaging has been under investigation since the early 2000’s (Nightingale et al., 2002), with early work proposing its use for identifying breast tumors (Sharma et al., 2004). ARFI images provide information about relative differences in tissue stiffness, similar to those generated with compressive strain imaging methods. However, ARFI offers advantages resulting from the generation of the mechanical excitation within the structure of interest and its limited susceptibility to out of plane motion artifacts. To generate a two-dimensional image, ARFI ensembles are translated across the imaging field of view (FOV), in the same way that a color Doppler image is created. Images are typically generated of the tissue displacement response, located within the excitation region and measured for 1–2 ms after excitation. For a given force, displacement is inversely proportional to tissue stiffness, and ARFI images portray relative differences in the displacement response within each excited region, either as the displacement at a fixed time step, or the maximum displacement. The three-dimensional (3D) distribution of radiation force, variations in acoustic attenuation, and the transient nature of ARFI excitations complicate the specific relationship between absolute displacement and material stiffness such that quantitative elasticity estimates are only possible with careful calibration. In most in vivo imaging scenarios, ARFI images are considered to provide qualitative maps of relative elasticity. Structural edges can be seen within a push beam (Dahl et al., 2007), so the resolution in ARFI images may be limited by the resolution of the tracking beams (Palmeri et al., 2006a), and as such be comparable to that of B-mode. For imaging small structures, however, contrast-to-noise ratio (CNR) is often considered to be the limiting factor, and the contrast in ARFI images has been shown to be reduced when the size of the push beam exceeds the size of the structure being imaged (Nightingale et al., 2006),(Palmeri et al., 2006a). This work will explore these effects in further detail and examine their impact on imaging small targets.
Shear Wave Elasticity Imaging
Shear Wave Elasticity Imaging (SWEI), originally described by Sarvazyan et. al. (Sarvazyan et al., 1998), and first demonstrated in vivo by our group (Nightingale et al., 2003), quantifies tissue stiffness by exciting the tissue with an ARFI push beam and monitoring the associated shear wave propagation through the region of interest. Time-of-flight (TOF) based reconstruction algorithms are then used to estimate the shear wave speed (SWS) (Palmeri et al., 2008; Wang et al., 2010; Rouze et al., 2010; Muller et al., 2009; Tanter et al., 2008; McAleavey et al., 2009; McLaughlin and Renzi, 2006; Chen et al., 2004), which in linear elastic materials is proportional to the square root of the shear modulus G divided by the density ρ:
| (1) |
SWS typically has units of m/s, G has units of kPa, and ρ has units of kg/m3 and is generally assumed to be close to that of water (1000 kg/m3) in tissue.
For a set of push beam locations xp and track beam locations xt, shear wave images can be made from measuring the propagation of each shear wave from its source xp through different locations xt. The images created from each push can then be overlapped and averaged to expand the lateral field of view and/or suppress noise (Tanter et al., 2008). This will be referred to as Multiple Track Location SWEI (MTL-SWEI), because the velocity is estimated with respect to the tracking locations. Fig. 1 shows the most complete configuration for a single depth, with the displacement shown at different times after excitation for all combinations of xt and xp. This dataset would be acquired one column at a time, since each column corresponds to a single push location and the full set of track locations. If we find the arrival time T for each combination of xp and xt, finding the MTL-SWEI estimate of velocity is described by taking the inverse of the partial derivative of T with respect to xt, or tracking the waves as they propagate along the columns in Fig. 1:
| (2) |
Figure 1.
Images of propagating shear wave displacement from a simulated dataset. The y-axis portrays track beam locations, which are monitored at the same time using parallel beamforming methods. The x-axis represents push beam locations, which are interrogated sequentially. Displacement through time is monitored for each push at all track beam locations. MTL-SWEI employs linear regression along the vertical axis xt (i.e., between the wave arrival times and the track beam locations, shown as the white vertical arrows), whereas STL-SWEI employs linear regression along the horizontal axis xt (i.e., between the wave arrival times and the push beam locations, shown as the white horizontal arrows). ARFI images are created from the early time displacements tracked at the push locations.
Single Track Location SWEI
Single Track Location Shear Wave Elasticity Imaging (STL-SWEI) is a novel variant of SWEI derived from the work of McAleavey et. al. (McAleavey et al., 2009). Mathematically, it can be considered as finding the partial derivative of the arrival times T with respect to xp instead of xt:
| (3) |
Rather than tracking the speed of a single propagating shear wave going through multiple tracking locations, this approach employs multiple, laterally-offset push beams and a single tracking location. This is shown in Fig. 1 as tracking the propagation across each row.
Because the velocity estimate in STL-SWEI is not dependent upon the specific track beam location, it is only subject to the same constraints on |xp − xt| as MTL-SWEI, which limit the usable lateral field of view for any single track beam to the regions around the track beam with sufficient displacement SNR. Following on this reciprocity, multiple track locations serve the same purpose as multiple push locations in MTL-SWEI to extend the usable lateral field of view (up to the widest spacing of push beams) and/or provide overlapping estimates. The trade-off for creating STL-SWEI images rather than MTL-SWEI images is that STL-SWEI sequences require exciting the tissue at every location to be measured, in the same way as an ARFI image is sequenced. STL-SWEI systems will therefore have lower maximum frame rates and higher acoustic exposures (identical to equivalent ARFI imaging systems) when compared to minimalist MTL-SWEI systems.
Speckle Bias
Speckle noise, or speckle bias, as described by McAleavey et al. (2003), can be thought of as an apparent variable spatial offset in the location of the tracking beam, correlated with the local stationary speckle pattern. For MTL-SWEI, speckle bias manifests as uncertainty ε in the tracking locations xt, which creates fixed offsets in the measured arrival times T, and an apparent over- or under-estimation of the time of flight between any pair of tracking beams. When using a closely-spaced set of track beams to find ∂xt/∂T, the total time of flight between the first and last beam becomes small relative to the variation due to the offset locations of the track beams. For the two-beam case, without knowing the actual effective location of each track beam xt1 + ε1 and xt2 + ε2, ΔT = T2 − T1 reflects the time of flight over a distance xt2 − xt1 + ε2 − ε1. As xt1 → xt2, xt2 − xt1 → 0, and ΔT reflects only ε2 − ε1, which dramatically effects the ratio Δxt/ΔT and thus the velocity estimate. To suppress the speckle noise, some form of spatial regularization must be used, such as using wider-spaced pairs of track beams or using a larger spatial kernel for performing a local linear regression on the arrival times. Thus, there is an inherent trade-off between lateral resolution and suppression of the speckle bias, which may limit MTL-SWEI’s effective resolution to a few times larger than the speckle size. Averaging data from multiple push locations may suppress arrival time jitter due to electronic noise, but cannot suppress the stationary speckle bias.
STL-SWEI, on the other hand, uses the same biased track location xt + ε to make each estimate of ∂xp/∂T, so the speckle bias effectively cancels itself out (Elegbe and McAleavey, 2013), leaving only the arrival time jitter noise. A local regression across xp or using wider spaced push beams gives the same trade-off between noise suppression and resolution as it does for MTL-SWEI, but because the primary source of noise is jitter, averaging over different track lines can also provide noise suppression without a loss of resolution. Because multiple track lines are readily acquired with parallel beamforming, this type of averaging can be expected to lower the burden on spatial regularization, resulting in effectively less noisy and/or higher lateral resolution imaging systems. STL-SWEI is subject to push beamforming errors, and variations in push beam location due to aberration would create similar bias effects that require some form of spatial regularization to suppress, but this type of noise is expected to be significantly less egregious than the speckle noise, which is inherent to all MTL-SWEI imaging.
Methods
Experimental Setup
A custom Zerdine phantom (CIRS) was imaged with a prototype Siemens 12L4 linear array transducer connected to a Siemens Acuson SC2000 ultrasound scanner (Siemens Healthcare, Mountain View, CA). The phantom contained four stepped cylinder inclusions, with diameters of 1.5 mm, 2.5 mm 4 mm, 6 mm, and 10 mm. The cylindrical inclusions had nominal shear moduli G originally listed by CIRS as 0.67 kPa, 5.33 kPa, 8 kPa, and 10.67 kPa, and a background with G = 2.67 kPa. Each combination of inclusion size and stiffness was imaged with six independent speckle realizations. The measured moduli of these inclusions have been observed to vary from the nominal values, so measurements were taken with Siemens’ validated commercial (MTL-) SWEI software, quantitative elasticity imaging (qEI), using a 9L4 linear array transducer on a Siemens Acuson S2000 scanner. Calibration measurements were taken in the largest inclusions to avoid boundary effects. Table 1 shows the calibration data, indicating lower estimated shear moduli than the nominal values. Values are reported as mean plus or minus one standard deviation over six acquisitions.
Table 1.
Phantom Elasticity Calibration
| Gnom (kPa) | SWSqEI (m/s) | GqEI (kPa) | |
|---|---|---|---|
| Background | 2.7 | 1.51 ± 0.03 | 2.30 ± 0.09 |
| Type I | 0.7 | 0.74 ± 0.03 | 0.55 ± 0.05 |
| Type II | 5.3 | 1.88 ± 0.04 | 3.55 ± 0.16 |
| Type III | 8.0 | 2.43 ± 0.02 | 5.89 ± 0.12 |
| Type IV | 10.7 | 2.54 ± 0.02 | 6.48 ± 0.08 |
Values are reported as mean ± one standard deviation over six measurements. SWSqEI is reported by the software, and GqEI is calculated as from equation 1, assuming ρ = 1 g/cm3.
Pulse Sequences
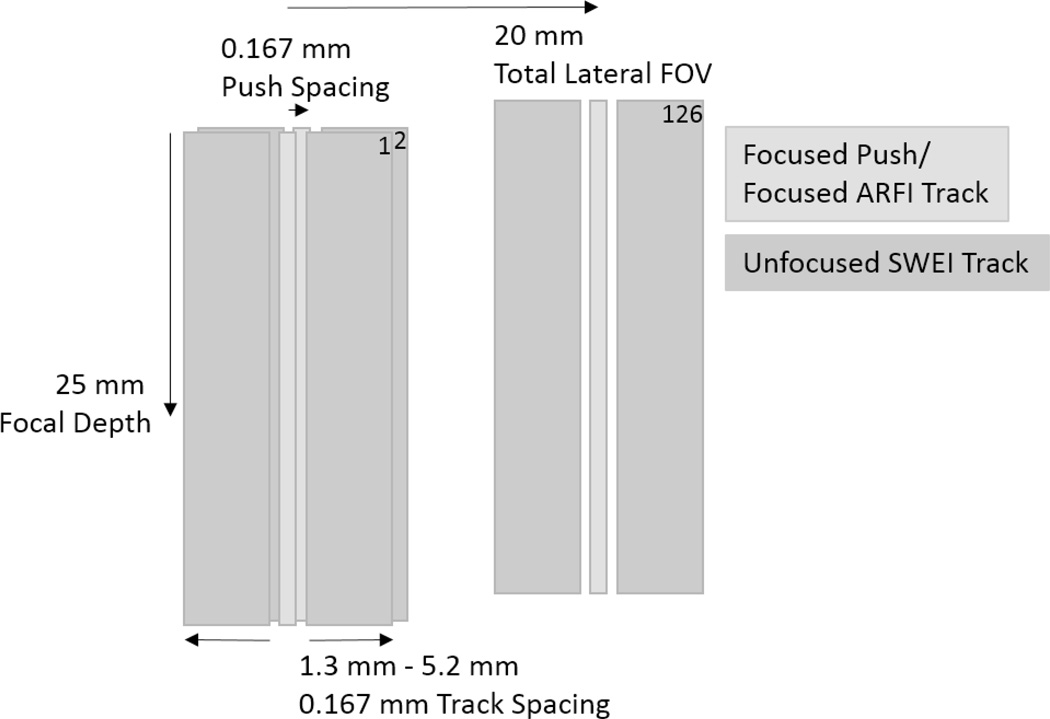
In order to maintain registration and to provide a closely-matched comparison between the three types of images without biasing the results in favor of one type, a pulse sequence was designed to acquire all three images in a single acquisition. A series of 400 cycle, 4.6 MHz excitation pulses, focused at 25 mm with an F-number of 2, were sequentially delivered every 0.167 mm (1/4 of the lateral beamwidth) across a 20 mm lateral field of view. Two 5 MHz tracking frames were recorded before each excitation and 40 after, at a frame rate of 10,000 fps to image the induced shear waves. For each excitation location, the sample was excited three times with different tracking configurations. Tracking lines were recorded at the excitation, and with 0.167 mm spacing to either side of the excitation, offset between 1.3 mm and 6.5 mm from the excitation, for a total of 32 lines to the left, one in line with, and 32 lines to the right of each excitation. A diagram is shown in Fig. 2. To acquire this dataset with 126 excitation locations and 8190 total tracking locations, 7 separate sub-acquisitions were used to meet the parallel receive beamforming and bandwidth limits of the scanner. The first three sub-acquisitions excited 42 locations each, tracking the locations to the right of each excitation with plane wave transmits and parallel receive beamforming. The second three sub-acquisitions excited the same set of locations, but used tracking beams to the left of each excitation. The final sub-acquisition excited the same locations a third time, but used focused tracking transmits to track the tissue in line with the excitation. The entire acquisition took approximately 60 seconds per image with extended delays between pushes, but with more parallel beams and a single continuous acquisition sequence, each 126-push dataset could be acquired in approximately 500 ms. Such beam density may be unnecessary for in vivo imaging, but the fine spacing of the push and track beams allows analysis of the resolution limits of each modality.
Figure 2.
Acquisition sequence. 126 excitations are tracked to the left and right at 0.167 mm track beam spacing. Push beam location translates 0.167 mm laterally between each acquisition. Focused track beams are used for measuring on-axis (ARFI) displacements.
Image Formation and Post-Processing
For each type of elasticity image, Loupas’s algorithm (Loupas et al., 1995) was used with a 1.2 mm (4λ) kernel to estimate axial displacement relative to an anchored reference frame prior to excitation. ARFI images were depth-normalized using an averaged reference axial displacement profile taken from the homogeneous background. Images are displayed as the ratio of the reference displacement profile to the measured profile for each lateral beam. Note that this is the normalized inverse of displacement. This gives the background signal a mean value of 1, and the signals from each inclusion indicate the ratio of shear modulus in the inclusion relative to the background (Palmeri et al., 2006a). For both STL-SWEI and MTL-SWEI, the displacements were differentiated through tracking time (“slow time”) at each pixel and band-pass filtered with a 3rd order Butterworth filter with cutoff frequencies of 50 and 1000 Hz. The filtered axial velocities were next fed through a directional filter (Manduca et al., 2003) for each push location (MTL-SWEI) or track location (STL-SWEI) to remove reflection artifacts. The axial displacements (ARFI) and velocities (SWEI) were each median filtered axially with a 0.54 mm kernel. The arrival time of the shear wave at each location was found from the peak of the velocity signal at each pixel, using quadratic subsample estimation, and excluding candidate estimates representing velocities far outside the expected range (greater than 6 m/s or less than 0.5 m/s). A moving lateral linear regression was applied around each sample, with varying kernel sizes from 0.16 mm (2-sample difference) to 4 mm (26-sample regression). For MTL-SWEI, each of the 126 push locations formed a 10.4 mm wide sub-image from all of the track beams associated with it. The same is true of STL-SWEI, but each sub-image represents a single track location and the pushes within 5.2 mm to either side. For the STL-SWEI images, an additional depth-dependent lateral shift was applied to each sub-image to compensate for the shape of the push beam (Hollender et al., 2014). Each sub-image was then laterally cropped to the center 6 mm, since velocity estimates with greater than 3 mm separation between the push and track beams had low displacement SNR; this also served to avoid boundary effects when using large kernel sizes. Finally, the 126 cropped sub-images for each mode were aligned and combined by taking the median at each aligned pixel across the resulting 20 overlapping estimates.
Image Statistics
Once the matched ARFI, MTL-SWEI, and STL-SWEI images were created, image statistics were computed for each combination of target size and stiffness. Statistics were computed separately for each combination of regression filter kernel (for SWEI images), and timestep (for ARFI images). The region of interest (ROI) inside of the lesion was defined as the circle with 2/3 the radius of the expected inclusion, concentric with the inclusion. The background was defined as a ring concentric with the inclusion and cropped to the axial depth of field, with an inner radius of 120% of the expected inclusion size, and an outer radius of 10 mm. The same ROIs were used for all three imaging modalities.
Contrast
Contrast was computed from the differences in the median pixel values of the inside and outside ROIs:
| (4) |
Medians were selected over means to keep the measurements robust to outliers, since shear wave speed is calculated as the reciprocal of arrival time differences, and some estimates are large outliers associated with arrival time differences close to 0. This also has the added benefit of making contrast agnostic of the fact that we are using inverted displacement images for ARFI. To get traditional ARFI displacement image contrast, the values are exactly the reciprocal of the inverse displacement image contrast.
Contrast-to-Noise Ratio
The contrast-to-noise ratio (CNR) was computed as the difference in the median pixel values of the regions, divided by the image noise, taken as the standard deviation of the background.
| (5) |
Resolution
The lateral resolution in each image was computed by fitting a trapezoidal function (flat center, flat background, linear ramps for edges) to the lateral profile through the axial center of each target, averaged over 0.5 mm of depth. Lateral resolution is reported as 60% of the ramp width, to represent the 20–80% edge width of the trapezoid.
Results
Arrival Time Regression Filter Size
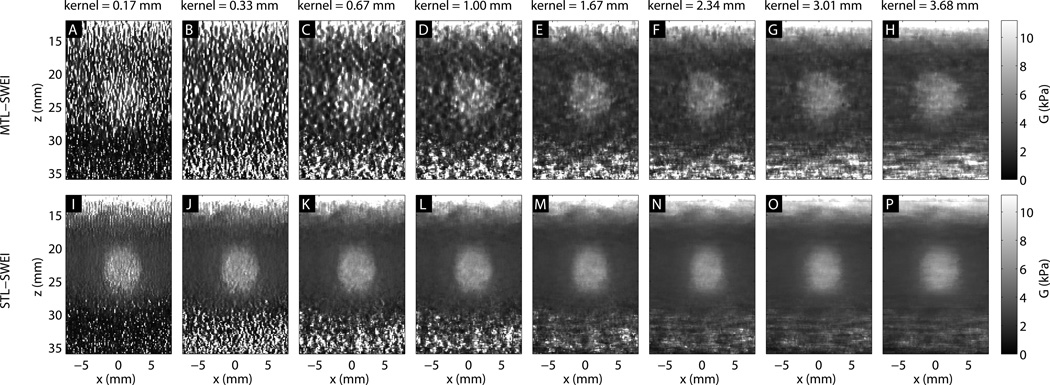
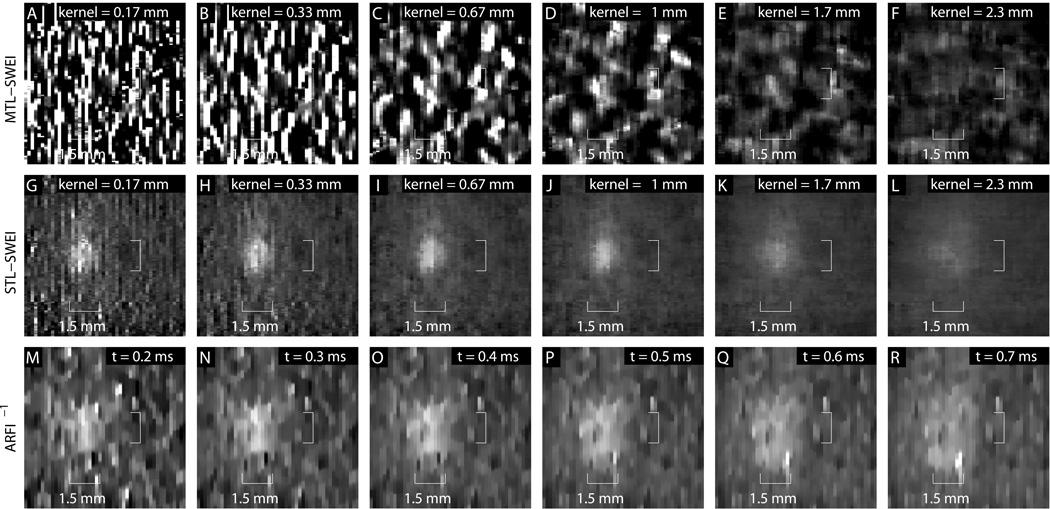
Figure 3 shows the MTL-SWEI and STL-SWEI images of the Type IV, 6 mm inclusion for arrival time regression kernel sizes between 0.17 mm (two-point difference) and 2.3 mm. As the kernel size increases, the image becomes smoother, suppressing noise but blurring the edges. For kernel sizes smaller than 1 mm, the inclusion becomes difficult to visualize in MTL-SWEI.
Figure 3.
SWEI images of the 6 mm, Type IV inclusion, using different lateral regression kernel sizes. The top row (A–F) shows MTL-SWEI images, while the bottom row (G–L) shows STL-SWEI images created from the same data.
ARFI Time Step Dependence
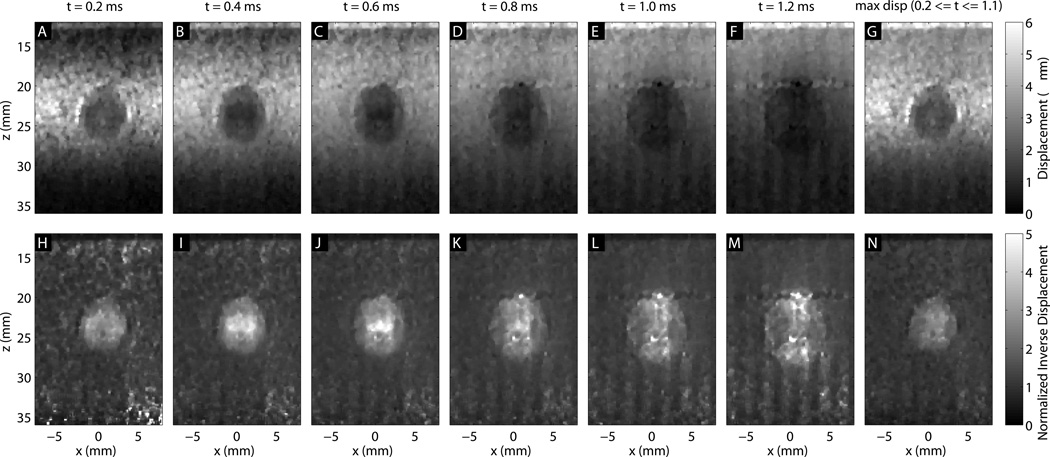
Figure 4 shows the ARFI displacements every 0.2 ms after excitation for the Type IV, 6 mm inclusion. The top row shows the raw displacements, and the bottom row shows the inverted displacements, normalized to the background displacement at each time step. The stiff inclusion appears to grow as the tissue motion evolves. The maximum displacement image keeps the lesion at its minimum size, but has inferior contrast to some frames. The higher-contrast region inside the inclusion appears to shrink with time step.
Figure 4.
ARFI frames of the 6 mm, Type IV inclusion at different times after excitation. The last column (G,N) shows the maximum displacement image. The first row (A–G) shows displacements, and the second row (H–N) shows inverse displacements normalized by the background profile. The lesion size appears to grow with time after excitation.
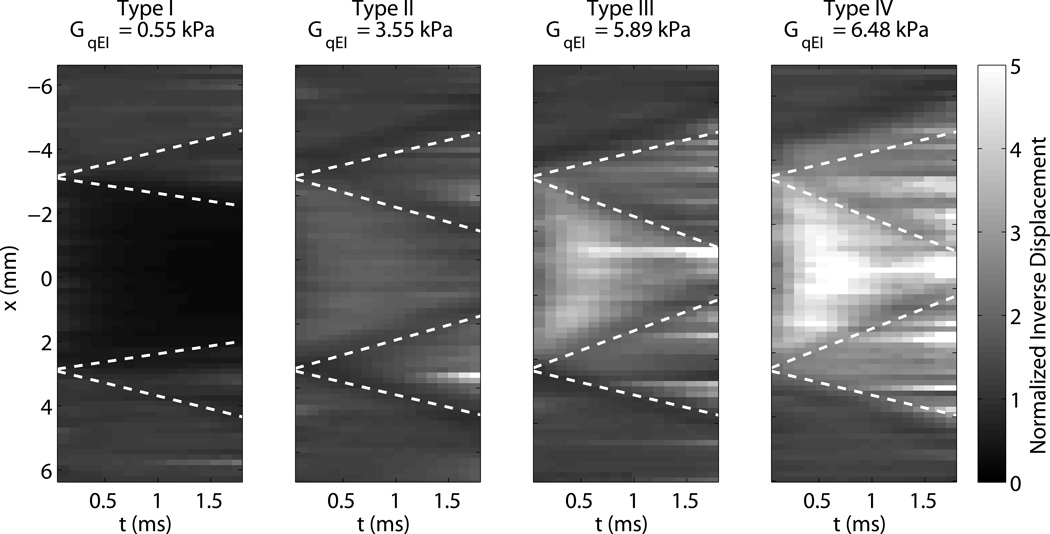
Figure 5 shows a single depth of each normalized inverted ARFI image, taken through the center of each 6 mm inclusion. The fourth image corresponds to the data shown in Fig. 4. The horizontal axis shows tracking time. Both contrast and the lesion boundary characteristics vary with tracking time step, as shear waves generated at each push location reflect off the boundary and come back to interfere with the displacement response at the push location. Superimposed on the image for reference are lines radiating from each boundary indicating one half of the shear wave speed (the round trip speed) in each medium. The distortion in each case appears to propagate away from the boundary at approximately one half the shear wave speed.
Figure 5.
Evolution of inclusion boundaries through tracking time for each of the 6 mm targets in normalized inverse ARFI. Lines representing half of the expected shear wave speed in each medium are drawn propagating from each boundary. The Type IV inclusions corresponds to the data shown in figure 4.
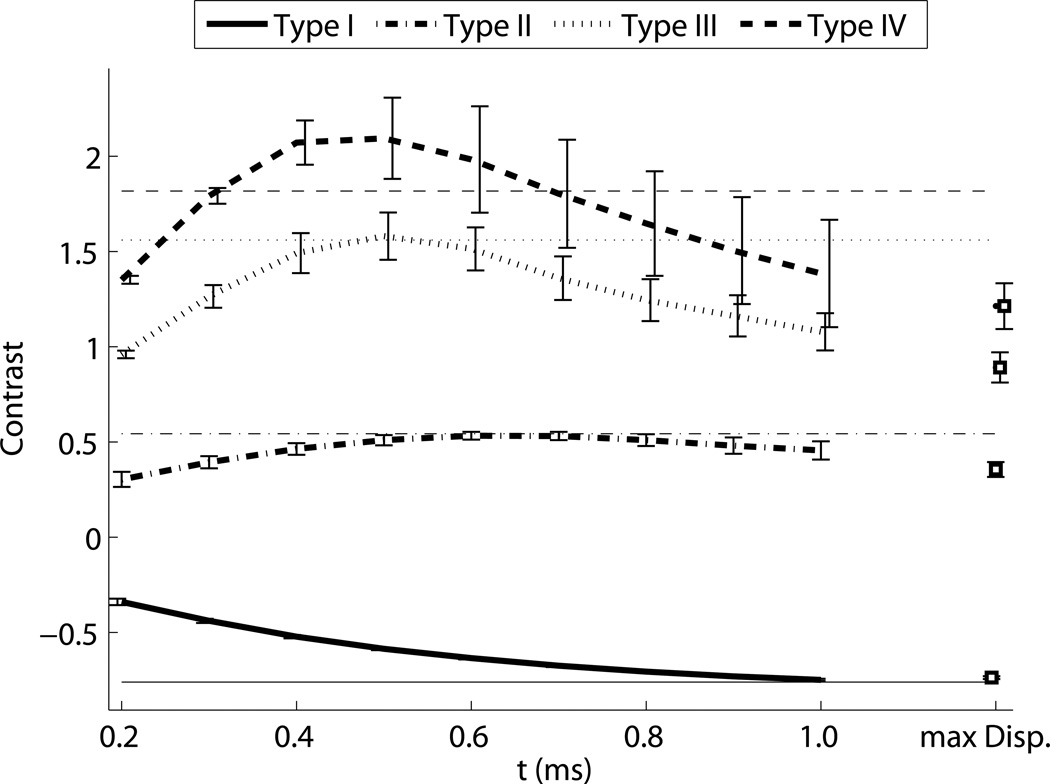
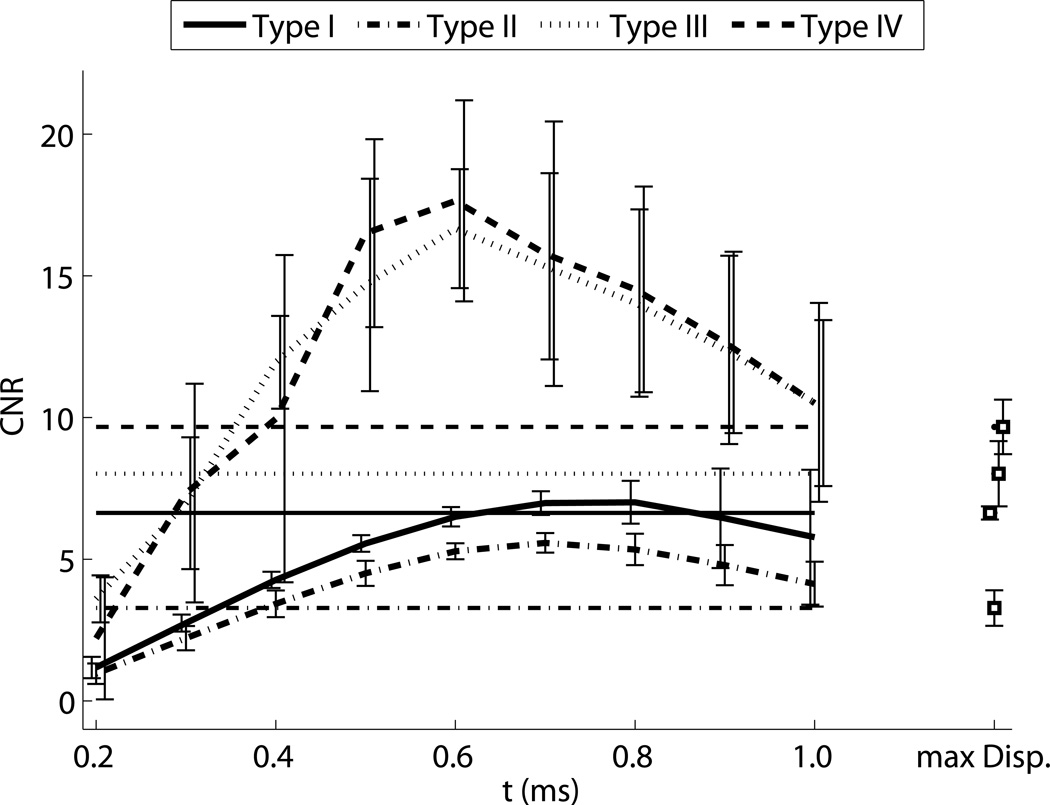
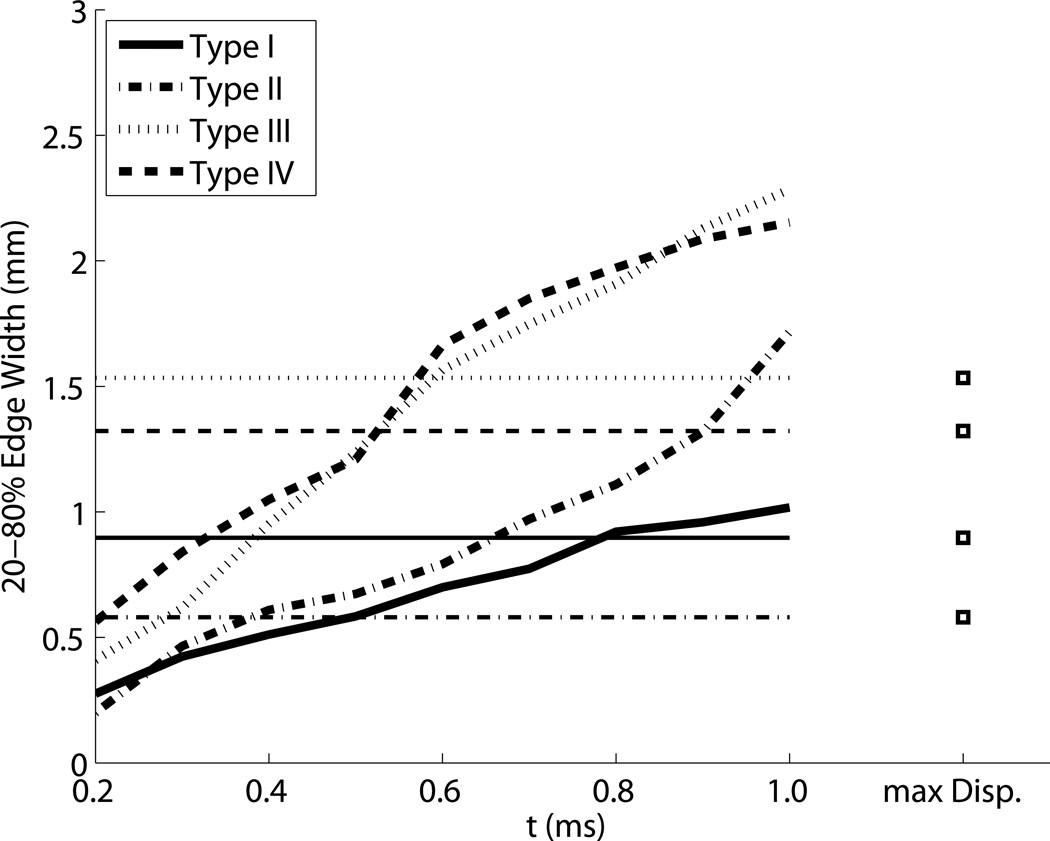
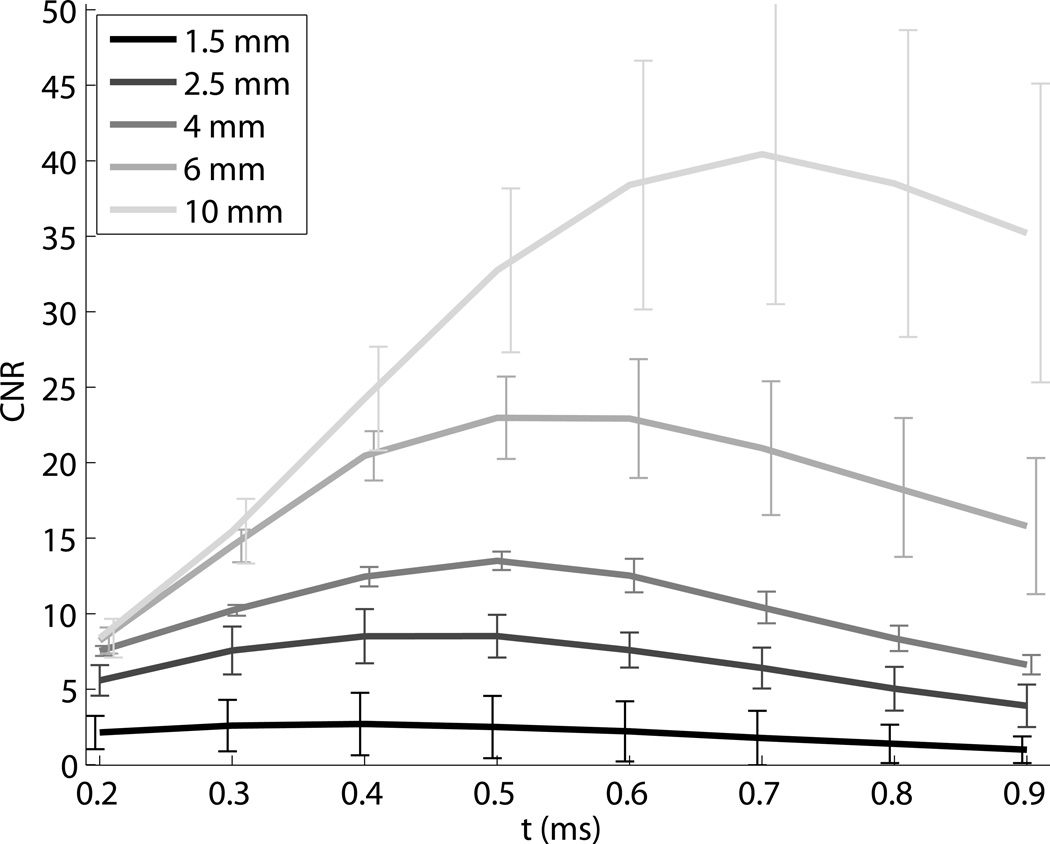
ARFI contrast, CNR, and resolution as a function of time step are shown in Fig. 6. The horizontal lines indicate the values associated with the corresponding maximum displacement image, except in the contrast image, where they indicate the calibrated nominal contrast from Table 1. Contrast is maximized between 0.5 ms and 1 ms after the push for the stiff inclusions, and has not reached a maximum negative peak at 1 ms after the push for the soft inclusion. For the Type IV inclusion, the peak contrast is greater than the nominal value. The maximum displacement values underestimate contrast for the stiff inclusions. Corresponding CNR values show more clearly that for ARFI images, CNR is maximized within the first millisecond, and reaches values up to twice as high as the maximum displacement image values. Lateral resolution decreases (edge width increases) with time step, approximately following the trends predicted by half of the shear wave speed (Fig. 5). The maximum displacement images have resolution similar to the frames 0.5 ms after excitation, which experimentally confirms the findings in simulations by Palmeri et al (Palmeri et al., 2006a). Figure 7 shows the CNR for each size of the Type IV targets, indicating that the CNR peaks at different time step based on target size. Based on this result, to obtain high combinations of CNR and resolution for each target, a time step of 0.3 ms was selected for the 1.5 and 2 mm inclusions, a time step of 0.4 ms was selected for the 4 and 6 mm inclusions, and a time step of 0.5 was selected for the 10 mm inclusions for display and comparison.
Figure 6.
ARFI contrast, CNR, and resolution as a function of tracking time step for each of the 6 mm inclusions. Line style indicates the type of target, and horizontal lines indicate the expected contrast in the top image, and the values associated with the corresponding maximum displacement images in the bottom two images.
Figure 7.
ARFI CNR as a function of time step for each of the Type IV inclusions. The size of the target determines the time step with the maximum CNR.
Image Comparison
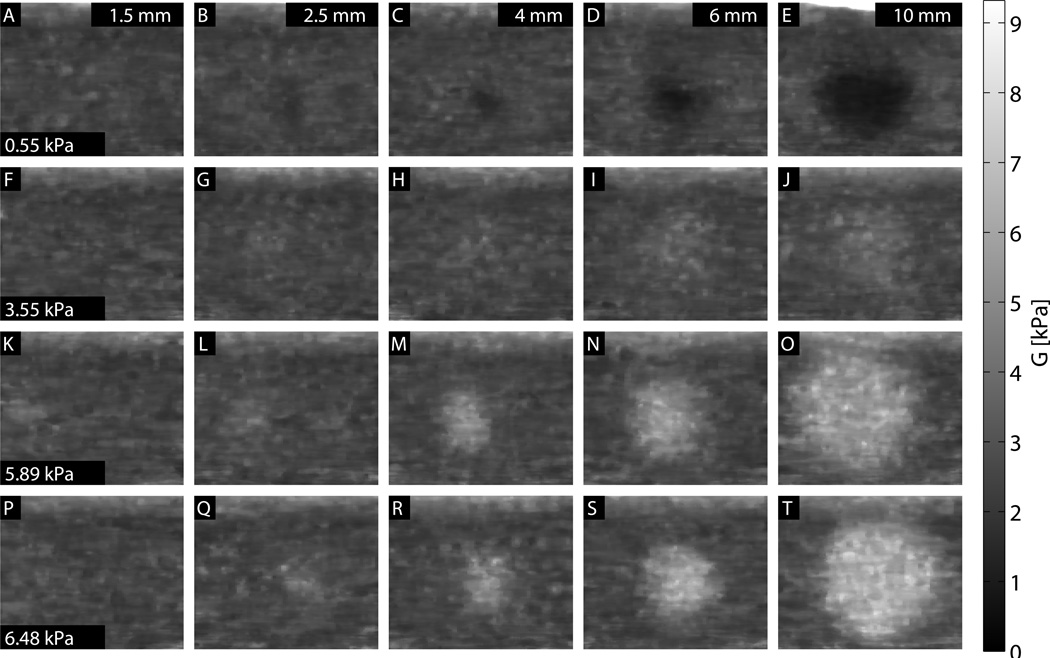
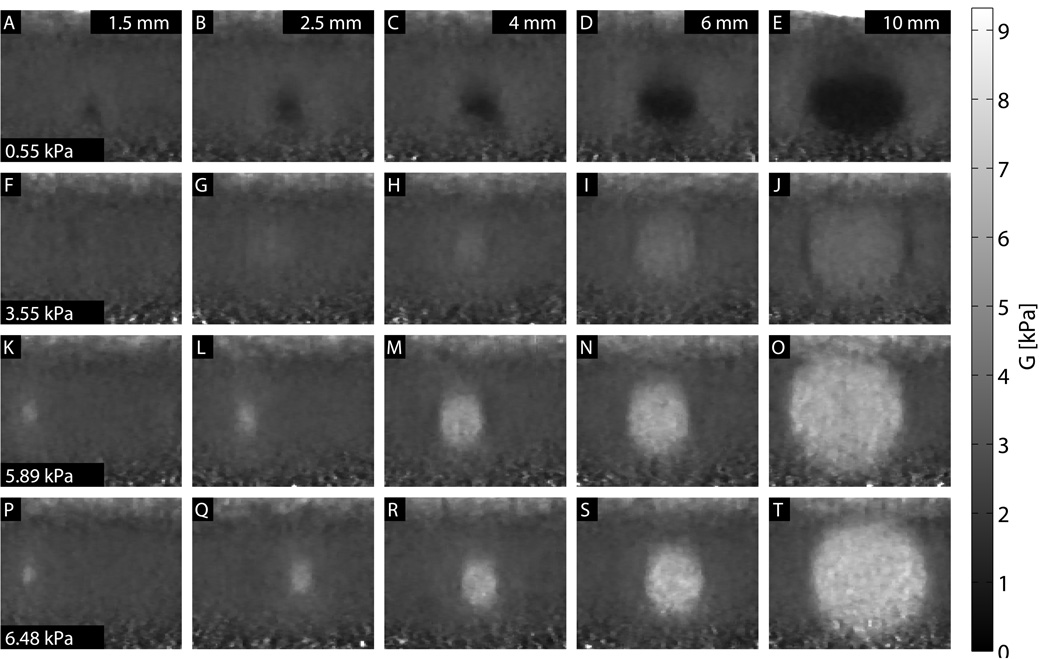
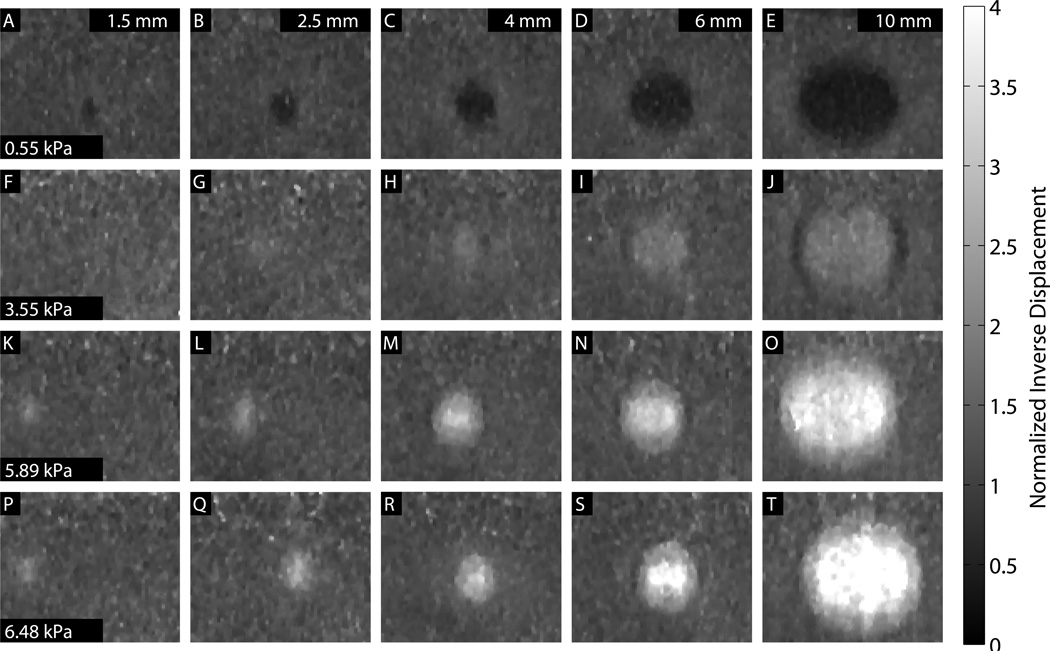
Images showing each combination of size and stiffness lesion are shown in Figs. 8, 9, and 10. In all three figures, a 0.33 × 0.33 mm median filter has been applied to the final images. For the ARFI images, values are shown as the inverse of displacement, relative to the background, and depth-normalized. For the SWEI images, values are shown as shear modulus G, with a dynamic range of 0 to 9.3 kPa. ARFI images have the equivalent dynamic range, at 0 to 4 times the normalized inverse background displacement value. For the MTL- and STL-SWEI images, the image shown is the median value of shear modulus G for all overlapping estimates within 3 mm of the excitation, which translates to 20 estimates for each pixel. In each set of images, lesion conspicuity increases with lesion size and contrast. The largest and stiffest inclusions show higher contrast in ARFI than in the corresponding SWEI images. The large, soft inclusions appear as ovals in all images.
Figure 8.
MTL-SWEI images images for each size and stiffness target. A 2.34 mm regression filter was used to calculate shear wave velocities from arrival times, and a 0.33 × 0.33 mm median filter has been applied to the images.
Figure 9.
STL-SWEI images images for each size and stiffness target. A 0.67 mm regression filter was used to calculate shear wave velocities from arrival times, and a 0.33 × 0.33 mm median filter has been applied to the images.
Figure 10.
ARFI images for each size and stiffness target at 0.3 ms (1.5 and 2.5 mm), 0.4 ms (4 and 6 mm) or 0.5 ms (10 mm) after excitation. A depth-dependent normalization has been applied. A 0.33 × 0.33 mm median filter has been applied to the images.
Contrast
Table 2 shows the contrast values calculated with each modality for the 6 mm targets. The values from the calibration (Table 1) are shown for reference.
Table 2.
Contrast Measurements (6 mm Targets)
| Type | qEI | MTL-SWEI | STL-SWEI | ARFI |
|---|---|---|---|---|
| I | −0.76 ± 0.04 | −0.62 ± 0.01 | −0.67 ± 0.01 | −0.52 ± 0.01 |
| II | 0.55 ± 0.12 | 0.37 ± 0.05 | 0.43 ± 0.01 | 0.42 ± 0.01 |
| III | 1.57 ± 0.09 | 1.31 ± 0.12 | 1.48 ± 0.07 | 1.53 ± 0.10 |
| IV | 1.82 ± 0.06 | 1.52 ± 0.12 | 1.74 ± 0.07 | 2.14 ± 0.10 |
6 mm Inclusions: CNR vs Resolution
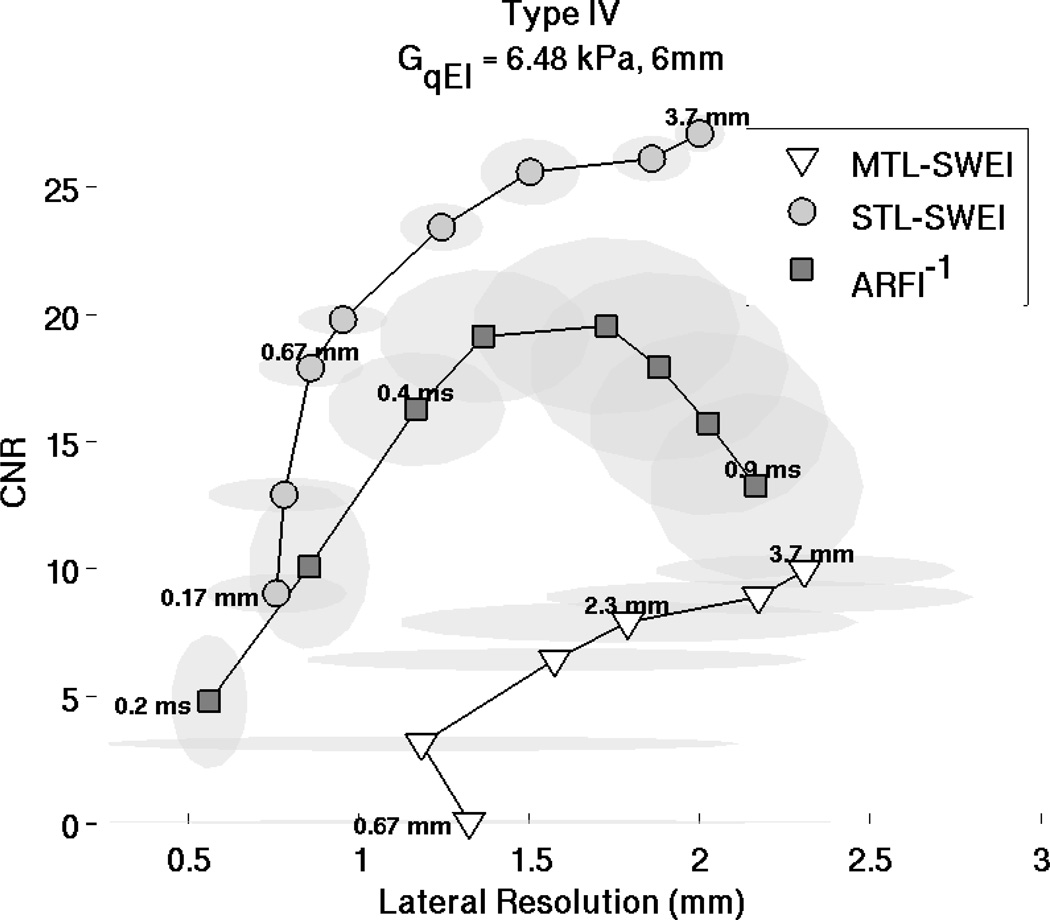
For the 6 mm diameter, Type IV inclusion, CNR is plotted against lateral resolution in Fig. 11. This plot portrays the ”trade-off curves” between system resolution and CNR for each of the imaging modalities, based on post-processing variables. The points on the trade-off curve for ARFI shows different values of time step, starting at 0.2 ms after the excitation in the bottom left, and incrementing each 0.1 ms to the right, with the highest CNR achieved at 0.5 ms. The points on the STL-SWEI and MTL-SWEI curves indicate different regression filter kernel sizes, with better CNR and worse resolution associated with larger kernels. STL-SWEI shows the best combinations of CNR and resolution, though ARFI achieves finer resolution for the 0.2 ms time step. The height and width of the semitransparent gray ovals show the standard deviation of each measurement over the six acquisitions.
Figure 11.
CNR and resolution tradeoff curves for ARFI, STL-SWEI and MTL-SWEI for the Type IV, 6 mm inclusions. The curve represents different time steps for ARFI (0.2 ms : 0.1 ms : 0.9 ms) and different regression filter sizes for STL-SWEI and MTL-SWEI. The regression filter kernel sizes are 0.16, 0.33, 0.66, 1, 1.66, 2.33, 3, and 3.66 mm, with smaller kernels having lower CNR and higher resolution than larger ones. ARFI achieves the highest combination of resolution and CNR, and STL-SWEI shows much higher resolution and CNR than MTL-SWEI.
1.5 mm Inclusions: CNR vs Resolution
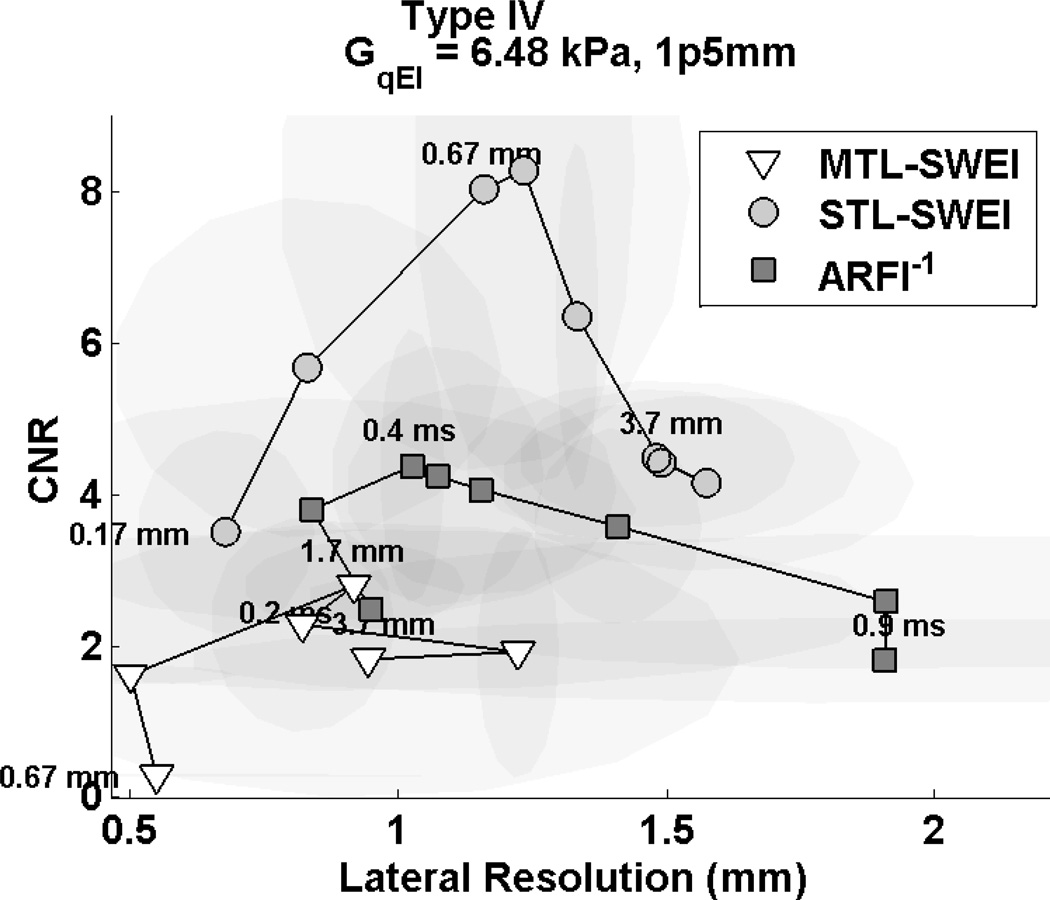
The tradeoff of different regression kernels and ARFI time steps is visualized in Fig. 12 for the 1.5 mm, Type IV inclusion. In the top row, MTL-SWEI fails to visualize the lesion effectively, with high noise associated with small kernels and low contrast associated with large kernels. In the middle row, STL-SWEI clearly shows the lesion with the correct size, trading resolution for noise suppression from left to right and eventually losing contrast as the kernel size exceeds the target size. In the bottom row, ARFI shows the inclusion, but overestimates the size and shows more noise in the background and inclusion than STL-SWEI. The CNR-resolution tradeoff curves are shown in Fig. 13. The CNR of this target is significantly lower than the CNR shown for the 6 mm, Type IV target from Fig. 11. While SWEI and ARFI both underestimate the stiffness of the inclusion (owing to resolution effects), STL-SWEI shows the lesion shape much more clearly than the other modalities, especially for the 0.67 mm kernel size.
Figure 12.
MTL-SWEI [A–F], STL-SWEI [G–L], and ARFI [M–R] images of the 1.5 mm, Type IV (GqEI = 6.48 kPa) inclusion at different regression filter values (for SWEI) and different time steps (for ARFI). The dynamic range and field of view have been reduced to improve inclusion visualization. Unlike the other figures, no median filter has been used in these images to highlight appreciation of the noise levels and edge resolution, though it is applied for the computation of the parameters in figure 13. The target is most clearly visualized and correctly sized in STL-SWEI.
Figure 13.
CNR and resolution tradeoff curves for ARFI, STL-SWEI and MTL-SWEI in the Type IV, 1.5 mm targets. The curve represents different time steps for ARFI (0.2 ms : 0.1 ms : 0.9 ms) and different regression filter sizes for STL-SWEI and MTL-SWEI. The regression filter kernel sizes are 0.16, 0.33, 0.66, 1, 1.66, 2.33, 3, and 3.66 mm, with smaller kernels having lower CNR and higher resolution than larger ones. STL-SWEI shows higher resolution and CNR than ARFI, and MTL-SWEI performs the poorest.
Discussion
Arrival Time Regression Filter Size
Figure 3 shows behavior consistent with the spatial regularization that regression provides. In both MTL-SWEI and STL-SWEI, the size of the regression kernel dictates the amount of smoothing that occurs. Larger regression kernels correspond to greater noise suppression, as well as increased lateral blurring of edges. For MTL-SWEI, this is critical to reduce the speckle noise that is overwhelming without a regression kernel. For STL-SWEI, without speckle bias, the image is already much smoother even with the smallest kernel, so regularization provides further smoothing for aesthetic purposes. Also visible in these images is the effect of the depth of field, as estimates shallow to and deep of the depth of field become unreliable. This behavior is predicted by the ARFI magnitude Fig. 4[A].
ARFI Time Step Dependence
Early after excitation, the displacement magnitude is driven by the acoustic radiation force and the tissue’s shear modulus at the point of excitation. The region under excitation shears against the surrounding tissue, which is initially stationary. As the motion evolves, the surrounding tissue moves axially as the shear waves begin to propagate. When the shear waves encounter a boundary, reflections are generated that propagate back towards the excitation. The time for the reflection to return to the excitation region is dictated by the shear wave speed, which results in the apparent “propagation” in Fig. 5. The distortion propagates out from the boundary at half the shear wave velocity to account for the round trip travel time. Once the wave has returned to the excitation, the observed displacements are a combination of the recovery and the reflected shear wave, which makes their magnitude become unreliable and results in the decreased resolution seen in Fig. 6. It is also important to note that the resolution of ARFI images is thus dependent on the target being imaged - an image of a very stiff inclusion will degrade quite quickly. Therefore, using the earliest possible time step will minimize the effect of shear waves and make the highest resolution images. However, looking at the CNR curves, it is apparent that there is a trade-off between resolution and CNR associated with the selection of a time step. This is in part due to decorrelation in the displacement estimates due to scatterer shearing under the point spread function for large focal displacements (McAleavey et al., 2003; Palmeri et al., 2006b). Once the shear wave propagation starts to spatially low-pass filter the scatterer motion, the jitter is reduced. Furthermore, the effects of CNR and resolution are not independent of one another. While this work used the center half of the target to calculate CNR and avoid boundary effects, in the smallest inclusions, shear waves are interfering across the entire inclusion very quickly - for the 1.5 mm, Type IV inclusion, even an infinitesimally narrow push in the center of the inclusion would have reflections interfering within 0.5 ms. This reduces the contrast, and therefore CNR, for the small inclusions. Figure 7 illustrates this effect, showing that CNR is maximized at different time steps for each target size. This necessitated the use of a variable time step for column in Fig. 10. We elected not to use the maximum ARFI displacement image, because while it showed clear definition of the stiff inclusions, it underestimated contrast, as can be seen comparing panels I and N in Fig. 4.
Modality Comparison
The larger and higher contrast lesions are visible in all the imaging modalities (Figs. 8, 9, and 10), while the smaller and lower contrast lesions are less clearly distinguished from the background in MTL-SWEI. ARFI shows the highest contrast for the largest inclusions, exceeding the expected contrast from qEI measurements. STL-SWEI has the best visualization of the smallest targets, with reduced noise in the background. The blurred edges in the MTL-SWEI images relative to the STL-SWEI images is at least in part due to the larger regression kernel size required for the MTL-SWEI images, since the CNR levels in the MTL-SWEI images would have completely obfuscated target visualization if the kernel size was set to 0.67 mm (the value used for STL-SWEI). The SWEI images both appear to show axial compression of the soft inclusions and extension of the stiff inclusions. ARFI images show this as well, though to a lesser extent. This is hypothesized to be due to preferential detection of the faster wave around axial boundaries.
For all modalities, the highest contrast occurs in the largest lesions (Table 2). ARFI shows the closest contrast to the expected values based on the qEI measurements, although it does overestimate contrast for the large stiff targets, possibly an artifact of differences in the tissue recovery dynamics between the target and background. Despite the increased noise in the MTL-SWEI images, both SWEI methods show similar contrast values for each type of inclusion, and only slightly underestimate contrast relative to the qEI measurements, possibly due to averaging in some degree of boundary blurring (this would be expected to be elevated for MTL-SWEI since it uses a larger kernel, which is indeed what we see). For the large inclusions, the contrast in ARFI outweighs the increased background noise relative to SWEI, since contrast can be selected to exceed nominal values indicated by qEI with time step selection (compare the values in table 2 with the curves in top panel of Fig. 6). For the smaller inclusions, the resolution degrades so quickly that the time-step of peak contrast is not reached before edge degradation from shear waves reaches across the target. STL-SWEI, however, does not have this limitation, so contrast starts to converge for smaller inclusions, and the speckle-free background yields higher CNR. This is most clearly seen in Fig. 12, whose third column does not show the increase in ARFI contrast seen in Fig. 4. The blurring effect due to shear wave interference motivates the use of an early time step to resolve the target size correctly, but the background noise at the early time steps is CNR-limiting.
Based on CNR and resolution, STL-SWEI shows the highest combination in the 6 mm inclusion, with a 0.67 or 1 mm regression kernel, followed closely by ARFI within the first 0.5 ms after excitation (Fig. 11). Using later time steps in ARFI only increases CNR to a point, after which the absolute displacement magnitudes diminish and jitter noise dominates the estimate. This is why the trade-off curve curls back down and to the right with increasing time steps, and is consistent with the results of Fig. 6. As the kernel size is increased for STL-SWEI and MTL-SWEI, CNR improves at the expense of resolution, and is expected to continue trending up and to the right until the kernel size exceeds the target size. This effect is seen in the 1.5 mm, Type IV target, as for kernels larger than 1 mm, the CNR starts coming back down due to contrast suppression (Fig. 13). A qualitative examination of Fig. 12 shows that the MTL-SWEI estimates are unreliable, since the “high resolution” data points correspond to extremely noisy data. Also, in the 1.5 mm inclusions, ARFI uniformly under-performs STL-SWEI due to the edge degradation curbing ARFI’s otherwise good contrast characteristics. The target is clearly detected in ARFI, but visualization is limited either by jitter in the early time steps or blurring in later time steps (Fig. 12 [M–R]).
Of particular note in Fig. 12 is how well STL-SWEI performs, even in the absence of a regression kernel. Each pixel in Fig. 12[G] is estimated from the arrival time difference between two adjacent push locations only 0.167 mm apart, corresponding to 75% overlap of the push beams. Parallel receive tracking allowed us to estimate each STL-SWEI pixel from multiple track beams, which enabled averaging of arrival time noise without the resolution loss associated with spatial regularization. It turned out that this provides adequate noise suppression for visualization of the target, and is a promising sign for STL-SWEI’s potential to image sub-millimeter targets.
It is important to note that the lateral resolution described here is the system resolution, and that the fundamental resolutions of STL-SWEI and MTL-SWEI are determined by the frequency and focus design of the push and track beams respectively. Over many speckle realizations, MTL-SWEI may hypothetically average out to the same edge resolution as STL-SWEI, but in the context of a practical imaging system, only a single speckle realization is available without using incoherent spatial or frequency compounding. Because the distortions introduced in MTL-SWEI arrival times by speckle are consistent across multiple pushes, they cannot be averaged out without some form of resolution-degrading spatial regularization like a large linear regression. Thus, although the chief benefit of STL-SWEI over MTL-SWEI may be in the suppression of noise through the cancellation of the speckle bias, for a given level of CNR necessary for target visualization, an STL-SWEI system can be operated with less spatial regularization and thus higher effective resolution than MTL-SWEI.
Study Limitations and Practical System Design Notes
Although the study was designed to compare ARFI, MTL-SWEI and STL-SWEI in a closely-matched imaging case, it is limited in a few ways:
Transmit Focusing
We used diverging wave transmits and parallel receive beamforming for SWEI tracking. While the beamforming doesn’t really affect STL-SWEI since the bias cancels itself out, the MTL-SWEI data may be adversely affected by the lack of transmit focusing. Recently developed advanced beam-forming techniques, such as approximations of synthetic aperture imaging like coherent compounding (Montaldo et al., 2009) would reduce the speckle size, but are not currently implemented on our equipment. With synthetic transmit focusing, the spatial regression kernel required to smooth out the speckle bias in MTL-SWEI could be reduced, as the point spread function would be narrowed by approximately 25% (the relative PSF width for two-way as opposed to one-way focusing). However, even with these techniques, the results here indicate that a 25% reduction in speckle size is unlikely to bring MTL-SWEI into contention with the speckle-free STL-SWEI, though it would be an improvement nonetheless.
Depth of Field
Another effect present in these images is a limited depth of field. Although the focal depth was chosen to center the targets within the depth of field, the large inclusions reach the edges. SWEI images degrade outside of the depth of field as the beam shape changes and the direction of propagation assumptions fall apart. ARFI images, on the other hand, are depth-normalized to provide a homogeneous background level appearance. This study was not designed to look at the CNR and resolution characteristics away from the focus, so all results represent the behavior within the depth of field. Further comparison and analysis will be necessary to evaluate performance shallow or deep to the focus. Figure 10 does show that at the edges of the depth of field in the 10 mm inclusions [E,J,O,T], the top and bottom of the lesion have lower contrast than in the center. This may indicate that although depth-dependent gain creates an axially-flattened background signal, it does not provide the same imaging quality away from the focus. For practical ARFI and SWEI imaging with a large depth of field, multiple focal zones could be used, either in the style of supersonic shear waves (Bercoff et al., 2004), or acquired sequentially (Rosenzweig et al., 2014).
Motion
This study did not evaluate the effects of motion. Axial tissue or transducer motion creates challenges for ARFI imaging, since the displacement signal is often being estimated on top of background motion, and incomplete filtering of the motion creates errors in the ARFI displacement magnitude that do not necessarily affect the estimates of arrival time, which are generally amplitude-independent for SWEI. However, axial motion filters have been studied extensively (Giannantonio et al., 2011), and if we assume effective axial motion filtering, ARFI images may be more resistant to inter-push motion than STL-SWEI images, since each measurement of ARFI displacement is only dependent on a single push and STL-SWEI measurements assume that the tissue remains relatively stationary over at least two pushes - more if one wants to perform a linear regression. Furthermore, any decorrelation in the tracking beams between excitations will cause partial introduction of speckle bias in STL-SWEI due to incomplete cancellation of the bias, whereas it will create partial suppression of speckle bias in MTL-SWEI through averaging. However, if the motion over the duration of the acquisition is large enough relative to the speckle size to see independent speckle realizations between MTL-SWEI pushes, the images are likely to be blurred and distorted to the extent that the presence of speckle noise suppression through averaging is a moot point. These effects will need to be explored in future work.
Attenuation, Dispersion, and Tissue Geometry
Although the ARFI images shown here were calibrated by the background response to show values proportional to shear modulus, this calibration is not always possible in vivo, since the absorption properties of tissue often vary from those of the phantom, and can be heterogeneous. Without calibration, ARFI imaging still provides a signal that may be useful for lesion identification, but does not provide absolute quantification. Whether or not this would reduce clinical efficacy is unclear, and dependent on the task. However, it should also be noted that shear wave speed measurements, while an absolute measurement themselves, do not completely represent tissue elasticity in the presence of dispersion effects due to viscoelasticity or geometry (Chen et al., 2004; Nenadic et al., 2011). Our phantom was linear, elastic, and, on the scale of our measurements, semi-infinite, so the assumptions are likely good here, but depending on the specific μ-E imaging task, additional work would need to be done to prove that absolute tissue quantification is possible from the shear wave speed.
Minimum System Requirements
A system with the ability to rapidly record individual channel data at high bandwidth would allow for optimal acquisition of ARFI, MTL-SWEI and STL-SWEI simultaneously, with the tracking for each push in the sequence beamformed everywhere in the field of view at arbitrarily high pixel density. However, a very simple system could theoretically also build the combined dataset from the superposition of a series of individual single-push-beam, single-track-beam responses, collectively covering all combinations of push and track beam positions. Such a system would take a relatively long time to acquire the image, but would not require state-of-the art hardware. Practically, ARFI and SWEI imaging systems will need to balance and optimize spatial sampling and framerate for the particular application, given the constraints of the hardware and software. An ARFI imaging system only needs a single track beam per excitation, and must sequentially steer the excitations across the field of view. STL-SWEI can also be implemented with a single track beam and sequentially-steered push beams, although such a system would have the field of view limitations of a single-push beam MTL-SWEI image. A small number of fixed-position parallel-receive track beams allows for superposition for averaging and/or extending the lateral field of view in the same way that MTL-SWEI uses multiple offset pushes. A small number of parallel-receive beams could also provide overlapping estimates if the beams are placed at fixed offsets relative to each push. An MTL-SWEI system only realizes the frame rate improvements over STL-SWEI through parallel receive beamforming, which require significantly higher bandwidth. Superposition of the responses from a small number of pushes reduces the burden on parallel receive, but at the expense of the high frame rate and low acoustic exposure.
Conclusion
This experiment investigated the performance of ARFI and SWEI for visualizing small structures. STL-SWEI processing allowed SWEI images to be generated with CNR and resolution better than ARFI, especially for small targets. STL-SWEI also significantly outperformed MTL-SWEI in terms of image quality, creating less noisy and higher resolution images, although MTL-SWEI may remain the only viable option for tasks where framerate, motion, or acoustic exposure are limiting factors. Since the time required to acquire an STL-SWEI image is no more than that for ARFI imaging, in situations were an ARFI image could be acquired, STL-SWEI can provide imaging of small structures at higher CNR and resolution than ARFI, with the absolute quantification of SWEI.
Acknowledgment
The authors would like thank Lily Kuo for acquiring the data used in this work, and Siemens for their in kind and technical support. This work was funded by NIH Medical Imaging Training Grant EB001040, and NIH grants R37HL096023 and R01EB01248.
Footnotes
Publisher's Disclaimer: This is a PDF file of an unedited manuscript that has been accepted for publication. As a service to our customers we are providing this early version of the manuscript. The manuscript will undergo copyediting, typesetting, and review of the resulting proof before it is published in its final citable form. Please note that during the production process errors may be discovered which could affect the content, and all legal disclaimers that apply to the journal pertain.
References
- Bercoff J, Tanter M, Fink M. Supersonic shear imaging: a new technique for soft tissue elasticity mapping. Ultrasonics, Ferroelectrics and Frequency Control, IEEE Transactions on. 2004;514:396–409. doi: 10.1109/tuffc.2004.1295425. [DOI] [PubMed] [Google Scholar]
- Chen S, Fatemi M, Greenleaf J. Quantifying elasticity and viscosity from measurement of shear wave speed dispersion. J. Acoust. Soc. Am. 2004;1166:2781–2785. doi: 10.1121/1.1739480. [DOI] [PubMed] [Google Scholar]
- Dahl J, Pinton G, Palmeri M, Agrawal V, Nightingale K, Trahey G. A parallel tracking method for acoustic radiation force impulse imaging. Ultrasonics, Ferroelectrics and Frequency Control, IEEE Transactions on. 2007;542:301–312. doi: 10.1109/tuffc.2007.244. [DOI] [PMC free article] [PubMed] [Google Scholar]
- Elegbe EC, McAleavey SA. Single tracking location methods suppress speckle noise in shear wave velocity estimation. Ultrasonic imaging. 2013;352:109–125. doi: 10.1177/0161734612474159. [DOI] [PMC free article] [PubMed] [Google Scholar]
- Giannantonio D, Dumont D, Trahey G, Byram B. Comparison of physiological motion filters for in vivo cardiac ARFI. Ultrasonic Imaging. 2011;332:89–108. doi: 10.1177/016173461103300201. [DOI] [PMC free article] [PubMed] [Google Scholar]
- Hollender P, Bottenus N, Nightingale K, Trahey G. Beamforming bias compensation in single track location shear wave elasticity imaging. Ultrasonics, Ferroelectrics and Frequency Control, IEEE Transactions on. 2014 doi: 10.1109/TUFFC.2017.2749566. in Review. [DOI] [PMC free article] [PubMed] [Google Scholar]
- Loupas T, Peterson R, Gill R. Experimental evaluation of velocity and power estimation for ultrasound blood flow imaging, by means of a two-dimensional autocorrelation approach. IEEE Trans. Ultrason. 1995;424:672–688. [Google Scholar]
- Manduca A, Lake DS, Kruse S, Ehman RL. Spatio-temporal directional filtering for improved inversion of mr elastography images. Medical image analysis. 2003;74:465–473. doi: 10.1016/s1361-8415(03)00038-0. [DOI] [PubMed] [Google Scholar]
- McAleavey S, Menon M, Elegbe E. Shear modulus imaging with spatially-modulated ultrasound radiation force. Ultrasonic imaging. 2009;314:217–234. doi: 10.1177/016173460903100401. [DOI] [PMC free article] [PubMed] [Google Scholar]
- McAleavey SA, Nightingale KR, Trahey GE. Estimates of echo correlation and measurement bias in acoustic radiation force impulse imaging. Ultrasonics, Ferroelectrics and Frequency Control, IEEE Transactions on. 2003;506:631–641. doi: 10.1109/tuffc.2003.1209550. [DOI] [PubMed] [Google Scholar]
- McLaughlin J, Renzi D. Using level set based inversion of arrival times to recover shear wave speed in transient elastography and supersonic imaging. Inverse Problems. 2006;222:707. [Google Scholar]
- Montaldo G, Tanter M, Bercoff J, Benech N, Fink M. Coherent plane-wave compounding for very high frame rate ultrasonography and transient elastography. Ultrasonics, Ferroelectrics and Frequency Control, IEEE Transactions on. 2009;563:489–506. doi: 10.1109/TUFFC.2009.1067. [DOI] [PubMed] [Google Scholar]
- Muller M, Gennisson JL, Deffieux T, Tanter M, Fink M. Quantitative viscoelasticity mapping of human liver using supersonic shear imaging: Preliminary in vivo feasability study. Ultrasound in medicine & biology. 2009;352:219–229. doi: 10.1016/j.ultrasmedbio.2008.08.018. [DOI] [PubMed] [Google Scholar]
- Nenadic I, Urban M, Mitchell S, Greenleaf J. Lamb wave dispersions ultrasound vibrometry (LDUV) method for quantifying mechanical properties of viscoelastic solids. Phys. Med. Biol. 2011;56:2245–2264. doi: 10.1088/0031-9155/56/7/021. [DOI] [PMC free article] [PubMed] [Google Scholar]
- Nightingale K, McAleavey S, Trahey G. Shear-wave generation using acoustic radiation force: In vivo and ex vivo results. Ultrasound Med Biol. 2003;2912:1715–1723. doi: 10.1016/j.ultrasmedbio.2003.08.008. [DOI] [PubMed] [Google Scholar]
- Nightingale K, Palmeri M, Trahey G. Analysis of contrast in images generated with transient acoustic radiation force. Ultrasound in medicine & biology. 2006;321:61–72. doi: 10.1016/j.ultrasmedbio.2005.08.008. [DOI] [PubMed] [Google Scholar]
- Nightingale K, Soo MS, Nightingale R, Trahey G. Acoustic radiation force impulse imaging: in vivo demonstration of clinical feasibility. Ultrasound in Medicine and Biology. 2002;282:227–235. doi: 10.1016/s0301-5629(01)00499-9. [DOI] [PubMed] [Google Scholar]
- Palmeri M, McAleavey S, Fong K, Trahey G. Dynamic mechanical response of elastic spherical inclusions of impulsive acoustic radiation force excitation. Ultrasonics, Ferroelectrics and Frequency Control, IEEE Transactions on. 2006a;5311:2065–2079. doi: 10.1109/tuffc.2006.146. [DOI] [PMC free article] [PubMed] [Google Scholar]
- Palmeri M, McAleavey S, Trahey G, Nightingale K. Ultrasonic tracking of acoustic radiation force-induced displacements in homogenous media. Ultrasonics, Ferroelectrics and Frequency Control, IEEE Transactions on. 2006b;537:1300–1313. doi: 10.1109/tuffc.2006.1665078. [DOI] [PMC free article] [PubMed] [Google Scholar]
- Palmeri M, Wang M, Dahl J, Frinkley K, Nightingale K. Quantifying hepatic shear modulus in vivo using acoustic radiation force. Ultrasound Med Biol. 2008;34:546–558. doi: 10.1016/j.ultrasmedbio.2007.10.009. [DOI] [PMC free article] [PubMed] [Google Scholar]
- Rosenzweig SJ, Palmeri ML, Nightingale KR. Analysis of rapid multi-focal zone arfi imaging. Ultrasonics, Ferroelectrics and Frequency Control, IEEE Transactions on. 2014 doi: 10.1109/TUFFC.2014.006594. in Review. [DOI] [PMC free article] [PubMed] [Google Scholar]
- Rouze N, Wang M, Palmeri M, Nightingale K. Robust estimation of the time-of-flight shear wave speed using a radon sum transformation. Ultrasonics, Ferroelectrics and Frequency Control, IEEE Transactions on. 2010;5712:2662–2670. doi: 10.1109/TUFFC.2010.1740. [DOI] [PMC free article] [PubMed] [Google Scholar]
- Sarvazyan A, Rudenko O, Swanson S, Fowlkes J, Emelianov S. Shear wave elasticity imaging; a new ultrasonic technology of medical diagnostics. Ultrasound Med Biol. 1998;249:1419–1436. doi: 10.1016/s0301-5629(98)00110-0. [DOI] [PubMed] [Google Scholar]
- Sharma AC, Soo MS, Trahey GE, Nightingale KR. Acoustic radiation force impulse imaging of in vivo breast masses. Ultrasonics Symposium, 2004 IEEE. Vol. 1. IEEE. 2004:728–731. [Google Scholar]
- Tanter M, Bercoff J, Athanasiou A, Deffieux T, Gennisson JL, Montaldo G, Muller M, Tardivon A, Fink M. Quantitative assessment of breast lesion viscoelasticity: initial clinical results using supersonic shear imaging. Ultrasound Med Biol. 2008;349:1373–1386. doi: 10.1016/j.ultrasmedbio.2008.02.002. [DOI] [PubMed] [Google Scholar]
- Wang MH, Palmeri ML, Rotemberg VM, Rouze NC, Nightingale KR. Improving the robustness of time-of-flight based shear wave speed reconstruction methods using ransac in human liver in vivo. Ultrasound in Medicine & Biology. 2010;365:802. doi: 10.1016/j.ultrasmedbio.2010.02.007. [DOI] [PMC free article] [PubMed] [Google Scholar]


