

Abstract
Centipede Scolopendra, a commonly used traditional Chinese medicine, has been shown to have anti-cancer effects. In this study, the inhibitory effect of alcohol extracts of Centipede Scolopendra (AECS) was more prominent when treating cells highly expressing epidermal growth factor receptor (EGFR) (A431 and HEK293/EGFR cells versus HEK293 cells). The elution profiles of AECS on cell membrane chromatography (CMC) column showed that AECS could bind to EGFR, and competition studies indicated that AECS and gefitinib may have direct competition at a single common binding site on EGFR. SiRNA knockdown of EGFR in A431 cells attenuated AECS effects, suggesting that EGFR was a target mediated by AECS. In a cell culture system, AECS dramatically induced apoptosis of A431 and HEK293/EGFR cells, which was associated with the effects on Bcl-2 family. Furthermore, AECS could alter EGFR kinase activity and reduce phosphorylation of EGFR and downstream signaling players AKT and Erk1/2. The mechanism of AECS to inhibit high-EGFR expression cell proliferation is due to its ability to induce apoptosis and modulate the EGFR pathway. This study might provide a novel therapy for cancer with high-EGFR expression.
Keywords: Centipede Scolopendra, apoptosis, cell growth, epidermal growth factor receptor
Introduction
Centipedes, especially Scolopendra subspinipesmutilans, have been used in oriental medicine to treat a variety of conditions, such as spasm, childhood convulsion, seizure, poisonous nodules, and diphtheria [1,2]. Centipedes have venom glands in their first pair of limbs and their venoms contain a large number of components with different biochemical and pharmacological properties. The venom composition and structure of centipedes are largely unknown. Recent studies have shown that serotonin, histamine, lipids, polysaccharids and polypeptides have been found in crude extracts of centipede venom glands [3,4]. There have been few studies of centipede venom’s ability to inhibit the growth of tumor [5].
Tumor growth is not only a result of uncontrolled proliferation but also of reduced apoptosis. Inducing cell apoptosis is one of the key strategies in anticancer therapy [6]. The human Bcl-2 homologues make up the major apoptosis-regulatory gene family. Bcl-2 family of proteins can be divided into two groups: suppressors of apoptosis (Bcl-2, Bcl-xl, Mcl-1, ect.) and activators of apoptosis (Bim, Bax, Bad, etc.). The accumulating data suggests that these proteins function at several stages of the signaling cascade, leading to apoptosis [7].
EGFR, a 170 kDa glycoprotein, is a transmembrane growth-factor-receptor tyrosine kinase that belongs to the HER/ErbB protein family. It consists of an extracellular ligand-binding domain, which has an ATP-binding site with tyrosine kinase activity and is capable of phosphorylating itself as well as other proteins [8]. Elevated level of EGFR is characteristic of numerous cancer types and appears to be frequently related to the development of cancer [9,10]. The tyrosine phosphorylated sites of EGFR allow proteins to bind through their Src homology 2 (SH2) domains, leading to the activation of downstream signaling cascades such as the Ras/mitogen activated protein kinase (MAPK) pathway and the phosphoinositide-3 kinase (PI3K)/AKT pathway [11-16]. Activation of the MAPK/ERK survival pathway overrides the effects of apoptotic signals by upregulating anti-apoptotic proteins such as Bcl-2 [14]. Inhibition of ERK activity results in increasing BimEL expression [17]. The PI3K/AKT pathway represents a key signal transduction pathway that mediates cell growth and blocks apoptosis. Activated PI3K generates phosphatidylinositol-3, 4, 5-triphosphate, which recruits phosphatidylinositol-dependent kinase (PDK) and AKT serine/threonine kinase at the plasma membrane, resulting in phosphorylation of AKT. AKT could phosphorylate Bad on Ser136, which makes Bad dissociate from the Bcl-2/Bcl-X complex and loses the pro-apoptotic function. In addition, the multi-domain Bcl-2 protein Bax is shown to be phosphorylated by AKT in a dependent manner at serine residue 184. Lowering p-AKT levels caused an increase in both the L&S forms of the pro-apoptotic protein Bim [18]. AKT mediated phosphorylation of Bax leads to changes in the conformation of Bax and blocks its activation [19]. The biological responses to EGFR signaling are pleiotropic and play critical role in epidermoid carcinoma pathogenesis [20]. Thus, EGFR and its downstream signaling molecules have emerged as promising targets for cancer therapy. Human A431 epidermoid carcinoma cells commonly overexpress EGFR and require wild-type EGFR for growth [21-24]. At the same time, the overexpression of wild-type EGFR sensitizes HEK293 cells to conventional EGFR TKIs when being transfected with EGFR [25-27]. So, high-EGFR expression cells (HEK293/EGFR cells constructed in our laboratory [28] and A431 cells) are adopted in this study. In conclusion, the anti-tumor activity of AECS was evaluated and the mechanism of AECS through inducing apoptosis and targeting EGFR signaling pathway in cancer treatment was investigated.
Materials and methods
Chemicals and reagents
Adult specimens of Centipede Scolopendra (Scolopendra subspinipes mutilans) were purchased from Laobaixing pharmacy in Shaanxi Province of China. Identification of the specimens was done at the Pharmacognosy Laboratory in the Department of Pharmacy, Xi’an Jiaotong University where a voucher specimen is deposited. Gefitinib was purchased from Ange Pharmaceutical (Nanjing, China). Dulbecco’s minimal essential medium (DMEM), Ham’s F12 nutrient medium, RPMI 1640 medium, dimethylsulfoxide (DMSO), and trypsin were purchased from Sigma-Aldrich (St. Louis, MO, USA). 3-(4,5-dimethylthiazol-2-yl)-2.5-diphenyl-2H-tetrazolium bromide (MTT) was purchased from Sigma-Aldrich (St. Louis, MO, USA) and trypan blue was purchased from Sunshine Biotechnology (Nanjing, China). The RNAfast200 kit was purchased from Fastagen (Shanghai, China) and lipofectamine 2000 reagent was purchased from Invitrogen (Carlsbad, USA). PrimeScript RT Master Mix Perfect Real Time kit, SYBR® Premix Ex TaqTM II and a Thermal Cycle Dice Real time system were purchased from TaKaRa (DRR036A) biotechnology (Dalian, China). Annexin V-FITC apoptosis detection kit and Hoechst 33258 staining kit were purchased from Beyotime Institute of Biotechnology (Shanghai, China). Protease inhibitor cocktail and phosphatase inhibitor cocktail were purchased from Roche (Roche Technology, Switzerland). Anti-EGFR, anti-phospho-EGFR, anti-AKT, anti-phospho-AKT, anti-Erk1/2, anti-phospho-Erk1/2, anti-Bax, anti-Bad and anti-Bcl-2 antibody were purchased from Cell Signaling (Cell Signaling Technology, USA). Anti-Bim was purchased from Santa Cruz (Santa Cruz Biotechnology, Europe). Rabbit anti-GAPDH was purchased from Santa Cruz Biotech (CA, USA). Rabbit anti-mouse IgG, BCA protein assay reagent kit and SuperSignal® West Pico were purchased from Pierce (Pierce Biotech, USA). EGFR kinase was obtained from Carna Biosciences (Kobe, Japan). HTRF® package insert was purchased from Cisbio Bioassays (Bedford, MA, USA).
Cell culture
HEK293 cell was obtained as a gift from Professor Xu Li (School of Medicine, Xi’an Jiaotong University). Human A431 epidermoid carcinoma cells, MCF7 breast cancer cells, A549 lung cancer cells and HCC827 lung cancer cells were obtained from Shanghai Institute of Cell Biology in the Chinese Academy of Sciences. A high-EGFR expression HEK293/EGFR cell line was constructed at the Natural Drug Research and Engineering Center of Xi’an Jiaotong University [25]. A431 cells overexpressing EGFR were maintained in Ham’s F12 supplemented with 10% (v/v) fetal bovine serum (FBS), HCC827 and A549 cells were maintained in RPMI 1640 supplemented with 10% (v/v) FBS, HEK293 and MCF7 cells were cultured in DMEM supplemented with 10% (v/v) FBS and HEK293/EGFR cells were cultured in DMEM supplemented with 10% (v/v) FBS and 200 mg/ml G418. All cell lines were incubated at 37°C in a 5% CO2 incubator with saturated humidity.
Extract of Centipede Scolopendra
Centipede Scolopendra was crushed into fine powder. Initially, 50 g Centipede Scolopendra was decocted in 1500 ml ethanol solution (3/2 by v/v; ethanol/water) for 1 h, and then filtered to obtain the filtrate concentrate. The filter residue was then put into 750 ml ethanol solution (3/2 by v/v; ethanol/water), and process for collecting concentrate was repeated. The both filtrate concentrates were combined and filtered once again. Finally, the extract was concentrated by use of rotary evaporator [29].
Cell proliferation assay
The effects of AECS on cell viability were evaluated by MTT assay. Exponentially growing A431 cells, HEK293/EGFR cells and HEK293 cells were plated into 96-well plates at a density of 2×10⁴ cells per well in complete medium. After 24 h, cells were treated with AECS at different concentrations for 24 h, 48 h and 72 h, respectively. Then fresh cell culture medium containing 10% FBS and 20 μl of MTT solution (5 mg/ml) were added to each well. Each well was incubated for an additional 4 h at 37°C. After the removal of medium, 150 μl DMSO was added to each well. The absorbance was recorded at the wavelength of 490 nm in the micro-plate reader and the inhibition ratio (I %) was calculated [30].
Trypan blue staining assay
Exponentially growing A431 cells, HEK293/EGFR cells and HEK293 cells were plated into 24-well plates at a density of 1×10⁵ cells per well in complete medium. After 24 h, cells were treated with AECS at different concentrations for 48 h. Cells were then trypsinized and mixed 9:1 with 0.4% solution of Trypan blue stain. Then cells were counted on the hemocytometer over the course of three minutes. Nonviable cells absorbed the dye and appeared blue, while viable cells excluded the dye.
Preparation of CMSP
HEK293/EGFR cells were harvested and washed three times with 5 mM PBS by centrifuging at 3,000×g for 10 min, and the pellet was re-suspended with 50 mM Tris-HCl (pH 7.4), followed by ultrasonic destruction for 30 min. The resulting homogenate was clarified by centrifugation at 1,000×g for 10 min, and the supernatant was centrifuged at 12,000×g for 10 min. The precipitate was then suspended with 5 mM PBS [31]. Briefly, the CMSP was prepared by adsorption of the cell membrane suspension (5 mL) on the activated silica (0.05 g) under vacuum and with a gentle agitation. The CMSP was placed overnight and then washed with 5 mM PBS five times. Finally, the mixture obtained was packed into a column (10×2.0 mm I.D.) using a wet packing method (10 MPa, 5 min). All the procedure was performed at 4°C.
CMC analysis was performed on a Shimadzu LC-20A apparatus that consisted of two LC-20AD pumps, a DGU- 20A3 degasser, an SIL-20A auto sampler, a CTO-20A column oven, and an SPD-M20A diode array detector (Shimadzu, Kyoto, Japan). The data were acquired by the LCsolution software (Shimadzu, Kyoto, Japan). The detection wavelengths were 254 nm.
Competitive binding study
The study was performed by using gefitinib as site-specific probe. The concentrations of drug solutions ranged from 0.035 to 1.12 mg/L. The samples consisted of 5 μL injections of 0.5 μM gefitinib.
The breakthrough curves of ligands at several different concentrations were recorded. Next, the standard solution of gefitinib was injected into the column.
In the HEK293/EGFR CMC model, the Eqution 1 is used to examine the location of the binding region on EGFR by using competitive binding study [32,33]:
1/K = (KDAVM/KDImL)[A] + KDAVM/mL (1)
Eqution 1 represents the relationship that is expected for a system with direct competition at a single type of binding site between the retention factor for the injected probe (A) and the molar concentration of the competing agent in the mobile phase (I). Terms: KDA and KDI are the dissociation equilibrium constants for the injected probe and competing agent, respectively, at the site of competition. [A], mL, and Vm are the molar concentration of ligands in the effluent, immobilized receptors at the surface of the stationary phase, and the dead volume of the column, respectively. On the basis of Eqution 1, a plot of 1/k versus [A] should produce a linear relationship for a system with single-site competition.
Kinase assay
The ability of AECS to inhibit the phosphorylation of a peptide substrate by EGFR kinase was evaluated in a microtiter plate format using homogeneous time-resolved fluorescence (HTRF). HTRF Kinase™-TK is a generic method for measuring tyrosine kinase activities using one substrate and a universal detection system. The HTRF Kinase™-TK assay format involves the two steps described below: 1. Enzymatic step: During this step, the kinase will phosphorylate the substrate. The TK Substrate-biotin is incubated with the kinase. ATP is added to start the enzymatic reaction. 2. Detection step: The detection reagents will catch the phosphorylated substrate. The resulting TR-FRET signal is proportional to the phosphorylation level. The TK-Antibody labeled with Eu3+-Cryptate and streptavidin-XL665 are then added with EDTA (used to stop the kinase activity). The kinase reaction is started by the addition of ATP (step 1) and is stopped by the addition of the detection reagents which contain EDTA (step 2). Initially, 2 μl EGFR kinase and 2 μl substrate were separately added to a 384-well plate, and 4 μl variable concentrations of AECS (diluted in kinase buffer) were then added to the assay plate. 2 μl ATP was added and the reaction was allowed to proceed at 37°C for 30 min. The TK-Antibody (5 μl) labeled with Eu3+-cryptate and streptavidin-XL665 (5 μl) was then added with EDTA to detect the phosphorylated product at room temperature for 1 h. Then the fluorescence was measured at 615 nm (cryptate) and 665 nm (XL665) using the PErkin-Elmer victor 2030 multilabel plate reader. Finally, the results were calculated as follows [23]: ratio=(OD665 nm/OD615 nm)×104.
siRNA transfection
A smart pool of double-stranded siRNA against EGFR and nonspecific siRNA (control siRNA) were obtained from Shanghai GenePharma Co., Ltd. A431 cells were seeded in a 6-well plate at a density of 5×10⁵ cells per well and transfected with the siRNA against EGFR at a final concentration of 120 nM using Lipofectamine 2000 reagent according to the manufacturer’s instructions for 24 hours. Transfection with a control siRNA construct was served as a negative control. Cells were subjected to western blot to detect protein expression. The transfected cells were seeded to perform proliferation assays.
RT-PCR and quantitative real-time PCR
Total RNA was extracted using the RNAfast 2000 kit according to the manufacturer’s protocol. The RT-PCR was performed using PrimeScript RT Master Mix Perfect Real Time kit. Real-time PCR was performed using SYBR® Premix Ex TaqTM II and a Thermal Cycle Dice Real time system. The result was analyzed using the manufacturer’s program (Thermal Cycler DiceTM Real Time System). The primer sequences were as following: GAPDH forward primer: 5’-GCACCGTCAAGGCTGAGAAC-3’, GAPDH reverse primer: 5’-TGGTGAAGACGCCAGTGGA-3’, EGFR forward primer: 5’-CGTGCCCTGATGGATGAAGAAGAC-3’, EGFR reverse primer: 5’-CGGTGGAATTGTTGCTGGTTGC-3’.
Melt curve analysis was performed at the end of each PCR to confirm the specificity of the PCR product. Threshold cycle (Ct) values of EGFR in each sample were normalized with the GAPDH expression. The ratio of EGFR versus the corresponding GAPDH of each sample was determined on the basis of the equation EGFR/GAPDH=2Ct(GAPDH)-Ct(EGFR).
Hoechst staining assay
A431 and HEK293/EGFR cells were treated with different concentrations of AECS in 6-well plates for 48 h. Cells were then incubated with Hoechst33258 stain for 10 min at 37°C according to the manufacturer’s instructions, and examined under fluorescence microscope [34].
Flow cytometric analysis of apoptosis
A431 and HEK293/EGFR cells were treated with different concentrations of AECS for 48 h. The cells were then collected, washed, and re-suspended in phosphate buffered saline (PBS). The apoptotic cell death rate was examined with Annexin V-FITC and PI double staining using the Annexin V-FITC apoptosis detection kit according to the manufacturer’s instructions. After staining the cells with Annexin V-FITC/PI, flow cytometric analysis was performed and data was analyzed using Cell Quest software (the number of cells analyzed was 1×10⁵).
Western blot analysis
Cells were harvested and lysed in RIPA lysis buffer supplemented with protease inhibitor cocktail tablets and phosphatase inhibitor cocktail tablets. The EGF (0.1 ng/mL) was added in the cell culture medium for 15 min before extracting proteins. The cell lysates were centrifuged at 12,000 g at 4°C for 10 min. An equivalent amount of protein was resolved by 10% SDS-PAGE and transferred to PVDF membranes. The membranes were blocked in Tris-buffer saline containing 0.05% Tween-20 (TBST) and 5% non-fat powdered milk for 2 h. The blot was following incubated with the blocking solution containing first antibody overnight at 4°C. After washing with TBST for 10 min three times, the blot was incubated with a second antibody. The blot was again washed three times with TBST before being exposed to the SuperSignal West Dura Extended Duration substrate. Band intensity was quantified by densitometric analyses using a densitometer.
Statistical analysis
All values were expressed as means ± standard error of means (SEM). Statistics was determined with ANOVA. Results were considered statistically significant if the P value was < 0.05.
Results
AECS suppresses cell growth of overexpressed EGFR
To assess the effects of AECS on cell growth, HEK293, HEK293/EGFR and A431 cells were treated with AECS at concentrations of 0, 0.02, 0.04, 0.08, 0.16, 0.31, 0.63, 1.25 mg/ml. AECS inhibited the growth of HEK293, HEK293/EGFR and A431 cells in a dose-dependent and time-independent manner (Figure 1A-C, respectively) using MTT assay. At the same time, we observed that the EGFR expression level of HEK293/EGFR and A431 cells was much more than that of HEK293 cells (Figure 1D). Furthermore, AECS was more effective in suppressing HEK293/EGFR and A431 cell growth than HEK293 cells (Figure 1E, 1F). The 50%-growth inhibitory concentrations (IC50) of AECS on A431, HEK293/EGFR and HEK293 cells were 0.26, 0.41 and 1.07 mg/ml, respectively.
Figure 1.
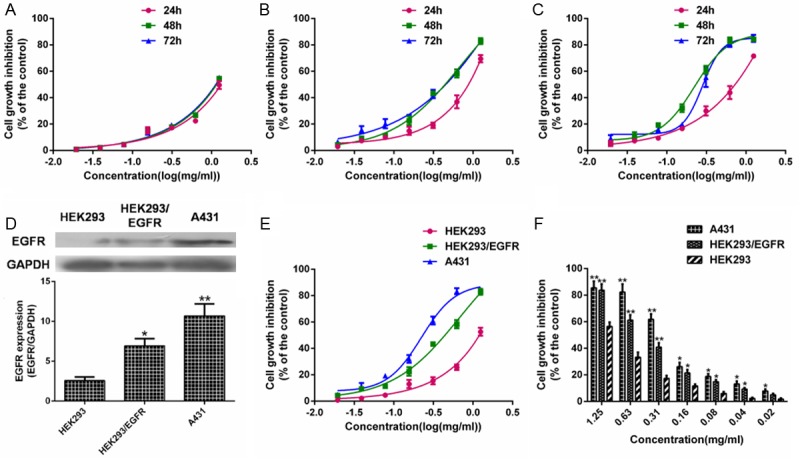
Effect of AECS on the cell growth of high-EGFR expression cells. Cells were treated with AECS at indicated concentration for 24, 48 and 72 h. Cell growth was measured by MTT. The values represent the average of three independent experiments. Data represents the means ± SEM from three repeated experiments. (A) HEK293 cells. (B) HEK293/EGFR cells. (C) A431 cells. (D) Expression levels of EGFR in HEK293, HEK293/EGFR and A431 cells without any treatment were examined by western blot assay, and the results were quantified by densitometry analysis of the bands and normalization to GAPDH. The values represent the average of three independent experiments. Data represents the means ± SEM (n=3). *p < 0.05, **p < 0.01 versus the EGFR expression in HEK293 cell. The samples derive from the same experiment and that blots were processed in parallel. Cells were treated with different concentrations of AECS. Cell growth was measured after 48 h by MTT (E) and trypan blue staining assay (F). Five wells were treated in each experiment. The values represent the average of three independent experiments. Values represent means ± SEM (n=3). *p < 0.05, **p < 0.01 versus the cell growth inhibition in HEK293 cells.
Affinity on the EGFR
The elution profiles of AECS and gefitinib on the HEK293/EGFR and A431 CMC column were shown in Figure 2A, 2B. The retention behavior indicated that AECS and gefitinib both could bind to EGFR.
Figure 2.
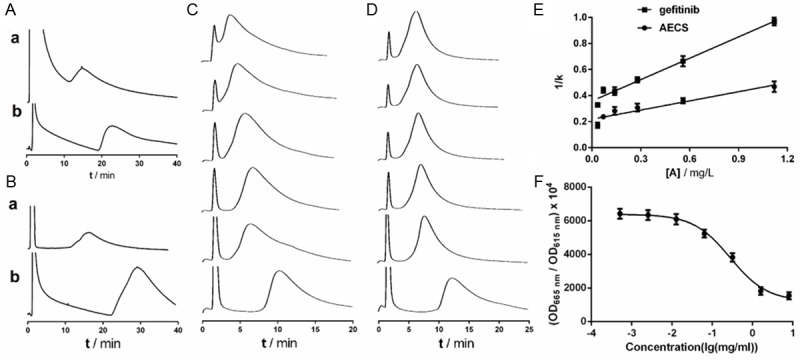
Effect of drugs on the EGFR. The CMC chromatograms of AECS (a) and gefitinib (b) on the HEK293/EGFR CMC column (A) and A431 CMC column (B). Elution profiles of gefitinib on the HEK293/EGFR CMC column with different concentrations of ligands (gefitinib (C) and AECS (D)) in the mobile phase and regression curves achieved by plotting 1/k versus [A] (E). The six concentrations were 0.035, 0.07, 0.14, 0.28, 0.56 and 1.12 mg/L (from bottom to top). Each point with a bar represents the mean ± SEM (n=5). The chromatographic conditions were as follows: CMC column 10 mm×2.0 mm; flow rate 0.2 mL/min; column temperature 37°C; mobile phase 2 mM phosphate-burred saline, pH 7.4. (F) Effect of AECS on the EGFR kinase activity. Initially, 4 μl variable concentrations of AECS (diluted in kinase buffer), 2 μl EGFR kinase, 2 μl substrate and 2 μl ATP were separately added to a 384-well plate and the reaction was allowed to proceed at 37°C for 30 min. The TK-Antibody (5 μl) labeled with Eu3+-cryptate and streptavidin-XL665 (5 μl) was then added with EDTA to the assay plate at room temperature for 1 h. Then the fluorescence was measured using the Perkin-Elmer victor 2030 multilabel plate reader. The results were calculated as follows: ratio=(OD665 nm/OD615 nm)×104. The values represent the average of three independent experiments. Values represent means ± SEM (n=3).
Competition studies were used to determine whether or not AECS shared an active binding site on the EGFR occupied by gefitinib, as gefitinib was a well-known EGFR inhibitor. Initial studies were performed by injecting a small amount of gefitinib onto the HEK293/EGFR CMC column, while continuously increasing the concentration of gefitinib in the mobile phase. A decrease in k values was observed Figure 2C. In addition, this method was employed in investigations of the displacement of AECS. A decrease in k values was observed Figure 2D. The corresponding graph of the reciprocal values of 1/k versus [A] is presented in Figure 2E according to Eqution 1. The fitting lines for gefitinib and AECS are y=0.5648x+0.3588 (r=0.9721) and y=0.2347x+0.2190 (r=0.8850), respectively. The equilibrium dissociation constants (KD) obtained from the model were 0.6562 mg/L for gefitinib and 0.9331 mg/L for AECS. The behavior suggested that AECS might have direct competition at the specific binding site of gefitinib.
Effect of AECS on EGFR kinase
The kinase assay was used to assess the effect of drugs on EGFR kinase activity. The optimized concentrations of reaction system used were as follows: EGFR kinase 1.88 nM, ATP 100 μΜ, substrate 1 μΜ and streptavidin-XL665 62.5 nM, respectively. AECS altered EGFR kinase activity in a dose-dependent manner (Figure 2F). The IC50 of AECS on EGFR kinase activity was 0.28 mg/ml.
Effects of EGFR in the biological effect induced by AECS
To further evaluate the effects of EGFR in the biological effect induced by AECS, A431, MCF-7, HCC827 and A549 cells were treated with AECS at concentrations of 0.02, 0.08, 0.31, 1.25 mg/ml (Figure 3A, 3B). The result showed that the effect of AECS in inhibiting A431 (EGFR overexpressed) cell growth was greater than that of MCF7 (expressed a little EGFR) cells. At the same time, AECS inhibited HCC827 (EGFR dependent) cell growth much greater than A549 (EGFR independent) cell growth. The EGFR mRNA and protein expressions were determined by RT-PCR and western blot analysis in EGFR-intact control A431 cells and EGFR depleted A431 cells. The Figure 3C, 3D indicated EGFR was selectively knocked down in A431 cells. To identify the impact of EGFR on the biological effect induced by AECS, EGFR-intact control A431 cells and EGFR depleted A431 cells were treated with AECS at different concentrations. The results showed that AECS inhibited the growth of both cells in a dose-dependent manner, but the inhibitory effect of EGFR-intact control A431 cells was more prominent than that of EGFR depleted A431 cells (Figure 3E). SiRNA knockdown of EGFR in A431 cells significantly attenuated the inhibitory effects of AECS on proliferation. The IC50 values of AECS in EGFR-intact control A431 cells and EGFR depleted A431 cells were 0.26 mg/ml and 0.45 mg/ml, respectively. At the same time, SiRNA knock down of EGFR could lead to increased apoptosis by comparing Figure 3G panel a with Figure 3F panel a. Combining AECS with siRNA enhanced the effect on apoptotic induction by comparing Figure 3G panel b with Figure 3F panel b. AECS more potently induced the apoptosis of EGFR-intact control A431 cells than the apoptosis of EGFR depleted A431 cells (Figure 3F c and d) following treatment with 0.16 and 0.32 mg/ml of AECS. Therefore, EGFR played a critical role in the biological effect induced by AECS and AECS might affect other targets different from the EGFR.
Figure 3.
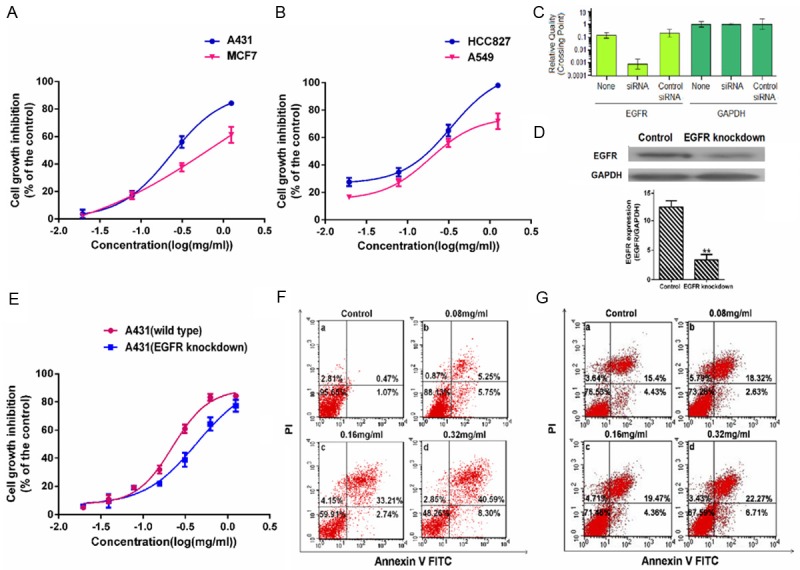
Effects of EGFR in the biological effect induced by AECS. (A) Effect of AECS on cell proliferation in A431 cells and MCF7 cells was determined by MTT assay. (B) Effect of AECS on cell proliferation in HCC827 cells and A549 cells was determined by MTT assay. The values represent the average of three independent experiments. Data represents the means ± SEM from three repeated experiments. Five wells were treated in each experiment. EGFR knockdown affected the AECS’s anti-proliferative and induce-apoptosis activity on A431 cells. EGFR mRNA expression (C) and protein expression (D) in A431 cells transfected with 120 nM EGFR siRNA using Lipofectamine 2000 reagent and EGFR-intact control A431 cells were determined by RT-PCR analysis and western blot assay. Transfection with a control siRNA construct served as a negative control. The values represent the average of three independent experiments. Data represents the means ± SEM (n=3). *p < 0.05, **p < 0.01 versus the EGFR expression in EGFR-intact control A431 cells. The samples derive from the same experiment and that blots were processed in parallel. (E) Effects of AECS on cell proliferation in EGFR-intact control A431 cells and EGFR depleted A431 cells were determined by MTT assay. After treated with EGFR siRNA for 24 hours, cells were treated with AECS for 48 hours. The values represent the average of three independent experiments. Data represents the means ± SEM from three repeated experiments. Five wells were treated in each experiment. The proportion of apoptotic cells was determined by double-staining with Annexin-V/FITC and PI after treatment with different concentrations of AECS in EGFR-intact control A431 cells than (F) and in EGFR depleted A431 cells (G). The flow cytometry profile represents Annexin V-FITC staining in x axis and PI in y axis. The number represents the percentages of cells to each of the four quadrants (viable cells for lower left quadrant, necrotic or dead cells in the higher left quadrant, early apoptotic cells in the lower right quadrant and late apoptotic cells in the higher right quadrant). The values represent the average of three independent experiments. Data represents the means ± SEM (n=3).
Effects of AECS on apoptosis
To detect apoptotic changes induced by AECS, A431 and HEK293/EGFR cells were incubated with Hoechst 33258 dye, which was commonly used to stain genomic DNA. Hoechst staining of A431 cells (Figure 4A) and HEK293/EGFR cells (Figure 4B) showed that AECS treatment induced apoptotic events characteristic of chromatin condensation. Microscopic observation in Figure 4A, 4B demonstrated typical morphology of apoptotic nuclei stained with Hoechst, in which chromatin was condensed and aggregated at the nuclear membrane as indicated by a bright fluorescence at the periphery.
Figure 4.
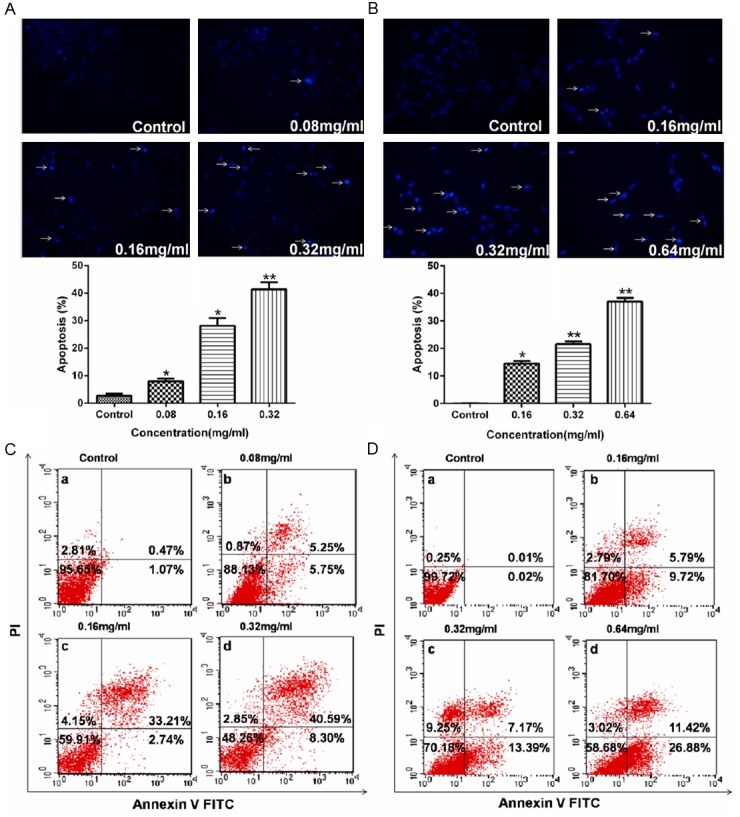
AECS induces apoptosis of high-EGFR expression cells. AECS-induced apoptosis in A431 cells (A) and in HEK293/EGFR cells (B), as shown by arrows, were characterized by nuclear condensation or nuclear fragmentation after Hoechst staining (original magnification×200). The proportion of apoptotic cells was determined by double-staining with Annexin-V/FITC and PI after treatment with different concentrations of AECS in A431 cells (C) and in HEK293/EGFR cells (D). The flow cytometry profile represents Annexin V-FITC staining in x axis and PI in y axis. The number represents the percentages of cells to each of the four quadrants (viable cells for lower left quadrant, necrotic or dead cells in the higher left quadrant, early apoptotic cells in the lower right quadrant and late apoptotic cells in the higher right quadrant). The values represent the average of three independent experiments. Data represents the means ± SEM (n=3). *p < 0.05, **p < 0.01 versus the control.
To confirm the effect of AECS on cell apoptosis, treated cells were stained with annexin V-FITC and PI and analyzed by flow cytometry. As shown in Figure 4C, 4D, A431 cells and HEK293/EGFR cells treated with AECS both demonstrated significantly increased early- and late-stage apoptotic fraction in a dose-dependent manner. The percentage of apoptotic cells was 1.54%, 11.00%, 35.95% and 48.89% on A431 cells following treatment with 0, 0.08, 0.16 and 0.32 mg/ml of AECS for 48 h, respectively. The percentage of apoptotic cells was 0.03%, 15.51%, 20.56% and 38.30% on HEK293/EGFR cells following treatment with 0, 0.16, 0.32 and 0.64 mg/ml of AECS for 48 h, respectively.
Effects of AECS on related apoptosis protein
The expressions of Bim, Bcl-2, Bax and Bad proteins in A431 and HEK293/EGFR cells treated with increasing concentrations of AECS for 48 h were investigated by western blot analysis. Treatment with AECS clearly decreased Bcl-2 expression and increased BimEL, Bax and Bad expression in a dose-dependent manner in A431 cells (Figure 5A) and HEK293/EGFR cells (Figure 5B).
Figure 5.
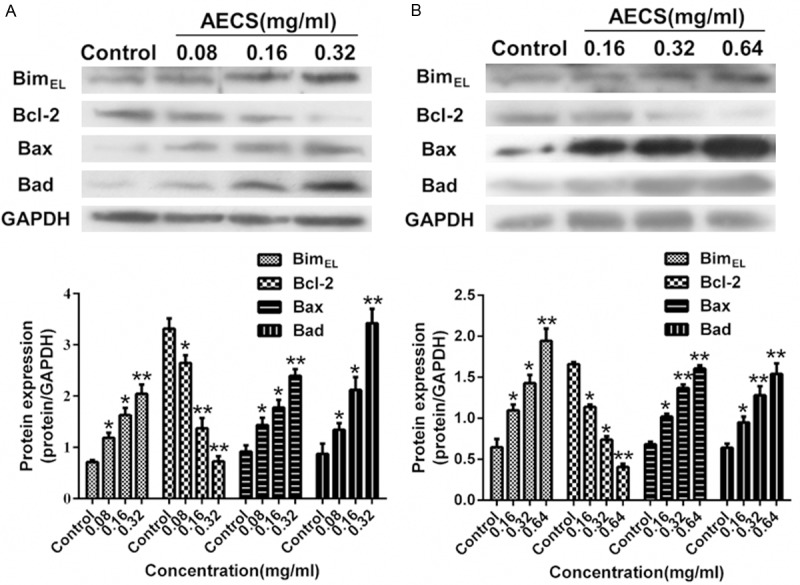
Effects of AECS on BimEL, Bcl-2, Bax and Bad expressions in high-EGFR expression cells. A. Expression levels of BimEL, Bcl-2, Bax and Bad in A431 cells treated with AECS (0, 0.08, 0.16 and 0.32 mg/ml) for 48 h were examined by western blot assay, and the results were quantified by densitometry analysis of the bands and normalization to GAPDH. The values represent the average of three independent experiments. The samples derive from the same experiment and that blots were processed in parallel. B. Expression levels of BimEL, Bcl-2, Bax and Bad in HEK293/EGFR cells treated with and AECS (0, 0.16, 0.32 and 0.64 mg/ml) for 48 h were examined by western blot assay, and the results were quantified by densitometry analysis of the bands and normalization to GAPDH. The values represent the average of three independent experiments. The samples derive from the same experiment and that blots were processed in parallel. Data represents the means ± SEM. *p < 0.05, **p < 0.01 versus the control.
Effects of AECS on molecular of EGFR signaling pathway
To further identify the effect of AECS on EGFR and its downstream signaling pathways that might contribute to growth inhibition, the present study examined the phosphorylation of several key regulators by western blot analysis. Treatment of AECS significantly decreased EGFR phosphorylation and its downstream signaling members (AKT and Erk1/2) phosphorylation in A431 cells (Figure 6A), HEK293/EGFR cells (Figure 6B) and HCC827 cells (Figure 6C). These results showed that the phosphorylation of EGFR and its downstream signaling proteins could be down regulated by AECS in a dose-dependent manner.
Figure 6.
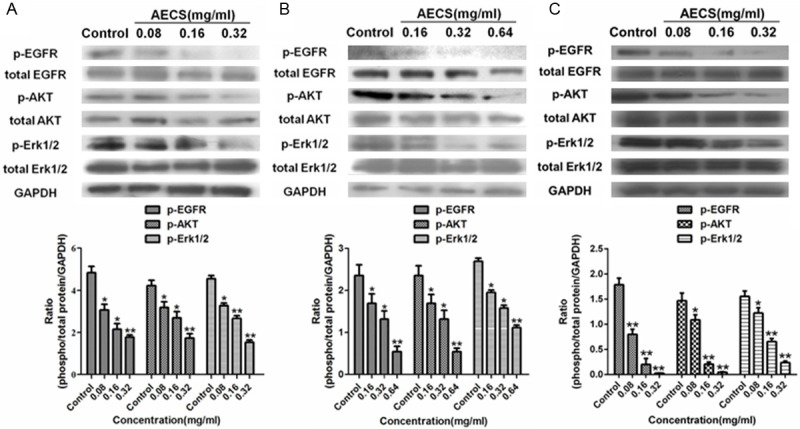
The inhibitory action of AECS on EGFR and its downstream signaling members. A. The phosphorylation of EGFR, AKT and Erk1/2 in cell lysates of A431 cells treated with AECS for 48 h under serum starvation conditions was determined by western blot, and the results were quantified by densitometry analysis. The values represent the average of three independent experiments. The samples derive from the same experiment and that blots were processed in parallel. B. The phosphorylation of EGFR, AKT and Erk1/2 in cell lysates of HEK293/EGFR cells treated with AECS for 48 h under serum starvation conditions was determined by western blot, and the results were quantified by densitometry analysis. The values represent the average of three independent experiments. The samples derive from the same experiment and that blots were processed in parallel. C. The phosphorylation of EGFR, AKT and Erk1/2 in cell lysates of HCC827 cells treated with AECS for 48 h under serum starvation conditions was determined by western blot, and the results were quantified by densitometry analysis. The values represent the average of three independent experiments. The samples derive from the same experiment and that blots were processed in parallel. Data represents the means ± SEM. *p < 0.05, **p < 0.01 versus the control.
Discussion
In this study, the authors demonstrated, for the first time, that AECS played a remarkable role in inhibiting proliferation via inducing apoptosis and regulation of EGFR signaling pathway. The effect of AECS on high-EGFR expression cells (A431 and HEK293/EGFR) and HEK293 cell growth was evaluated (Figure 1). The results showed that AECS exhibited significant inhibition of HEK293, HEK293/EGFR and A431 cell growth in a dose-dependent manner (Figure 1A-C, respectively). Furthermore, the inhibitory effect of AECS was more prominent when treating cells highly expressing EGFR (A431 and HEK293/EGFR cells versus HEK293 cells) (Figure 1E, 1F).
The elution profiles of AECS and gefitinib on the HEK293/EGFR and A431 CMC column indicated that AECS and gefitinib both could bind to EGFR (Figure 2A, 2B). Also, competition studies were utilized to determine whether or not AECS shared an active binding site on the EGFR occupied by gefitinib (Figure 2C-E). These experiments indicated that AECS and gefitinib may have direct competition at a single common binding site on EGFR. In addition, Figure 2F showed that AECS could alter EGFR kinase activity. These results demonstrated that EGFR might be a target of AECS.
Otherwise, the effect of AECS in inhibiting A431 (EGFR overexpressed) and HCC827 (EGFR dependent) cell growth was greater than that of MCF7 and A549 (EGFR independent) cells (Figure 3A, 3B), indicating that EGFR might be a target of AECS. To further validate this, siRNA knockdown of EGFR in A431 cells significantly attenuated AECS inhibitory effects (Figure 3). The AECS treatment promoted more cell death in EGFR-intact control A431 cells than in EGFR depleted A431 cells (Figure 3E), which indicating EGFR is a target of AECS. SiRNA knock down of EGFR could lead to increased apoptosis by comparing Figure 3F panel a with Figure 3G panel a. Combining AECS with siRNA enhanced the effect on apoptotic induction by comparing Figure 3F panel b with Figure 3G panel b. This also suggested that EGFR might be a target for AECS. When the concentration of AECS came to 0.16 and 0.32 mg/ml, the apoptosis induced by AECS was significantly diminished in A431-siEGFR when compared with control A431 cells but a significant effect continued being observed (Figure 3F c and d). The results would be the combined effect of AECS and siRNA knockdown of EGFR. This suggested that AECS might be affecting other targets different from the EGFR [35]. At the same time, AECS also exhibited a good apoptosis-inducing effect.
Inducing apoptosis contributes to cancer treatment by several mechanisms, including preventing growth-factor-independent cell survival, inhibiting resistance to immune-based cytotoxicity, and interfering with bypassing of cell-cycle checkpoints [7]. Thus the flow cytometric and Hoechst 33258 staining assays were used to observe the apoptotic effects of AECS on A431 and HEK293/EGFR cells. It was shown that AECS induced apoptotic events characteristic of chromatin condensation and significantly increased apoptotic fraction on both cells (Figure 4). To gain further insights into the mechanism of AECS-induced cell apoptosis, effects of AECS on protein levels of Bcl-2 family were determined. Members of the Bcl-2 family play an important role in the regulation of cell survival/apoptosis by either serving as anti-apoptotic or pro-apoptotic proteins. The balance between these two classes of proteins is critical for determining whether a cell undergoes apoptosis or not [34]. Erk1/2 phosphorylates BimEL, resulting in rapid degradation of the isoform via the proteasome pathway. At least three sites for Erk1/2 phosphorylation exist on BimEL, whereas Erk1/2 does not affect BimL or BimS, implying a unique role for BimEL in cell survival signaling [36,37]. Inhibition of EGFR tyrosine kinase activity using drugs such as gefitinib results in BimEL accumulation and, consequently, induction of apoptosis [37]. Hence, we detected the Bim, Bcl-2, Bax and Bad protein expression on A431 and HEK293/EGFR cells, which showed that AECS induced upregulation of BimEL, Bax and Bad expression, correlating with the downregulation of Bcl-2 expression (Figure 5). The results showed that inducing apoptotic effect of AECS was tightly associated with the effects on Bcl-2 family. It demonstrated the induction of apoptosis by AECS contributed to the inhibition of cell growth.
EGFR is commonly overexpressed in epithelial tumors and closely related to tumorigenesis and development of various cancers [38-40]. As EGFR signaling pathway was involved in apoptosis and proliferation of cancer cells, the effect of AECS on EGFR pathway was detected. Ligands binding to the EGFR can activate signal transduction, which in turn, modulates the development of cancer and increases tumor cell proliferation [41-44]. As EGFR shares a highly conserved cytoplasmic tyrosine kinase domain, autophosphorylation of specific cyto-plasmic tyrosine residues establishes binding sites for SH2 and phosphotyrosine binding domain-containing proteins, that in turn link to downstream effectors involved in cell proliferation (MAPK; also known as Erk1/2) and survival (PI3K/AKT) pathways. Most mitogenic signals transduced through growth factor receptor activation ultimately converge on a common downstream effector, Erk1/2, which serves as a transcription factor regulating tumor cell proliferation and survival [45,46]. The PI3K/AKT pathway is involved in protecting cells from apoptosis. In many tumors, strategies designed to inhibit AKT activation could work by inducing tumor cell apoptosis internally, or by sensitizing tumors to the cytotoxic effects of concurrent chemotherapy [47,48]. To examine the effects of AECS on the EGFR and its signaling members Erk1/2 and AKT, the phosphorylation of the EGFR signaling members was examined. The obtained results showed that AECS could reduce phosphorylation of EGFR and downstream signaling players AKT and Erk1/2 activation in A431 and HEK293/EGFR cells (Figure 6A, 6B), suggesting that AECS down regulated the EGFR/MAPK and EGFR/ PI3K/AKT pathways. In order to show that AECS could act on EGFR, well-characterized EGFR-addicted NSCLC cell line (EGFR-mutated HCC827 cells) was used. In the cell line, mutant EGFR is overexpressed and the PI3K and MAPK signaling is under complete control of EGFR. The obtained results showed that AECS could also reduce phosphorylation of EGFR and downstream signaling players AKT and Erk1/2 activation in HCC827 cells (Figure 6C). Thus, these together confirmed that AECS could inhibit high-EGFR expression cell growth by modulating the EGFR signaling pathway.
In summary, the study demonstrates that AECS can decrease EGFR phosphorylation and lead to the down-regulation of the MAPK pathway and the PI3K/AKT pathway activity. At the same time, AECS induces high-EGFR expression cell apoptosis by decreasing Bcl-2 and increasing BimEL, Bax and Bad expressions. All of them contribute to the inhibition by AECS on high-EGFR expression cell growth. The authors have provided positive data for the efficacy of AECS as a potential strategy against high-EGFR expression cancers.
Acknowledgements
This work was supported by National Natural Science Foundation of China (Grant 81370088, 81227802 and 21305106), the Fundamental Research Funds for the Central Universities, the project of shaanxi star of science and technology (2012KJXX-06), and supporting plan of education ministry’s new century excellent talents (NCET-13-0467).
Disclosure of conflict of interest
The authors declare no conflict of interest.
References
- 1.Moon SS, Cho N, Shin J, Seo Y, Lee CO, Choi SU. Jineol, a Cytotoxic Alkaloid from the Centipede Scolopendra subspinipes. J Nat Prod. 1996;59:777–779. http://www.plosone.org/article/findcited/6597569. [Google Scholar]
- 2.Undheim EAB, King GF. On the venom system of centipedes (Chilopoda), a neglected group of venomous animals. Toxicon. 2011;57:512–524. doi: 10.1016/j.toxicon.2011.01.004. [DOI] [PubMed] [Google Scholar]
- 3.Gomes A, Datta A, Sarangi B, Kar PK, Lahiri SC. Isolation, purification & pharmacodynamics of a toxin from the venom of the centipede Scolopendra subspinipes dehaani Brandt. Indian J Exp Biol. 1983;21:203–207. http://www.plosone.org/article/findcited/6597569. [PubMed] [Google Scholar]
- 4.Liu ZC, Zhang R, Zhao F, Chen ZM, Liu HW, Wang YJ, Jiang P, Zhang Y, Wu Y, Ding JP, Lee WH, Zhang Y. Venomic and Transcriptomic Analysis of Centipede Scolopendra subspinipes dehaani. J Proteome Res. 2012;11:6197–212. doi: 10.1021/pr300881d. [DOI] [PubMed] [Google Scholar]
- 5.Bhagirath T, Chingtham B, Mohen Y. Venom of a hill centipede Scolopendra viridicornis inhibits growth of human breast tumor in mice. Indian J Pharmacol. 2006;38:291–292. [Google Scholar]
- 6.Zhou QM, Wang XF, Liu XJ, Zhang H, Lu YY, Huang S, Su SB. Curcumin improves MMC-based chemotherapy by simultaneously sensitising cancer cells to MMC and reducing MMC-associated side-effects. Eur J Cancer. 2011;47:2240–2247. doi: 10.1016/j.ejca.2011.04.032. [DOI] [PubMed] [Google Scholar]
- 7.Tamm I, Schriever F, Dorken B. Apoptosis: implications of basic research for clinical oncology. Lancet Oncol. 2001;2:33–42. doi: 10.1016/S1470-2045(00)00193-5. [DOI] [PubMed] [Google Scholar]
- 8.Li J, Li Y, Feng ZQ, Chen XG. Anti-tumor activity of a novel EGFR tyrosine kinase inhibitor against human NSCLC in vitro and in vivo. Cancer Lett. 2009;279:213–220. doi: 10.1016/j.canlet.2009.01.042. [DOI] [PubMed] [Google Scholar]
- 9.Nicholson RI, Gee JM, Harper ME. EGFR and cancer prognosis. Eur J Cancer. 2001;37:S9–S15. doi: 10.1016/s0959-8049(01)00231-3. http://www.plosone.org/article/findcited/6597569. [DOI] [PubMed] [Google Scholar]
- 10.Miettinen PJ, Berger JE, Meneses J, Phung Y, Pedersen RA, Werb Z, Derynck R. Epithelial immaturity and multiorgan failure in mice lacking epidermal growth factor receptor. Nature. 1995;376:337–41. doi: 10.1038/376337a0. [DOI] [PubMed] [Google Scholar]
- 11.Wells A. EGF receptor. Int J Biochem Cell B. 1999;31:637–643. doi: 10.1016/s1357-2725(99)00015-1. http://www.plosone.org/article/findcited/6597569. [DOI] [PubMed] [Google Scholar]
- 12.McCune BK, Earp HS. The Epidermal1 Growth Factor Receptor Tyrosine Kinase in Liver Epithelial Cells. J Biol Chem. 1989;264:15501–7. [PubMed] [Google Scholar]
- 13.Zhan YZ, Zhang YM, Liu CC, Zhang J, Smith WW, Wang N, Chen YN, Zheng L, He LC. A novel taspine derivative, HMQ1611 inhibits breast cancer cell growth via ERα and EGFR signaling pathways. Cancer Prev Res. 2012;5:864–873. doi: 10.1158/1940-6207.CAPR-11-0575. [DOI] [PubMed] [Google Scholar]
- 14.Yarden Y, Sliwkowski MX. Untangling the ErbB signalling network. Nat Rev Mol Cell Bio. 2001;2:127–37. doi: 10.1038/35052073. [DOI] [PubMed] [Google Scholar]
- 15.Magkou C, Nakopoulou L, Zoubouli C, Karali K, Theohari I, Bakarakos P, Giannopoulou I. Expression of the epidermal growth factor receptor (EGFR) and the phosphorylated EGFR in invasive breast carcinomas. Breast Cancer Res. 2008;10:R49. doi: 10.1186/bcr2103. [DOI] [PMC free article] [PubMed] [Google Scholar]
- 16.Boudewijn MT, Burgering PJC. Protein kinase B (c-AKT) in phosphatidylinositol-3-OH kinase signal transduction. Nature. 1995;376:599–602. doi: 10.1038/376599a0. [DOI] [PubMed] [Google Scholar]
- 17.He XP, Ashwani K, Debarshi R, Kaufmann S, Shridhar V. Loss of HSulf-1 Expression Enhances Tumorigenicity by Inhibiting Bim Expression in Ovarian Cancer. Int J Cancer. 2014;135:1783–1789. doi: 10.1002/ijc.28818. [DOI] [PMC free article] [PubMed] [Google Scholar]
- 18.Gunda V, Bucur O, Varnau J, Vanden Borre P, Bernasconi MJ, Khosravi-Far R, Parangi S. Blocks to thyroid cancer cell apoptosis can be overcome by inhibition of the MAPK and PI3K/AKT pathways. Cell Death Dis. 2014;5:e1104. doi: 10.1038/cddis.2014.78. [DOI] [PMC free article] [PubMed] [Google Scholar]
- 19.Senthilkumar K, Kim SK. Cell Survival and Apoptosis Signaling as Therapeutic Target for Cancer: Marine Bioactive Compounds. Int J Mol Sci. 2013;14:2334–2354. doi: 10.3390/ijms14022334. [DOI] [PMC free article] [PubMed] [Google Scholar]
- 20.Huang SM, Harari PM. Epidermal growth factor receptor inhibition in cancer therapy: biology, rationale and preliminary clinical results. Invest New Drugs. 1999;17:259–269. doi: 10.1023/a:1006384521198. [DOI] [PubMed] [Google Scholar]
- 21.Merlino GT, Xu YH, Ishii S, Clark AJ, Semba K, Toyoshima K, Yamamoto T, Pastan I. Amplification and enhanced expression of the epidermal growth factor receptor gene in A431 human carcinoma cells. Science. 1984;224:417–419. doi: 10.1126/science.6200934. [DOI] [PubMed] [Google Scholar]
- 22.Hunter T, Cooper JA. Epidermal growth factor induces rapid tyrosine phosphorylation of proteins in A431 human tumor cells. Cell. 1981;24:741–752. doi: 10.1016/0092-8674(81)90100-8. [DOI] [PubMed] [Google Scholar]
- 23.Wu B, Zheng JF, Yu ZD, Jiang ZM, Ma G. Inhibitory effects of siRNA on expression of epidermal grow th factor receptor in squamous cell carcinoma cell line A431. J Fourth Mil Med Univ. 2009;30:1064–1067. [Google Scholar]
- 24.Faber AC, Li D, Song Y, Liang MC, Yeap BY, Bronson RT, Lifshits E, Chen Z, Maira SM, García-Echeverría C, Wong KK, Engelman JA. Differential induction of apoptosis in HER2 and EGFR addicted cancers following PI3K inhibition. Proc Natl Acad Sci. 2009;106:19503–8. doi: 10.1073/pnas.0905056106. [DOI] [PMC free article] [PubMed] [Google Scholar]
- 25.Maegawa M, Arao T, Yokote H, Matsumoto K, Kudo K, Tanaka K, Kaneda H, Fujita Y, Ito F, Nishio K. EGFR Mutation Up-regulates EGR1 Expression through the ERK Pathway. Anticancer Res. 2009;29:1111–1118. [PubMed] [Google Scholar]
- 26.Arao T, Fukumoto H, Takeda M, Tamura T, Saijo N, Nishio K. Small In-Frame Deletion in the Epidermal Growth Factor Receptor as a Target for ZD6474. Cancer Res. 2004;64:9101–9104. doi: 10.1158/0008-5472.CAN-04-2360. [DOI] [PubMed] [Google Scholar]
- 27.Maegawa M, Arao T, Yokote H, Matsumoto K, Kudo K, Tanaka K, Kaneda H, Fujita Y, Ito F, Nishio K. Epidermal growth factor receptor lacking C-terminal autophosphorylation sites retains signal transduction and high sensitivity to epidermal growth factor receptor tyrosine kinase inhibitor. Cancer Sci. 2009;100:552–7. doi: 10.1111/j.1349-7006.2008.01071.x. [DOI] [PMC free article] [PubMed] [Google Scholar]
- 28.Zhang YM, Li X, Xu XM, Luo WJ. Construction of a high-EGFR expression cell line and its biological properties comparing with A431 cell. Afr J Biotechnol. 2010;9:4674–4680. [Google Scholar]
- 29.Liu XP, Zhong DW. Study on the mechanisms of tumor inhibitory effect of centipede extraction on heterotopic grafting hepatocellular carcinoma in nude mice. Chin J General Surg. 2010;19:164–168. [Google Scholar]
- 30.Zhou YL, Luo WJ, Zhang YM. Construction of recombinant FGFR1 containing full-length gene and its potential application. Plasmid. 2010;64:60–67. doi: 10.1016/j.plasmid.2010.04.004. [DOI] [PubMed] [Google Scholar]
- 31.Wang L, Ren J, Sun M, Wang SC. A combined cell membrane chromatography and online HPLC/MS method for screening compounds from Radix Caulophylli acting on the human alpha(1A)-adrenoceptor. J Pharm Biomed Anal. 2010;51:1032–1036. doi: 10.1016/j.jpba.2009.11.007. [DOI] [PubMed] [Google Scholar]
- 32.Anguizola J, Joseph KS, Barnaby OS, Matsuda R, Alvarado G, Clarke W, Cerny RL, Hage DS. Development of affinity microcolumns for drug-protein binding studies in personalized medicine: interactions of sulfonylurea drugs with in vivo glycated human serum albumin. Anal Chem. 2013;85:4453–4460. doi: 10.1021/ac303734c. [DOI] [PMC free article] [PubMed] [Google Scholar]
- 33.Matsuda R, Anguizola J, Joseph KS, Hage DS. Analysis of drug interactions with modified proteins by high-performance affinity chromatography: binding of glibenclamide to normal and glycated human serum albumin. J Chromatogr A. 2012;1265:114–122. doi: 10.1016/j.chroma.2012.09.091. [DOI] [PMC free article] [PubMed] [Google Scholar]
- 34.Rasul A, Ding C, Li X, Khan M, Yi F, Ali M, Ma T. Dracorhodin perchlorate inhibits PI3K/AKT and NF-jB activation, up-regulates the expression of p53, and enhances apoptosis. Apoptosis. 2012;17:1104–1119. doi: 10.1007/s10495-012-0742-1. [DOI] [PubMed] [Google Scholar]
- 35.Caja L, Sancho P, Bertran E, Ortiz C, Campbell JS, Fausto N, Fabregat I. The tyrphostin AG1478 inhibits proliferation and induces death of liver tumor cells through EGF receptor- dependent and independent mechanisms. Biochem Pharmacol. 2011;82:1583–1592. doi: 10.1016/j.bcp.2011.08.011. [DOI] [PubMed] [Google Scholar]
- 36.Wiggins CM, Band H, Cook SJ. c-Cbl is not required for ERK1/2-dependent degradation of BimEL. Cell Signal. 2007;19:2605–2611. doi: 10.1016/j.cellsig.2007.08.008. [DOI] [PMC free article] [PubMed] [Google Scholar]
- 37.Dehan E, Bassermann F, Guardavaccaro D, Vasiliver-Shamis G, Cohen M, Lowes KN, Dustin M, Huang DC, Taunton J, Pagano M. βTrCP- and Rsk1/2-mediated degradation of BimEL inhibits apoptosis. Mol Cell. 2009;33:109–116. doi: 10.1016/j.molcel.2008.12.020. [DOI] [PMC free article] [PubMed] [Google Scholar]
- 38.Zhang YM, Zheng L, Zhang J, Dai BL, Wang N, Chen YN, He LC. Anti-tumor activity of taspine by modulating EGFR signaling pathway of Erk1/2 and AKT in vitro and in vivo. Planta Med. 2011;77:1774–1781. doi: 10.1055/s-0030-1271132. [DOI] [PubMed] [Google Scholar]
- 39.Rikimaru K, Tadokoro K, Yamamoto T, Enomoto S, Tsuchida N. Gene amplification and overexpression of epidernal growth factor receptor in squamous cell carcinoma of the head and neck. Head Neck. 1992;14:8–13. doi: 10.1002/hed.2880140103. http://www.plosone.org/article/findcited/6597569. [DOI] [PubMed] [Google Scholar]
- 40.Sargent ER, Gomella LG, Belldegrun A, Linehan WM, Kasid A. Epidermal growth factor receptor gene expression in normal human kidney and renal cell carcinoma. J Urol. 1989;142:1364–1368. doi: 10.1016/s0022-5347(17)39100-0. http://www.plosone.org/article/findcited/6597569. [DOI] [PubMed] [Google Scholar]
- 41.Salomon DS, Brandt R, Ciardiello F, Normanno N. Epidermal growth factor-related peptides and their receptors in human malignancies. Cri Rev Oncol Hematol. 1995;19:183–232. doi: 10.1016/1040-8428(94)00144-i. http://www.plosone.org/article/findcited/6597569. [DOI] [PubMed] [Google Scholar]
- 42.Ishikawa J, Maeda S, Umezu K, Sugiyama T, Kamidono S. Amplification and overexpression of the epidermal growth factor receptor gene in human renal-cell carcinoma. Int J Cancer. 1990;45:1018–1021. doi: 10.1002/ijc.2910450606. [DOI] [PubMed] [Google Scholar]
- 43.Kim JW, Kim YT, Kim DK, Song CH, Lee JW. Expression of epidermal growth factor receptor in carcinoma of the cervix. Gynecol Oncol. 1996;60:283–287. doi: 10.1006/gyno.1996.0039. [DOI] [PubMed] [Google Scholar]
- 44.Bast RC Jr, Boyer CM, Jacobs I, Xu FJ, Wu S, Wiener J, Kohler M, Berchuck A. Cell growth regulation in epithelial ovarian cancer. Cancer. 1993;71:1597–1601. doi: 10.1002/cncr.2820710426. [DOI] [PubMed] [Google Scholar]
- 45.Egan SE, Weinberg RA. The pathway to signal achievement. Nature. 1993;365:781–783. doi: 10.1038/365781a0. [DOI] [PubMed] [Google Scholar]
- 46.Pulverer BJ, Kyriakis JM, Avruch J, Nikolakaki E, Woodgett JR. Phosphorylation of c-jun mediated by MAP kinases. Nature. 1991;363:83–85. doi: 10.1038/353670a0. [DOI] [PubMed] [Google Scholar]
- 47.Xia W, Mullin RJ, Keith BR, Liu LH, Ma H, Rusnak DW, Owens G, Alligood KJ, Spector NL. Anti-tumor activity of GW572016: a dual tyrosine kinase inhibitor blocks EGF activation of EGFR/erbB2 and downstream Erk1/2 and AKT pathways. Oncogene. 2002;21:6255–6263. doi: 10.1038/sj.onc.1205794. [DOI] [PubMed] [Google Scholar]
- 48.Zhang YM, Dai BL, Zheng L, Zhan YZ, Zhang J, Smith WW, Wang XL, Chen YN, He LC. A novel angiogenesis inhibitor impairs lovo cell survival via targeting against human VEGFR and its signaling pathway of phosphorylation. Cell Death Dis. 2012;3:e406. doi: 10.1038/cddis.2012.145. [DOI] [PMC free article] [PubMed] [Google Scholar]