

Abstract
Mitochondrial membrane potential (ΔΨm) depolarization has been implicated in the loss of excitability (asystole) during global ischemia, which is relevant for the success of defibrillation and resuscitation after cardiac arrest. However, the relationship between ΔΨm depolarization and asystole during no-flow ischemia remains unknown. We applied spatial Fourier analysis to confocally recorded fluorescence emitted by ΔΨm-sensitive dye tetramethylrhodamine methyl ester. The time of ischemic ΔΨm depolarization (tmito_depol) was defined as the time of 50% decrease in the magnitude of spectral peaks reflecting ΔΨm. The time of asystole (tasys) was determined as the time when spontaneous and induced ventricular activity ceased to exist. Interventions included tachypacing (150 ms), myosin II ATPase inhibitor blebbistatin (heart immobilizer), and the combination of blebbistatin and the inhibitor of glycolysis iodoacetate. In the absence of blebbistatin, confocal images were obtained during brief perfusion with hyperkalemic solution and after the contraction failed between 7 and 15 min of ischemia. In control, tmito_depol and tasys were 24.4 ± 6.0 and 26.0 ± 5.0 min, respectively. Tachypacing did not significantly affect either parameter. Blebbistatin dramatically delayed tmito_depol and tasys (51.4 ± 8.6 and 45.7 ± 5.3 min, respectively; both P < 0.0001 vs. control). Iodoacetate combined with blebbistatin accelerated both events (tmito_depol, 12.7 ± 1.8 min; and tasys, 6.5 ± 1.1 min; both P < 0.03 vs. control). In all groups pooled together, tasys was strongly correlated with tmito_depol (R2 = 0.845; P < 0.0001). These data may indicate a causal relationship between ΔΨm depolarization and asystole or a similar dependence of the two events on energy depletion during ischemia. Our results urge caution against the use of blebbistatin in studies addressing pathophysiology of myocardial ischemia.
Keywords: myocardial ischemia, mitochondrial depolarization, ATP-sensitive potassium channel, asystole, blebbistatin
collapse of mitochondrial inner membrane potential (ΔΨm) is a major adverse event in the course of global myocardial ischemia and/or reperfusion (I/R). It has been implicated in loss of excitability during ischemia and subsequent postreperfusion ventricular fibrillation (VF) (2), and in the development of proarrhythmic action potential alternans during ischemia (25). Despite the obvious importance of ΔΨm loss for the outcomes of an ischemic insult, the timing and the determinants of this event are still poorly understood. One reason for that is the difficulty of monitoring ΔΨm in realistic, whole heart models of ischemia. We addressed these issues in our previous publication (29) and developed a new method for detection of ΔΨm collapse in globally ischemic hearts based on spectral analysis of confocally derived fluorescence emitted by mitochondrial probe tetramethylrhodamine perchlorate methyl ester (29). In that study we provided evidence that a subcellular resolution afforded by confocal or multiphoton microscopy is necessary to detect ΔΨm collapse during no-flow ischemia. This, however, necessitates complete immobilization of the heart, because otherwise the scanned microscopic images are distorted, preventing recognition of subcellular features. The recently discovered myosin-II inhibitor blebbistatin (8) has been routinely used in both wide-field and confocal heart imaging studies addressing the pathophysiology of myocardial I/R (6, 24). However, these studies typically lacked appropriate controls for the possible modulating effects of blebbistatin with regard to the studied phenomena.
The original purpose of this study was to provide experimental validation of the previously postulated cause-effect relationship between ΔΨm collapse and electrical failure during ischemia (2). We reasoned that a strong correlation between the timing of ΔΨm depolarization (tmito_depol) and the timing of asystole (tasys) during global ischemia in whole hearts would provide strong support, even though not complete proof, of the postulated causal relationship. The lack of such correlation would clearly refute it. We also hypothesized that high excitation rate, a condition relevant to VF-induced cardiac arrest, might affect tasys, tmito_depol, or both during ischemia. The difficult, but crucially important, part of the experimental design was to estimate the confounding effects of blebbistatin, which is required to perform confocal experiments in contracting hearts. For that purpose we transiently immobilized hearts with high-potassium Tyrode solution for obtaining baseline (preischemic) images and performed confocal imaging during ischemia only after the hearts experienced ischemic contraction failure.
The experiments in blebbistatin-free hearts revealed, quite unexpectedly, that blebbistatin dramatically (by ∼100%) and proportionally increased both tmito_depol and tasys, whereas rapid pacing had minimal effects on these parameters. The effects of blebbistatin were fully abolished by the inhibitor of glycolysis iodoacetate, suggesting energy preservation as the underlying mechanism. Importantly, even in the absence of blebbistatin, a significant ΔΨm depolarization occurred relatively late (at ∼25 min of ischemia), which is much later than it was previously thought (14) and suggests that ΔΨm has little or no role in early ischemic events, such as contraction failure, action potential shortening (2), and action potential alternans (25). However, under all tested conditions, there was a direct correlation between tasys and tmito_depol, which is compatible with a causal relationship between the two events, although it may also indicate a mutual dependence on a critical level of energy depletion. The observed, “life supporting” effects of blebbistatin urge great caution in the interpretation of ischemic studies conducted in the presence of this drug but also underscore the outstanding cardioprotective properties of blebbistatin, which might be useful in the setting of clinical I/R and organ preservation.
METHODS
Ethical approval.
All procedures involving animals were approved by the Animal Care and Use Committee of the University of Utah (protocol number 11-09002) and complied with the National Institutes of Health's Guide for the Care and Use of Laboratory Animals (8th ed., 2011).
Langendorff-purfused rabbit hearts.
Adult New Zealand White rabbits of either sex (2.3 ± 0.5 kg) were euthanized by pentobarbital sodium (130 mg/kg iv). Hearts were quickly removed via midline sternotomy and attached to the Langendorff-perfusion apparatus in <3 min. Hearts were perfused with Tyrode solution consisting of 130 mM NaCl, 24 mM NaHCO3, 1.2 NaH2PO4, 1.0 mM MgCl2, 5.6 mM glucose, 4.0 mM KCl, 1.8 mM CaCl2, and 0.1 g/l albumin (pH = 7.4, and 37.0 ± 1°C) at a fixed rate of 30 ml/min. After an equilibrium period of 35 min, hearts were perfused with Tyrode solution containing the cationic flurophore tetramethylrhodamine perchlorate methyl ester (TMRM; 450 nM) for 30 min, followed by washout with normal Tyrode solution. Subsequent perfusion protocols depended on the experimental group as described below in detail; however, in all groups, the time interval between the heart cannulation and the onset of global ischemia was between 90 and 110 min, depending on the group.
All hearts were placed in a custom confocal imaging chamber with a coverslip built in the bottom of the chamber (29). Temperature was monitored in the right ventricular cavity and near the imaged area in the posterior left ventricular (LV) epicardial surface and maintained at both sites at 37.0 ± 1.0°C throughout the protocol. A global bipolar electrogram (an analog of ECG) was continuously recorded from silver electrodes placed on the bottom of the imaging chamber on the two sides of the ventricles. Additionally, a small flexible bipolar electrode was placed between the imaging coverslip and the heart in the vicinity of the area imaged in the confocal microscope. Two bipolar pacing electrodes made of a pair of Teflon-coated silver wires were inserted into the interventricular septum and the LV free wall to probe the excitation threshold and to apply rapid pacing. Outflow of the perfusate from the heart was allowed to fill the imaging chamber to a level of ∼4 mm from the bottom, which helped to maintain moisture and temperature at the imaged area and provided a volume conductor for the global ECG.
Global ischemia was initiated by the cessation of aortic perfusion and maintained for at least 60 min, followed by reperfusion. During ischemia, temperature was maintained at 37.0 ± 1.0°C by resistor heaters located in the perfusion bath walls and superfusion with heated Tyrode solution gassed with 95% N2-5% CO2. In four experiments, a miniature oxygen probe was inserted between the imaged area and the coverslip during ischemia to ensure hypoxic conditions at the imaged surface. Measured Po2 was <20 mmHg during ischemia.
Experimental groups.
A total of seven experimental groups were used in this study. Hearts in all groups were subjected to at least 60 min of global no-flow ischemia. In the control group (n = 7), the hearts were not treated with any drug and were not paced until the spontaneous ventricular activity was lost later in ischemia. In the Tachy group (n = 8), the hearts were rapidly paced during ischemia (details below). In the BBS group (n = 8), the hearts were treated with the myosin II ATPase inhibitor blebbistatin, which is routinely used for heart immobilization in cardiac imaging studies (8). In the BBS-IA group (n = 5), the hearts were treated with the combination of blebbistatin and the inhibitor of anaerobic glycolysis sodium iodoacetate. In the Glyb group (n = 6), the hearts were treated with the ATP-sensitive potassium channel (KATP) blocker glybenclamide before ischemia. In the Oligo10 and Oligo30 groups (n = 3 each), the hearts were treated with F0F1 ATPase blocker oligomycin at the concentration of 10 or 30 μM, respectively, for 12–15 min before the onset of ischemia.
In control, Tachy, Glyb, and Oligo groups, TMRM was washed out with normal Tyrode solution for 10 min. To arrest contraction and record baseline TMRM images before ischemia, hearts in these four groups were perfused for ∼15 min with a modified high-potassium Tyrode solution in which [KCl] was raised to 20 mM and [NaCl] was reduced to 114 mM; otherwise, the composition of the solution was the same as described above. The high-potassium solution was replaced with normal Tyrode solution, and normal sinus rhythm was observed for at least 10 min before the initiation of global ischemia.
In the Tachy group, pacing at a cycle length (CL) of 150 ms and stimulus current amplitude of 1.5 times excitation threshold was initiated immediately preceding ischemia. During ischemia, as the excitation threshold increased and one-to-one capture was lost, the stimulus amplitude was increased to 3 times and then to 10 times preischemic excitation threshold, and the CL was increased to 200, 300, and 700 ms to maintain the highest ventricular activation rate possible. In all other groups, pacing was not initiated until atrioventricular block or asystole was observed on the ECG, after which point the same pacing algorithm was used as described above but starting at a CL = 300 ms (approximate CL of the spontaneous sinus rhythm). Hearts were paced from the LV free wall location until threshold exceeded 10 times preischemic excitation threshold at which point pacing was switched to the second electrode located in the interventricular septum and the same pacing algorithm was applied. The duration of tachycardic rhythm during ischemia was defined as the time during which the excitation rate was maintained at 5 Hz (CL = 200 ms) or above, which included paced rhythms and ventricular tachycardia/fibrillation induced in some hearts by rapid pacing.
In BBS and BBS-IA groups, the TMRM staining solution and all remaining Tyrode solutions included 5.7 μM blebbistatin(+) (Sigma-Aldrich, St. Louis, MO). No high-potassium solution was needed because of the effective abolishment of contraction by blebbistatin. The hearts in BBS-IA group were perfused with the inhibitor of glycolysis sodium iodoacetate (250 or 1,000 nM, Sigma-Aldrich), dissolved in normal Tyrode solution for 15 min before the onset of ischemia.
Confocal imaging.
The posterior LV epicardial surface was imaged in a line scan mode using a Zeiss LSM 510 confocal microscope with a ×20 objective lens, giving a field of view (FOV) of 450 μm × 450 μm, with a resolution of 0.439 μm per pixel. The slice thickness was 2.7 μm. In the standard imaging mode, we obtained z-stacks with 9 to 14 slices taken at a distance of 2.7 μm between the centers of each slice, at time intervals of 3–5 min. The acquisition of one z-stack took ∼60 s. Shorter time intervals between z-stacks were avoided as they could cause a significant loss of TMRM signal (presumably because of TMRM bleaching) if repetitive recordings were continued over 30 min (not shown). Z-stacks were helpful in 1) selecting the slice with the sharpest images of synsitial myocytes and 2) tracking the same image plane amid macroscopic changes in myocardial geometry that consistently occurred during ischemia (for more, see results). In some cases, when a fast change in the pattern of TMRM fluorescence suggesting ΔΨm depolarization was evident, a continuous time series was recorded at a fixed z-depth giving the sharpest image. In this mode the XY scans were repeated as soon as the previous XY scan was finished (3.4 s per scan). TMRM was excited using a 543-nm laser; emission was collected using a 560-nm long pass filter. The laser power and detector gain were adjusted to ensure that the TMRM signal was not saturated. In some later experiments, we switched quickly between ×20, ×10, and ×2.5 lenses to keep recognizable features of the preischemic imaged area in the view, which drifted away during fast changes in heart geometry associated with the early phase of ischemia.
Data analysis.
To identify the time of a significant tmito_depol during ischemia, we used a spectral method introduced in our previous publication (29). This method relies on the periodic arrangement of the interfibrillar mitochondria, yielding distinct (“mitochondrial”) peaks in the spatial Fourier spectrum of the TMRM fluorescence image obtained with a confocal microscope. Loss of ΔΨm leads to equalization of TMRM concentration between the mitochondrial matrix and the cytosol, causing disappearance of these peaks (29). Consequently, the area under the “mitochondrial peak” (MPA) provides an index of mitochondrial polarization in ventricular myocytes (29). The time point when MPA values reached 50% of the difference between the minimum and maximum levels was used as tmito_depol. This time point was linearly interpolated when necessary. The tasys was defined as the time point at which no spontaneous ventricular activity was observed in either global or local electrogram, and there was no response to stimulus at 10 times preischemic excitation threshold applied at both pacing locations.
Statistical analysis.
To compare tmito_depol and tasys between experimental groups, we used a one-way ANOVA with Newman-Keuls post hoc test for individual pairwise comparisons. Linear regression analysis was applied to test for correlation between tmito_depol and tasys in four groups (control, Tachy, BBS, and BBS-IA) pooled together. A one-sample, two-tailed t-test was used to determine if the difference between tmito_depol and tasys in each group was significantly different from zero. All tests were performed using XLSTAT v. 2014.1.08 (Addinsoft USA, New York, NY). Statistical significance was declared at P < 0.05, and all the values presented in text, tables, and figures are means ± SD.
RESULTS
Figures 1, 2, 3, and 4 show representative examples of confocally recorded TMRM fluorescence and corresponding MPA dynamics, along with time-aligned global bipolar ECG from control, Tachy, BBS, and BBS-IA groups, respectively. All these figures have the same layout. Figures 1–4, A–C, show, from left to right, the original confocal TMRM images, their Fourier power spectrum, and spectral profiles, respectively, obtained at the selected time points indicated in Figs. 1–4, D. The spectral profiles are computed along the approximate longitudinal axis of myocytes indicated with yellow lines in the Fourier spectra. This line crosses two “mitochondrial peaks.” Because the spectra have radial symmetry, the two halves of the spectral profile and the respective “mitochondrial peaks” are summed up to yield the curves shown on the right-hand side of Figs. 1–4, A–C. MPA values are computed as the integral of the region indicated with green color in the spectral profiles [see Venable et al. (29) for more detail]. Figures 1–4, D, show the time course of MPA at 3–5 min time steps, time-aligned with a global bipolar electrogram (an analog of ECG). Red and green vertical, dashed lines indicate tasys and tmito_depol, respectively.
Fig. 1.

The relationship between mitochondrial membrane potential (ΔΨm) loss and asystole during global ischemia in a control heart. A–C, left to right: confocal images of TMRM fluorescence, the respective fast Fourier transform (FFT) power spectra, and the spectral profiles obtained along the direction of the longitudinal axis of myocytes (yellow dashed line). These data are obtained at the respective time points indicated in D. Light green in the spectral profiles denotes the mitochondrial peak area (MPA) that reflects the magnitude of ΔΨm. Vertical dashed lines indicate the position of mitochondrial peaks at the spatial frequency axis. Note the virtual absence of a mitochondrial peak in C, which corresponds to the loss of granular pattern in the tetramethylrhodamine perchlorate methyl ester (TMRM) image and heralds a significant, if not complete, loss of ΔΨm. D: time course of MPA time-aligned with the volume-conductor ECG (bottom). Gray area indicates the period of ischemia. Cyan color indicates the period of perfusion with a high (20 mM) concentration of potassium. Discontinuities in the MPA curve indicate changes in the field of view caused by the macroscopic shifts in the heart shape (shrinking/swelling) occurring during ischemia. Red arrow indicates the moment of ischemia-induced atrioventricular block, at which time ventricular pacing was initiated. Green dashed line indicates the time of 50% decrease in MPA (tmito_depol). Red dashed line, the time of asystole (tasys). Note that in this case asystole occurred ∼4 min after the apparent ΔΨm loss. Red asterisks indicate artifacts on the ECG caused by the movement of the microscope stage and manipulations on the perfusion tubing.
Fig. 2.

The relationship between ΔΨm loss and asystole during global ischemia in a heart from the group paced during ischemia at cycle length = 150 ms (Tachy group). A–C, left to right: layout is the same as in Fig. 1, A–C; confocal images of TMRM fluorescence, the respective FFT power spectra, and the spectral profiles obtained at the respective time points indicated in D. Note the virtual absence of a mitochondrial peak in C, which corresponds to the loss of granular pattern in the TMRM image and heralds a significant, if not complete, loss of ΔΨm. D: time course of MPA time-aligned with the volume-conductor ECG. The dashed line connecting points A and B indicates the fact that there were no confocal recordings between these two time points, but the imaged area in B could be recognized as the same or almost the same as the imaged area in A. Rapid pacing (cycle length = 150 ms) was initiated ∼1 min before the onset of ischemia. Green dashed line indicates tmito_depol. Red dashed line indicates tasys. Note that in this case asystole occurred ∼5 min before the apparent ΔΨm loss. Red asterisks indicates artifacts on the ECG caused by the movement of the microscope stage and manipulations on the perfusion tubing.
Fig. 3.

The relationship between ΔΨm loss and asystole during global ischemia in a heart from the group treated with 5.7 μM blebbistatin (BBS group). A–C, left to right: layout is the same as in Fig. 1, A–C; confocal images of TMRM fluorescence, the respective FFT power spectra, and the spectral profiles obtained at the respective time points indicated in D. Note the very low amplitude of the mitochondrial peak in C, which corresponds to the loss of granular pattern in the TMRM image and heralds a significant, if not complete, loss of ΔΨm. D: time course of MPA time aligned with the volume-conductor ECG. Note that unlike in Figs. 1 and 2, the preischemic perfusion with high potassium was not necessary because blebbistatin afforded complete immobilization. The fluctuations in the MPA values before and during the first 40 min of ischemia most likely reflect a high sensitivity of the MPA to slight changes in the focal plane. Red arrow indicates the moment of ischemia-induced atrioventricular block, at which time ventricular pacing was initiated. Green dashed line indicates tmito_depol. Red dashed line indicates tasys. Note a slow MPA decline compared with the control and Tachy groups (see Figs. 1 and 2). Asystole occurred ∼8 min before the apparent 50% ΔΨm loss, but after the (relatively slow) process of apparent ΔΨm loss had begun.
Fig. 4.

The relationship between ΔΨm loss and asystole during global ischemia in a heart from the group treated with 5.7 μM blebbistatin and 1 mM Na iodoacetate (BBS-IA). A–C, left to right: layout is the same as in Fig. 1, A–C; confocal images of TMRM fluorescence, the respective FFT power spectra, and the spectral profiles obtained at the respective time points indicated in D. Note the very low amplitude of the mitochondrial peak in C, which corresponds to the loss of granular pattern in the TMRM image and heralds a significant, if not complete, loss of ΔΨm. D: time course of MPA time aligned with the volume-conductor ECG. Note that unlike in Figs. 1 and 2, the preischemic perfusion with high potassium was not necessary because blebbistatin afforded complete immobilization. Black vertical arrow indicates the time when the perfusion was switched to the solution containing Na iodoacetate. Green dashed line indicates tmito_depol. Red dashed line indicates tasys. Note that the phase of fast MPA decline occurred very early (the point of 50% MPA loss was at 11.5 min of ischemia) compared with Figs. 1–3 but was followed by a partial recovery. Asystole occurred even earlier (at 6 min of ischemia) and never recovered. Red asterisks indicates artifacts on the ECG caused by the movement of the microscope stage and manipulations on the perfusion tubing.
Note that in hearts not treated with blebbistatin (control, Tachy, Glyb, and Oligo groups), the preischemic images were obtained during a brief period of perfusion with high-potassium solution (performed 20–30 min before the ischemic episode) as a means to abolish motion (indicated in cyan). In these hearts, complete cessation of contraction due to the ischemic contractile failure usually set the earliest time point at which confocal imaging became possible. In addition to rhythmic contractions, macroscopic changes in the heart shape (shrinking/swelling) could render confocal imaging impossible, because the imaged area significantly shifted even during a single scan. In 6 of 7 hearts from the control group, the “blind” period caused by the two types of motion artifact ranged from 7 to 13 min. In one control heart, the “blind” period was extended to 19 min because of technical problems with the microscope. In the BBS group, the main source of motion artifact was the macroscopic change in heart shape, although in some cases blebbistatin appeared to lose efficacy within the first 5–10 min of ischemia, leading to microscopic rhythmic contractions. In 7 of 8 hearts from the BBS group, the “blind” period (predominantly caused by heart shape changes) ranged from 5 to 10 min. In one BBS heart, the “blind” period was close to 20 min due to technical difficulties. Despite these limitations, the earliest MPA values obtained during ischemia were not significantly different from the preischemic MPA values in both control and BBS groups [89 ± 23 and 92.5 ± 26.7% of the preischemic value, respectively; P = not significant (NS)]. In contrast, the end-ischemic MPA values were very significantly lower than preischemic MPA values in both control and BBS groups (11.3 ± 3.5 and 24.9 ± 8.7% of the preischemic value, respectively; P < 0.0001). In summary, confocal imaging in whole hearts was not possible during the early phase of ischemia either in the absence or in the presence of blebbistatin, but it is unlikely that the critical ΔΨm depolarization occurred during that time period.
Figures 5, 6, and 7 show expanded segments of both the global and the local LV electrogram at selected time points (including the moment of asystole) during representative experiments from the control, BBS and BBS-IA groups, respectively. BBS and BBS-IA groups exhibited the largest deviation in tasys from the control group; in all other groups, the values of tasys fell in the range between the two extreme cases. It can be seen that the shape and amplitude of both global ECG and local LV EG varied greatly in the course of the experiment, which reflected changes in electrical activity due to evolving ischemia, the presence or absence of pacing or episodes of spontaneous VF, as well as changes in the heart shape occurring during ischemia. The timing of the last ventricular beat in each experiment required meticulous inspection of the ECG to distinguish between the R waves diminishing with the time of ischemia, stimulus artifacts, and occasional artifacts caused by movement of the microscope stage or rotation of the lens turret. The amplitude of the stimulus artifact varied a great deal between experiments and, in some cases, exceeded the amplitude of the signal at later stages of ischemia. To aid a detection of faint R waves close to tasys, in some cases we applied a median filter to remove stimulus artifacts. However, in each experiment, the last R wave was clearly identifiable. In some cases the local LV electrogram lost detectable activity a few minutes before the global ECG (as in the control case shown in Fig. 5), which could reflect local heterogeneities in the timing of electrical failure (30). On average, the loss of R waves in the local LV electrogram preceded global asystole by 1.6, 3.0, 1.5, and 0.7 min in control, Tachy, BBS, and BBS-IA groups, respectively. We never observed the opposite, i.e., detectable local LV activity in the absence of detectable R waves in the global ECG. Since the local LV electrode was not truly representative of the imaged area (because it was about 3 mm away, not to interfere with the imaging), we decided to limit further analysis to the global ECG, which probably was the best available indicator of total electrical failure and provided the closest analog of information used for diagnosis of asystole in the setting of sudden cardiac arrest.
Fig. 5.

Expanded segments of global and local ECG recordings at selected time points (as indicated) from a representative control experiment. All recordings during ischemia show paced rhythm. Arrows show the last identified ventricular excitation in the local and the global ECG, respectively. Note that local electrical failure occurred ∼3 min before the global electrical failure (asystole). The dual ECG strips showing the moments of local and global electrical failure are supplemented with the tracings of stimuli (note a different time scale). Note also that P waves asynchronous with pacing and ventricular activity are present in all ischemic recordings and persist even after full loss of ventricular capture. Stim, stimulus.
Fig. 6.

Expanded segments of global and local ECG recordings at selected time points (as indicated) from a representative BBS experiment (heart treated with 5.7 μM blebbistatin). All recordings during ischemia show paced rhythm. Arrows show the last identified excitation in the local and the global ECG, respectively. In this experiment local and global electrical failure occurred simultaneously. Note a different time and voltage scale in the lowermost dual ECG strip. The recording at the very bottom shows the timing of stimulation. Note that the spikes seen in the local EG recording after the last detected excitation are due to stimulus artifacts.
Fig. 7.

Expanded segments of global and local ECG recordings at selected time points (as indicated) from a representative BBS-IA experiment (heart treated with 5.7 μM blebbistatin and 1 mM iodoacetate). Arrows show the last identified excitation in the local and the global ECG, respectively. The dual ECG strips showing the moments of local and global electrical failure are supplemented with the tracings of stimuli. Note a different time and voltage scale in these two ECG strips. Noteworthy features: 1) partial atrioventricular blockade occurred already before the onset of ischemia; 2) a fine ventricular fibrillation is seen at 3 min of ischemia; and 3) before the full electrical failure, the amplitude of both global and local ECG is only about 5–10% of the preischemic amplitude.
Ischemic mitochondrial depolarization and asystole in control.
Figure 1 shows data from a representative control experiment. Figure 1A shows data obtained under normoxemic conditions 18 min before ischemia in the presence of 20 mM extracellular [K+]. During perfusion with the high-potassium solution (shown with cyan in Fig. 1D), cardiac excitation and thus contraction were fully abolished. It can be seen that the TMRM fluorescence had a “granular” appearance typical of well-polarized mitochondria and yielded prominent “mitochondrial bands” in the Fourier spectrum. Accordingly, the spectral profile along the longitudinal axis of myocytes featured a large-amplitude mitochondrial peak at spatial period approximately corresponding to the interval between the Z disks (2.15 μm), as well as its first harmonic.
Figure 1B shows data obtained at 9 min of ischemia. Note that the actual imaged myocytes are not the same as in the preischemic image (see Fig. 1A), because the heart rapidly changed shape within the first 8 min of ischemia and the original FOV was lost. However, the TMRM image at 9 min of ischemia was similar in appearance to that before ischemia. Likewise, the Fourier spectrum and the corresponding spectral profile (Fig. 1B, middle and right) showed large-amplitude mitochondrial peaks, yielding MPA at about 98% of the preischemic value. These data suggest that within the first 10 min of ischemia, the ΔΨm was largely preserved. Note, however, that the position of the mitochondrial peak shifted during ischemia to a shorter spatial period (from 2.15 to 1.95 μm), reflecting shortening of the sarcomere.
MPA moderately decreased between 10 and 20 min and then catastrophically decreased between 23 and 24 min of ischemia. The confocal TMRM image obtained after this transition (Fig. 1C, left, corresponding to point C in Fig. 1D) shows disappearance of the “granular” pattern, suggesting redistribution of TMRM between the mitochondrial matrix and the cytosol. Accordingly, the Fourier spectrum and the spectral profile (Fig. 1C, middle and right) reveal the virtual absence of the mitochondrial peaks. These changes strongly suggest that in this experiment, a significant ΔΨm loss occurred between 23 and 24 min of global ischemia (tmito_depol = 23.5 min). Due to additional changes in the heart shape (typically associated with rapid phases of the apparent ΔΨm loss) and the ensuing drift of the imaged area and the focal plane, the imaged area continuously imaged between time points B and C was lost. However, the two adjacent regions imaged during the rest of the ischemic period showed a similar “smooth” appearance of the TMRM image and similarly low levels of MPA (not shown), suggesting that a significant ΔΨm loss had also occurred in those regions.
In one control experiment, there was evidence of compromised myocytes at baseline, and an extreme contracture leading to highly contorted shapes of myocytes had occurred relatively early in ischemia. Since these phenomena were not observed in other control experiments, data from this experiment were excluded from statistical analysis. In the remaining seven control hearts, tmito_depol occurred at 24.4 ± 6.0 min of ischemia (range, 17.5–36.0 min). In 5 out of 7 control experiments, there was an apparent rapid phase of ΔΨm loss, such that the most of MPA decrease occurred within 10 min, whereas in the remaining two control experiments, the MPA decrease was more gradual during ischemia.
The global bipolar electrogram (an analog of ECG) recorded simultaneously with confocal imaging is presented in the bottom of Fig. 1D. It shows transient cessation of electrical activity caused by perfusion with high-potassium solution, during which the baseline confocal image was acquired (point A). Complete atrioventricular block occurred at ∼7 min of ischemia (red arrow) and was followed after a short delay with ventricular pacing. The red dashed line indicates the time at which pacing from two ventricular locations at stimulus amplitude 10 times preischemic excitation threshold failed (tasys), which in this case followed tmito_depol by 4 min. In this and other control hearts, asystole occurred at 26.0 ± 5.0 min of ischemia (range, 17 to 33 min). The average time delay between tasys and tmito_depol (tasys − tmito_depol) was equal to 1.6 ± 5.0 min and was not significantly different from zero.
Ischemic mitochondrial depolarization and asystole in hearts rapidly paced during ischemia (Tachy group).
Tachycardic rhythm is present in a large fraction of cases of sudden cardiac arrest. Because of increased metabolic load and increased intracellular Na+ and Ca2+, it is possible that a high excitation frequency during global ischemia affects tmito_depol, tasys, or the relationship between the two. Thus, in the Tachy group (n = 8), we applied rapid pacing (CL = 150 ms) starting at 2 to 3 min before ischemia and continuing during ischemia for as long as the heart could follow this pacing rate in a one-to-one fashion. As the ability to capture the heart progressively deteriorated during ischemia, the CL and the stimulus current were progressively increased as described in methods. Rapid pacing precipitated transient episodes of ventricular tachycardia or fibrillation in 7 of 8 hearts with an excitation rate similar to the rate of pacing. Tachycardic rhythm (either paced rhythm or VT/VF at CL not exceeding 200 ms) was maintained for the first 16.5 ± 4.1 min of ischemia, after which time point increasing postrepolarization refractoriness reduced the maximal rate the heart could follow. Neither tmito_depol nor tasys was significantly affected by the presence of tachycardic rhythm during the above-mentioned time period of early ischemia (tmito_depol, 23.0 ± 4.2 min; and tasys, 20.7 ± 4.7 min; P = NS vs. control). A representative example of confocal imaging and ECG data from the Tachy group are shown in Fig. 2 (the same layout as in Fig. 1).
Blebbistatin greatly postpones ischemic mitochondrial depolarization and asystole.
Blebbistatin, a recently discovered selective inhibitor of myosin II ATPase, has become a “standard of care” electromechanical uncoupler for use in experimental studies involving optical mapping or confocal imaging, including those addressing effects of I/R on electrophysiological parameters and ΔΨm dynamics (6, 23, 24). It was recently shown that blebbistatin postpones changes in cellular redox state associated with ischemia (32). So it was important to test whether blebbistatin also modulates the time of ischemic electrical failure and ΔΨm loss.
Results from a representative BBS experiment are shown in Fig. 3. One can see that both ΔΨm depolarization and asystole were dramatically postponed compared with control (compare with data in Fig. 1). One can appreciate a relatively slow (as compared with Figs. 1 and also 2) dynamics of MPA decrease, which started at ∼35 min of ischemia and continued until ∼65 min of ischemia. Within the first 30 min of ischemia, MPA dynamics show minor fluctuations (at the level close to the preischemic level), which are most likely due to sensitivity of the spectral analysis to slight changes in the position of the focal plane, often unavoidable in experiments using whole hearts. Despite these fluctuations, the overall decrease of MPA by about 90% of the preischemic value is perhaps a robust indicator of true ischemic ΔΨm loss. In this and other BBS experiments, the estimated tmito_depol was 51.4 ± 8.6 min of ischemia (range, 43.0–69.7 min), an increase of 111% over the control value (P < 0.0001). In the BBS group, the speed of the MPA loss appeared to be slower than in the control group, but it varied greatly among individual BBS experiments and it was difficult to quantify.
In the case shown in Fig. 3, tasys preceded tmito_depol by 7 min. Note, however, that at tasys, a decrease in the MPA value was already apparent. In this and other BBS hearts, asystole occurred at 45.7 ± 5.3 min of ischemia (range, 39–53 min). The average time delay between tasys and tmito_depol (tasys − tmito_depol) was equal to −5.7 ± 7.2 min and was not significantly different from zero, despite the fact that in 7 of 8 BBS experiments, asystole occurred before 50% MPA loss.
Glycolysis inhibition greatly accelerates ischemic mitochondrial depolarization and asystole.
To assess the role of anaerobic glycolysis in the prolonged maintenance of ΔΨm and myocardial excitability during ischemia afforded by blebbistatin, four hearts were treated with an inhibitor of glycolysis sodium iodoacetate (250–1,000 μM) in addition to blebbistatin (BBS-IA group). Figure 4 shows a representative example of such an experiment. Before the onset of ischemia, there were no major effects of iodoacetate on either ΔΨm or electrical activity. However, electrical failure occurred extremely early in the course of ischemia (at 6 min of ischemia) and was shortly followed by a sharp MPA decrease, reaching the 50% level at 12.5 min of ischemia. Of interest, the phase of sharp MPA decrease was followed by a partial recovery in MPA (observed in 3 out of 5 BBS-IA experiments), but electrical activity never recovered. It should also be noted that upon reperfusion, BBS-IA hearts never recovered any electrical activity and apparently had a complete ΔΨm loss within the first 10 min of reperfusion (not shown). In five BBS-IA experiments, tasys was 6.5 ± 1.1 min and tmito_depol was 12.7 ± 1.8 min. Both tasys and tmito_depol in BBS-IA group were significantly different from the values of the respective parameters in both BBS and control groups. Thus preservation of ΔΨm and sarcolemmal excitability afforded by blebbistatin during ischemia is fully abolished by the blockade of anaerobic glycolysis.
The coordinated response of tasys and tmito_depol to interventions affecting energy balance becomes more evident when the data from the control, Tachy, BBS, and BBS-IA groups are pooled together (Fig. 8). One can see that overall there is a strong direct correlation between the timing of the two critical events (R2 = 0.845, P < 0.0001), such that, on average, tasys is slightly ahead of tmito_depol. Note that the points from the control and Tachy groups significantly overlap, whereas the points from BBS and BBS-IA groups form distinct clusters fully separated from the control/Tachy cluster.
Fig. 8.
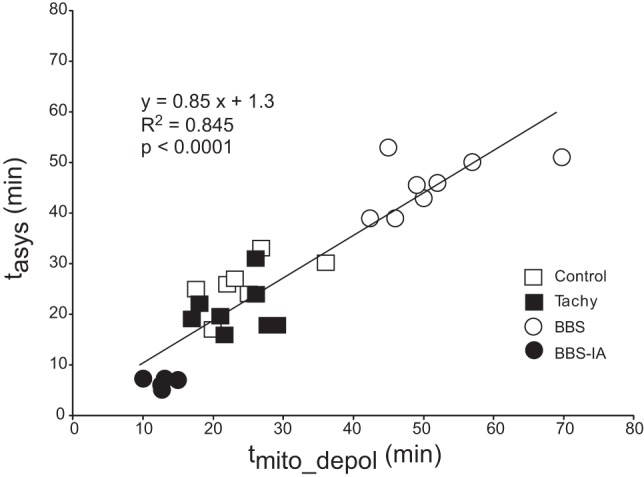
Direct correlation between tmito_depol and tasys in 4 groups (control, Tachy, BBS, and BB-IA) pooled together. Note that on average tasys was slightly ahead of tmito_depol, judging from the fact that the slope of the linear regression curve was <1.
Effects of blocking KATP on ischemic mitochondrial depolarization and asystole.
A possible reason for correlation between ΔΨm collapse and electrical failure during ischemia is the activation of the sarcolemmal KATP due to ATP consumption by depolarized mitochondria (2, 19). To further ascertain the role of KATP in ischemic asystole we performed experiments using the KATP blocker glybenclamide (10 μM, Glyb group), the drug most commonly used for testing the role of the sarcolemmal KATP channel during ischemia (2). In theory, glybenclamide may also block the mitochondrial KATP (mKATP). The expected outcome would be prolonged maintenance of ΔΨm during ischemia and possibly preservation of ATP. It is appropriate to note, however, that the very existence of mKATP remains controversial (10). Whereas the role of mKATP in acutely ischemic myocardium has never been directly demonstrated, it was shown that at the concentration used in this study (10 μM), glybenclamide does not alter the dynamics of ATP depletion during ischemia (7). Therefore, regardless of possible effects of glybenclamide on the mKATP, using this drug to test the role of the sarcolemmal KATP in tasys was deemed to be appropriate.
Data from a representative heart treated with glybenclamide are shown in Fig. 9. Glybenclamide postponed tasys (to 32.9 ± 7.1 vs. 26.0 ± 5.0 min in control, P < 0.05), supporting a role of KATP in ischemic electrical failure (2, 27). tmito_depol in the Glyb group (measured as the time of 50% MPA loss) was not different from control (24.6 ± 6.5 vs. 24.4 ± 6.0 min in control, P = NS). However, unlike the control group, in the Glyb group the earliest possible ischemic MPA values (obtained at 12.2 ± 1.6 min of ischemia) were significantly lower than the preischemic values (69.0 ± 13.9% of preischemic value, P = 0.001). In one Glyb experiment, the earliest ischemic MPA value recorded at 10 min of ischemia fell below 50% of the preischemic value, which necessitated the exclusion of this experiment from tmito_depol analysis. Thus it is possible that glybenclamide caused partial ΔΨm depolarization early in ischemia (see possible reasons in discussion).
Fig. 9.

Relationship between ΔΨm loss and asystole during global ischemia in a heart from the group treated with 10 μM glybenclamide (Glyb group). A–C, left to right: confocal images of TMRM fluorescence, the respective FFT power spectra, and the spectral profiles obtained at the respective time points indicated in D. Note the virtual absence of the mitochondrial peak in C, which corresponds to the loss of granular pattern in the TMRM image and heralds a significant, if not complete, loss of ΔΨm. D: time course of MPA time aligned with the volume-conductor ECG. Gray area indicates the period of ischemia. Cyan color indicates the period of perfusion with a high (20 mM) concentration of potassium. Discontinuity in the MPA curve between points A and B indicates a change in the field of view caused by macroscopic shifts in the heart shape (shrinking/swelling), which occurred during early ischemia. Green dashed line indicates tmito_depol. Red dashed line indicates tasys. Asystole occurred after the apparent 50% ΔΨm loss, which was the case in all Glyb experiments (see Fig. 11). Note that the earliest ischemic value of MPA (point B) was much lower than the preischemic value (point A). This was a consistent finding in the Glyb group, contrasting it from other groups for reasons not completely understood (see text for more detail). Red asterisks indicate artifacts on the ECG caused by the movement of the microscope stage and manipulations on the perfusion tubing.
Effects of blocking F0F1 ATP synthase on ischemic mitochondrial depolarization and asystole.
To confirm that ΔΨm during ischemia is maintained because of ATP hydrolysis by F0F1 ATP synthase working in reverse, we used F0F1 ATP synthase blocker oligomycin. At the concentration of 10 μM (Oligo10 group, n = 3), oligomycin did not have any significant effect (not shown). At the concentration of 30 μM (Oligo30 group, n = 3), oligomycin dramatically accelerated ΔΨm depolarization. Specifically, the earliest ischemic MPA value (measured at 4.8 ± 1.1 min of ischemia) was already reduced to 53.2 ± 12.5% of the preischemic level (P = 0.023). In two hearts, tmito_depol (defined as the time point at which the MPA value fell below 50% of the preischemic) was 7.0 and 8.5 min of ischemia. In the remaining heart from this group, the earliest MPA value measured at 5.5 min of ischemia was already below 50% of the preischemic value. When 5.5 min is used as the conservative estimate of tmito_depol in this experiment, the average between three Oligo30 experiments was 7.0 ± 1.5 min, which was significantly shorter than in control (P < 0.05). This supports the essential role of F0F1 ATP synthase (ATPase) in ΔΨm maintenance during ischemia. tasys in the Oligo30 group was 18.7 ± 3.1 min, which was not significantly different from control.
Summary of tasys and tmito_depol in different experimental groups.
Fig. 10, A and B, summarizes the statistical analysis of tasys and tmito_depol, respectively, in all experimental groups. All pairwise comparisons were performed, but only physiologically meaningful significant differences are indicated. When compared with control, tasys was significantly prolonged in the Glyb and the BBS group and significantly shortened in the BBS-IA group. Also, tasys was significantly shorter in the BBS-IA and Oligo30 groups than in the BBS group. When compared with control, tmito_depol was significantly prolonged in the BBS group and significantly shortened in the BBS-IA and Oligo30 groups. Also, tmito_depol was significantly shorter in the BBS-IA and Oligo30 groups than in the BBS group.
Fig. 10.
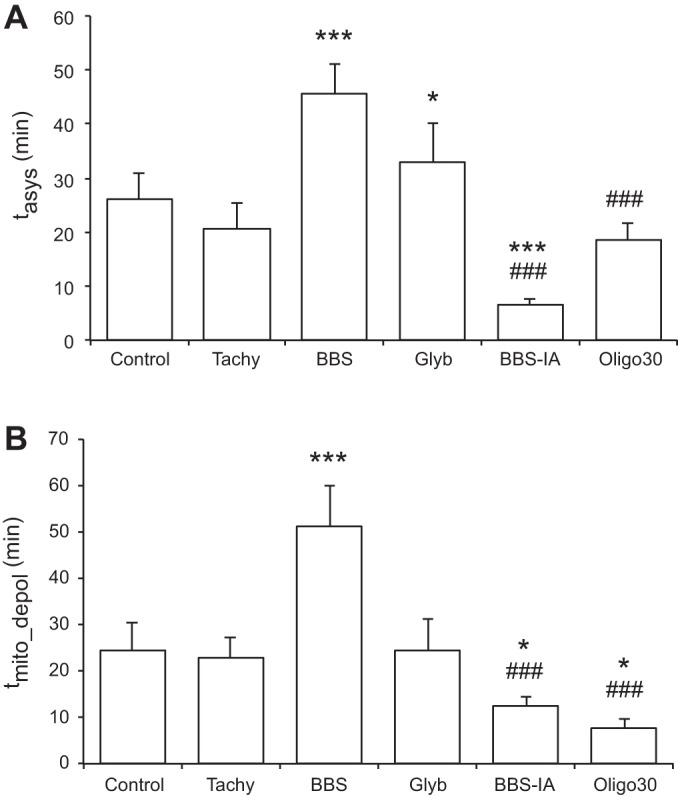
Comparison of tasys (A) and tmito_depol (B) between all experimental groups. Oligo30 group, group treated with F0F1 ATPase blocker oligomycin at the concentration of 30 μM for 12–15 min before the onset of ischemia. *P < 0.05 vs. control; ***P < 0.0001 vs. control; ###P < 0.0001 vs. BBS.
Figure 11 shows the difference between tasys and tmito_depol in all experiments. In each group this difference was compared with zero (i.e., the 2 events are simultaneous). One can see that in the control and Tachy groups, there was no consistent order in the timing of the two critical events. In the BBS group, in all but one heart tasys was ahead of tmito_depol, but the presence of two outliers precluded statistically significant difference from zero. In all BBS-IA experiments, tasys was ahead of tmito_depol, and in all Glyb and Oligo30 experiments, tasys was behind tmito_depol. The difference between tasys and tmito_depol was significant (P < 0.05) in BBS-IA and Glyb groups and was close to being significant (P = 0.058) in the Oligo30 group.
Fig. 11.
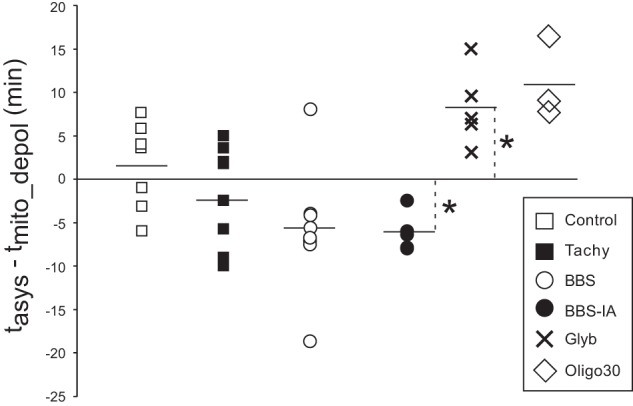
The difference between tasys and tmito_depol (tasys − tmito_depol) in all experiments from all the groups. Positive values mean that tasys follows tmito_depol and vice versa. The horizontal line in each group indicates the average value. Note that in the BBS-IA group, tasys always precedes tmito_depol, and in the Glyb and Oligo30 groups, tasys always follows tmito_depol. *P < 0.05 vs. 0.
DISCUSSION
Detection of ΔΨm loss during no-flow ischemia.
To our knowledge, this is the first study in which confocal imaging of ΔΨm-senstitive fluorescence was performed in hearts subjected to total (no flow) ischemia in the absence of electromechanical uncouplers. Lyon et al. (14) also investigated the dynamics of ΔΨm in a globally ischemic heart without use of chemical immobilization, but these authors used wide-field video imaging instead of confocal microscopy. According to these authors, ΔΨm depolarization to a level below 50% of the preischemic level occurred within 7 min of global no-flow ischemia, which is much earlier than tmito_depol determined in our study (on average, 24 min of ischemia). The discrepancy may be related to different species (rats vs. rabbits). In addition to that, the difference in the method may be important. Lyon et al. reported a decrease in TMRM fluorescence in some locations to almost zero level during the first few minutes of ischemia. We did not observe any consistent decrease in the average level of TMRM fluorescence during global ischemia, neither using video imaging nor using confocal microscopy, as we reported in our previous publication (29). Theoretically, the TMRM signal obtained using wide-field imaging (and thus not resolving individual mitochondria) is not expected to decrease during no-flow ischemia, since the system is closed and the total amount of TMRM molecules emitting fluorescence remains the same. To detect ΔΨm depolarization under these conditions, an approach allowing distinction between mitochondrial and nonmitochondrial TMRM fluorescence is necessary. That is why we developed a method based on the spectral analysis of confocally recorded TMRM fluorescence described and validated in our previous publication (29). This method relies on the fact that the periodic packaging of interfibrillar mitochondria creates distinct (“mitochondrial”) peaks in the spatial Fourier spectrum derived from confocal TMRM images when mitochondria are polarized and that these peaks disappear when mitochondria are depolarized. Assuming that this method faithfully reproduces the actual ΔΨm loss during ischemia, we have to conclude that a significant ΔΨm depolarization occurs relatively late (at ∼25 min of ischemia). This is much later than it was previously thought (14) and suggests that ΔΨm depolarization has little or no role in early ischemic events, such as contraction failure, action potential shortening (2), and action potential alternans (25). It is of interest that the observed timing of ΔΨm loss is close to the minimal duration of ischemia in the rabbit heart after which myocardial infarction is detectable (20 min) (15). Thus it is possible that the event of ΔΨm loss during ischemia per se is an important factor in postreperfusion cell injury.
Relationship between ΔΨm collapse and electrical failure during global ischemia: mutual dependence on energy balance.
ΔΨm collapse during no-flow ischemia is a critical event in I/R, which has been implicated in the loss of myocardial excitability and subsequent postreperfusion lethal arrhythmias by a mechanism of so-called “metabolic sink block” (2). Conceptually, the mechanism involves ΔΨm loss due to the opening of the inner membrane anionic channel, which is a self-enhancing and propagating event because inner membrane anionic channel opening is promoted by reactive oxygen species (ROS) and in turn releases ROS. It is further assumed that ATP hydrolysis by the mitochondrial F0F1 ATPase under these conditions causes a critical depletion of cellular ATP and activation of KATP channels. In turn, KATP activation causes a critical source-sink mismatch by dramatically increasing the sink for the excitatory current, leading to conduction failure (2). This mechanism was postulated without the actual analysis of the ischemic dynamics of ΔΨm. Our study shows a strong temporal correlation between the time of the estimated 50% of ΔΨm loss and the moment of the electrical failure under a variety of experimental conditions (see Fig. 8). In addition, blockade of KATP by glybenclamide postponed asystole by about 7 min and also increased the separation between 50% MPA loss and asystole from ∼2 to ∼11 min. Overall, these findings are compatible with the postulated “metabolic sink block” mechanism. However, it is clear that ΔΨm collapse is not a necessary prerequisite for electrical failure during ischemia, and the temporal relationship between the two critical events depends on the context. Indeed, whereas in the majority (4/7) of control hearts asystole followed 50% ΔΨm loss, the majority of hearts in the Tachy and BBS groups and all hearts in the BBS-IA group experienced asystole before 50% ΔΨm loss. In fact, in several hearts from these groups, asystole occurred before any significant decrease in ΔΨm estimated by MPA.
We propose that both ΔΨm collapse and asystole in the globally ischemic heart are determined by a critical decrease in ATP, which in turn is determined by all sources and sinks of energy during ischemia. Major consumers are muscle myosin II ATPase, ATP-hydrolyzing ionic pumps, and the mitochondrial F0F1-ATPase. The almost exclusive source of ATP is anaerobic glycolysis, although small amounts of ATP come from GTP/ATP producing reaction in the citric acid cycle converting succinyl-CoA to succinate and catalyzed by succinyl-CoA ligase (17). During near-anoxia, ΔΨm can be maintained at almost unchanged level as long as the glycolytic ATP flux supplies enough ATP to the mitochondria to keep the free energy of ATP hydrolysis below the electrochemical proton potential (9). Our experiments using glycolysis inhibitor iodoacetate and F0F1-ATPase inhibitor oligomycin confirm the critical role of anaerobic glycolysis and ATP hydrolysis by mitochondria in the maintenance of ΔΨm during total ischemia. It should also be noted that ΔΨm can be maintained at a relatively constant level even when the cytosolic [ATP] decreases and the KATP channel is activated (9). Thus the opening of KATP channels is ultimately determined by the dynamics of the balance between the glycolytic ATP production and the major consuming processes mentioned above, and it does not have to follow ΔΨm collapse. In fact, the primary dependence of KATP regulation on glycolytically derived ATP has been firmly established (31).
The most straightforward explanation for the delay of ΔΨm collapse and asystole afforded by blebbistatin compared with the control group is ATP preservation due to blockade of muscle myosin II ATPase. Other relevant effects of blebbistatin have not been directly demonstrated but cannot be excluded. For example, blebbistatin helps to preserve ATP levels in isolated quiescent adult cardiomyocytes (1), the effect of which cannot be explained by abolishment of contraction. Some of the effects of blebbistatin can be mediated via inhibition of nonmuscle myosin II, a ubiquitous component of cellular cytoskeleton. In a noncardiac cell model, blebbistatin was shown to inhibit mitochondrial fission (12). Inhibiting mitochondrial fission protects the heart against I/R injury (16). However, it remains unknown whether mitochondrial fission contributes to ATP depletion during ischemia and whether blebbistatin can modulate this process in the ischemic myocardium.
Inhibition of anaerobic glycolysis, the major source of ATP during ischemia, not only reverted the effects of blebbistatin but also significantly shortened the timing of ΔΨm collapse and asystole compared with control. This result strongly supports the assumption that the effects of blebbistatin are due to ATP preservation and emphasizes the role of anaerobic glycolysis as the major determinant of ΔΨm collapse and asystole in the ischemic heart.
Assuming that both ΔΨm collapse and asystole are determined by the ischemic level of ATP, it is difficult to explain the fact that rapid pacing did not significantly change tmito_depol and tasys, because the increased frequency of excitations and contractions should have imposed larger energy demand. However, one should bear in mind that glycolytic flux during ischemia is not a static entity. It is regulated by various signaling pathways sensing metabolic demand (e.g., AMPK pathway), and it is conceivable that rapid pacing induced upregulation of glycolysis resulting in additional ATP synthesis in the Tachy group, which could effectively compensate for the increased energy demand. In support of this theory, our preliminary results indicate that in a slightly different model of increased metabolic stress (ischemia combined with pacing at CL = 200 ms in the presence of β-agonist isoproterenol) lactate production (which is proportional to the rate of glycolytic ATP synthesis) is increased compared with ischemia alone (unpublished data from this group). Detailed analysis of the effects of blebbistatin, rapid pacing, and other relevant factors on energy metabolism during ischemia is the subject of an ongoing study in our laboratory.
Two unexpected observations of this study merit an attempt at explanation. First, in the presence of iodoacetate, a dramatic ΔΨm loss early in ischemia was followed by partial recovery of ΔΨm (see Fig. 4). One possibility is a decrease in the blocking efficacy of iodoacetate due to some changes in the chemical environment caused by ischemia. Alternatively, a GTP/ATP producing reaction catalyzed by succinyl-CoA ligase, which remains active throughout long periods of ischemia, could have been upregulated under conditions of glycolytic inhibition, possibly because of an enhancement of ischemia-induced increase in inorganic phosphate (17), thus providing a source of ATP for the maintenance of ΔΨm.
Another unexpected observation is that glybenclamide caused an apparent partial decrease in ΔΨm during early ischemia (when confocal imaging is precluded by motion artifacts), so that the first ischemic value of MPA was significantly lower than the preischemic value. Glybenclamide has always been the most widely used drug to study the dynamics of sarcolemmal KATP channel activation during ischemia. However, glybenclamide allegedly also blocks the mKATP channel. It is appropriate to note that the very existence of mKATP is still disputed, (10) and to the best of our knowledge, the role of the putative channel in the ΔΨm dynamics during acute ischemia is not known. In any event, it is difficult to explain the observed partial ΔΨm depolarization during early ischemia in terms of the blockade of mKATP channel, which should have the opposite effect. However, ΔΨm-dissipating effects of glybenclamide unrelated to mKATP have been reported (22) and could possibly occur in our experimental model.
Use of blebbistatin should be avoided in studies concerning mechanisms and outcomes of myocardial I/R.
One of the conundrums for researchers attempting real-time imaging in beating hearts is the necessity to immobilize the heart, which, unavoidably, alters the outcomes. The current study shows that blebbistatin is an extreme case in point, because it changed all the major end points of the study (the time of ΔΨm collapse and the time of asystole) by about 100%. Blebbistatin was previously shown to affect electrophysiology (4) but not to interfere with the mechanism of VF (13) in normoxemic hearts. However, Wengrowski et al. (32) have recently demonstrated that blebbistatin dramatically postpones NADH accumulation during acute ischemia, indicating a significant interference of this drug in the natural course of ischemic events (32). Clearly, our study extends their observation, demonstrating that blebbistatin also postpones ΔΨm collapse and asystole. Even beyond that, our preliminary results indicate that blebbistatin drastically reduces cell necrosis and the infarct size after 60 min of ischemia and 3 h of reperfusion (28). Clearly, these findings largely exclude blebbistatin as a viable tool for heart immobilization in studies concerning the mechanisms and outcomes of I/R. Researchers should look for alternative approaches that have lesser influence on I/R phenomena.
Perhaps at this point it is easier said than done. Other popular heart immobilizers (butanedione monoxime and cytochalasin D) were shown to have various effects on cardiac electrophysiology, arrhythmias, and energy balance in normal or ischemic hearts (3, 21). Complete exclusion of immobilizers from physiological cardiac imaging is difficult. The degree of difficulty depends on the type of imaging. For wide-field video imaging (also known as “optical mapping”), immobilization by way of mechanical restraint served well enough in many of those studies that focused on analysis of propagation of electrical waves in the heart (5, 30). There were a few attempts to use “demorphing” approaches for the purposes of virtual immobilization of the heart (18) and ratiometric imaging to subtract the motion artifact (11). However, these approaches have not substituted for the wide use of chemical immobilizers by the optical mapping community, perhaps indicating their limited practical utility. For imaging physiological parameters whose dynamics are slow compared with the cardiac cycle (e.g., ΔΨm, [NADH], [FADH2], and [ROS]), the motion artifact may be of lesser concern because the signals can be averaged over many contraction cycles. However, I/R imposes additional problems because of deformation of the heart geometry following shrinking/swelling of the myocardium during I/R. As we argued in our previous publication (29), such changes in heart shape may seriously confound interpretation of slow signals recorded using optical mapping techniques, because the changes in fluorescence intensity due to spatial deformations and attendant differences in illumination, scattering, and/or local fluorophore concentration can be misinterpreted as reflecting a real change in the physiological parameter of interest. Of note, shrinking/swelling of myocardium during I/R is not abolished by blebbistatin (29) or butanedione monoxime (V. Garg, T. G. Taylor, and A. V. Zaitsev, unpublished data).
Confocal or multiphoton imaging of physiological fluorescent indicators in live perfused hearts is a newer modality than optical mapping. With currently available apparatuses, the cellular and subcellular images of syncytial cardiac myocytes cannot be obtained without complete or nearly complete elimination of cardiac contraction. Thus, to the best of our knowledge, all studies of this kind performed to date involved using one of the electromechanical uncouplers, including at least two studies addressing the dynamics of ΔΨm during I/R, which used blebbistatin (6, 23). The current study may be the first to present information about ischemic changes in ΔΨm without uncouplers. To do so, for control recordings of ΔΨm, we immobilized the heart using a hyperkalemic solution. We postulated that depolarization of the plasma membrane with a high extracellular concentration of potassium did not have a major effect on ΔΨm. Nevertheless, such physiological modulations of ΔΨm are unlikely to be comparable to ΔΨm collapse occurring during total ischemia. During ischemia, we took advantage of contraction failure leading to complete heart immobilization between 5 and 15 min of ischemia. From that moment on, we were able to obtain high-fidelity confocal images and track the changes in ΔΨm based on the MPA measurement. An obvious limitation of this approach is the inability to track ΔΨm during the early phase of ischemia, before the ischemic contraction failure takes place. Fortunately for us, the critical transition, i.e., when MPA value fell below 50% of its dynamic range, occurred after contraction failure in all experiments not using blebbistatin, with the exception of one experiment in the Glyb group and one experiment in Oligo30 group. Note that these are the cases in which the ischemic process is modulated by drugs. Thus it appears to be the case that in the natural course of ischemia, the failure of contraction precedes ΔΨm collapse.
Summarizing the above, blebbistatin presents an outstanding example of the situation where modulating the system for technical purposes dramatically distorts the behavior of the system. For the purposes of confocal imaging, the alternative is to use short-term immobilization with hyperkalemic solution in perfused hearts and wait for contraction failure during ischemia. Currently, this seems to be the best of bad solutions. While this article was in review, Sulkin et al. (26) published a study in which they used a dual optical mapping of TMRM and voltage-sensitive dye RH237 for parallel analysis of ΔΨm and plasma membrane potential (Vm) in heart preparation subjected to low-flow ischemia in the presence of blebbistatin. Whereas the obvious advantage of their approach is the ability to track ΔΨm and Vm in the same locations (with submillimiter, but not cellular resolution), this approach does not address the case of no-flow ischemia, and the limitations of blebbistatin were thoroughly discussed above. Thus the ideal solution for the parallel analysis of ΔΨm and Vm in a realistic model of myocardial ischemia is yet to be found. It is encouraging, however, that different groups start addressing in earnest the methodological problems of integrative and translational models of cardiac pathophysiology, rather than resorting to convenience of reductionist models. Perhaps, the efforts should be renewed to develop practically useful methods to correct for motion artifacts in both wide-field and confocal imaging, and some recent developments toward that end give hope (20).
Limitations.
The imaging approach used in this study has several limitations, which are mostly imposed by the dramatic changes in the heart geometry at the onset of I/R. Namely, in the majority of cases, the FOV imaged before ischemia moved away to such an extent that even with the best effort to adjust the field, the originally imaged cells could not be found. However, the new FOV was still within 1 to 2 mm from the original, so it can be stated that FOV remained the same with 2-mm accuracy. In addition, imaging was not possible during the early phase of ischemia when the heart shape was quickly changing (the “blind period”). At least in the control group, the estimated level of ΔΨm after the end of the “blind period” was similar to the preischemic level, and a large drop in ΔΨm occurred later in ischemia. This observation makes it unlikely but does not exclude a possibility of large fluctuations in ΔΨm during the “blind period.” Microscopic ΔΨm loss was compared with the global electrical failure as opposed to electrical failure in the same cells; yet, despite the difference in the spatial scale, there was a strong correlation between the two measured parameters, supporting a common mechanism of regulation. The actual history of excitation frequency at different times of ischemia varied between experiments largely because of variability in the time course of developing electrical depression. This could cause increased variability in results and could decrease our ability to detect effects caused by rapid pacing in the Tachy group. Metabolic events in unloaded Langendorff hearts could happen more slowly than in fully loaded and contracting ventricles; therefore, tasys and tmito_depol loss could be shorter in vivo. Likewise, the absence of substrates such as lactate, pyruvate, fatty acids, and amino acids normally present in vivo could affect the times of asystole and ΔΨm loss. Iodoacetate may cause severe contracture/rigor early during ischemia, which could have effects on electrical activity and mitochondrial potential unrelated to ATP depletion. We hope to address at least some of these issues in our future studies.
GRANTS
This work was supported by National Heart, Lung, and Blood Institute Grants 5R01-H-L088444 and 1RO1-HL-103877 (to A. V. Zaitsev) and 1F32-HL-097576 (to J. Shibayama) and by Nora Eccles Treadwell Foundation research grant (to A. V. Zaitsev).
DISCLOSURES
No conflicts of interest, financial or otherwise, are declared by the author(s).
AUTHOR CONTRIBUTIONS
P.W.V., J.S., and A.V.Z. conception and design of research; P.W.V., K.J.S., M.W., T.G.T., J.S., and A.V.Z. performed experiments; P.W.V., K.J.S., M.W., T.G.T., V.G., and A.V.Z. analyzed data; P.W.V., K.J.S., T.G.T., V.G., J.S., and A.V.Z. interpreted results of experiments; P.W.V., K.J.S., T.G.T., and A.V.Z. prepared figures; P.W.V. and A.V.Z. drafted manuscript; P.W.V., T.G.T., V.G., J.S., and A.V.Z. edited and revised manuscript; P.W.V., K.J.S., T.G.T., V.G., J.S., and A.V.Z. approved final version of manuscript.
ACKNOWLEDGMENTS
The help and guidance of Dr. Kenneth Spitzer with regard to the best practices of physiological confocal imaging and interpretation of the outcomes is greatly appreciated. This study would not be possible without the critical contribution of Dennis King, Bruce Steadman, and Philip Ershler into the design and implementation of the experimental setup.
REFERENCES
- 1.Abi-Gerges N, Pointon A, Pullen GF, Morton MJ, Oldman KL, Armstrong D, Valentin JP, Pollard CE. Preservation of cardiomyocytes from the adult heart. J Mol Cell Cardiol 64: 108–119, 2013. [DOI] [PubMed] [Google Scholar]
- 2.Akar FG, Aon MA, Tomaselli GF, O'Rourke B. The mitochondrial origin of postischemic arrhythmias. J Clin Invest 115: 3527–3535, 2005. [DOI] [PMC free article] [PubMed] [Google Scholar]
- 3.Baker LC, Wolk R, Choi BR, Watkins S, Plan P, Shah A, Salama G. Effects of mechanical uncouplers, diacetyl monoxime, and cytochalasin-D on the electrophysiology of perfused mouse hearts. Am J Physiol Heart Circ Physiol 287: H1771–H1779, 2004. [DOI] [PubMed] [Google Scholar]
- 4.Brack KE, Narang R, Winter J, Ng GA. The mechanical uncoupler blebbistatin is associated with significant electrophysiological effects in the isolated rabbit heart. Exp Physiol 98: 1009–1027, 2013. [DOI] [PMC free article] [PubMed] [Google Scholar]
- 5.Choi BR, Salama G. Simultaneous maps of optical action potentials and calcium transients in guinea-pig hearts: mechanisms underlying concordant alternans. J Physiol 529: 171–188, 2000. [DOI] [PMC free article] [PubMed] [Google Scholar]
- 6.Davidson SM, Yellon DM, Murphy MP, Duchen MR. Slow calcium waves and redox changes precede mitochondrial permeability transition pore opening in the intact heart during hypoxia and reoxygenation. Cardiovasc Res 93: 445–453, 2012. [DOI] [PubMed] [Google Scholar]
- 7.Docherty JC, Gunter HE, Kuzio B, Shoemaker L, Yang L, Deslauriers R. Effects of cromakalim and glibenclamide on myocardial high energy phosphates and intracellular pH during ischemia-reperfusion: 31P NMR Studies. J Mol Cell Cardiol 29: 1665–1673, 1997. [DOI] [PubMed] [Google Scholar]
- 8.Fedorov VV, Lozinsky IT, Sosunov EA, Anyukhovsky EP, Rosen MR, Balke CW, Efimov IR. Application of blebbistatin as an excitation-contraction uncoupler for electrophysiologic study of rat and rabbit hearts. Heart Rhythm 4: 619–626, 2007. [DOI] [PubMed] [Google Scholar]
- 9.Ganitkevich V, Mattea V, Benndorf K. Glycolytic oscillations in single ischemic cardiomyocytes at near anoxia. J Gen Physiol 135: 307–319, 2010. [DOI] [PMC free article] [PubMed] [Google Scholar]
- 10.Garlid KD, Halestrap AP. The mitochondrial K(ATP) channel—fact or fiction? J Mol Cell Cardiol 52: 578–583, 2012. [DOI] [PMC free article] [PubMed] [Google Scholar]
- 11.Himel HD, Knisley SB. Imaging of cardiac movement using ratiometric and nonratiometric optical mapping: effects of ischemia and 2, 3-butaneodione monoxime. IEEE Trans Med Imaging 25: 122–127, 2006. [DOI] [PubMed] [Google Scholar]
- 12.Korobova F, Gauvin TJ, Higgs HN. A role for myosin II in mammalian mitochondrial fission. Curr Biol 24: 409–414, 2014. [DOI] [PMC free article] [PubMed] [Google Scholar]
- 13.Lou Q, Li W, Efimov IR. The role of dynamic instability and wavelength in arrhythmia maintenance as revealed by panoramic imaging with blebbistatin vs. 2,3-butanedione monoxime. Am J Physiol Heart Circ Physiol 302: H262–H269, 2012. [DOI] [PMC free article] [PubMed] [Google Scholar]
- 14.Lyon AR, Joudrey PJ, Jin D, Nass RD, Aon MA, O'Rourke B, Akar FG. Optical imaging of mitochondrial function uncovers actively propagating waves of mitochondrial membrane potential collapse across intact heart. J Mol Cell Cardiol 49: 565–575, 2010. [DOI] [PMC free article] [PubMed] [Google Scholar]
- 15.McCully JD, Wakiyama H, Hsieh YJ, Jones M, Levitsky S. Differential contribution of necrosis and apoptosis in myocardial ischemia-reperfusion injury. Am J Physiol Heart Circ Physiol 286: H1923–H1935, 2004. [DOI] [PubMed] [Google Scholar]
- 16.Ong SB, Subrayan S, Lim SY, Yellon DM, Davidson SM, Hausenloy DJ. Inhibiting mitochondrial fission protects the heart against ischemia/reperfusion injury. Circulation 121: 2012–2022, 2010. [DOI] [PubMed] [Google Scholar]
- 17.Phillips D, Aponte AM, French SA, Chess DJ, Balaban RS. Succinyl-CoA synthetase is a phosphate target for the activation of mitochondrial metabolism. Biochemistry 48: 7140–7149, 2009. [DOI] [PMC free article] [PubMed] [Google Scholar]
- 18.Rohde GK, Dawant BM, Lin SF. Correction of motion artifact in cardiac optical mapping using image registration. IEEE Trans Biomed Eng 52: 338–341, 2005. [DOI] [PubMed] [Google Scholar]
- 19.Sasaki N, Sato T, Marban E, O'Rourke B. ATP consumption by uncoupled mitochondria activates sarcolemmal KATP channels in cardiac myocytes. Am J Physiol Heart Circ Physiol 280: H1882–H1888, 2001. [DOI] [PubMed] [Google Scholar]
- 20.Schroeder JL, Luger-Hamer M, Pursley R, Pohida T, Chefd'hotel C, Kellman P, Balaban RS. Short communication: Subcellular motion compensation for minimally invasive microscopy, in vivo: evidence for oxygen gradients in resting muscle. Circ Res 106: 1129–1133, 2010. [DOI] [PMC free article] [PubMed] [Google Scholar]
- 21.Sebbag L, Verbinski SG, Reimer KA, Jennings RB. Protection of ischemic myocardium in dogs using intracoronary 2,3-butanedione monoxime (BDM). J Mol Cell Cardiol 35: 165–176, 2003. [DOI] [PubMed] [Google Scholar]
- 22.Skalska J, Debska G, Kunz WS, Szewczyk A. Antidiabetic sulphonylureas activate mitochondrial permeability transition in rat skeletal muscle. Br J Pharmacol 145: 785–791, 2005. [DOI] [PMC free article] [PubMed] [Google Scholar]
- 23.Slodzinski MK, Aon MA, O'Rourke B. Glutathione oxidation as a trigger of mitochondrial depolarization and oscillation in intact hearts. J Mol Cell Cardiol 45: 650–660, 2008. [DOI] [PMC free article] [PubMed] [Google Scholar]
- 24.Smith RM, Velamakanni SS, Tolkacheva EG. Interventricular heterogeneity as a substrate for arrhythmogenesis of decoupled mitochondria during ischemia in the whole heart. Am J Physiol Heart Circ Physiol 303: H224–H233, 2012. [DOI] [PubMed] [Google Scholar]
- 25.Smith RM, Visweswaran R, Talkachova I, Wothe JK, Tolkacheva EG. Uncoupling the mitochondria facilitates alternans formation in the isolated rabbit heart. Am J Physiol Heart Circ Physiol 305: H9–H18, 2013. [DOI] [PubMed] [Google Scholar]
- 26.Sulkin MS, Boukens BJ, Tetlow M, Gutbrod SR, Ng FS, Efimov IR. Mitochondrial depolarization and electrophysiological changes during ischemia in the rabbit and human heart. Am J Physiol Heart Circ Physiol 307: H1178–H1186, 2014. [DOI] [PMC free article] [PubMed] [Google Scholar]
- 27.Taylor TG, Venable PW, Shibayama J, Warren M, Zaitsev AV. Role of KATP channel in electrical depression and asystole during long-duration ventricular fibrillation in ex vivo canine heart. Am J Physiol Heart Circ Physiol 302: H2396–H2409, 2012. [DOI] [PMC free article] [PubMed] [Google Scholar]
- 28.Venable PW, Sciuto KJ, Taylor TG, Garg V, Shibayama J, Spitzer KW, Zaitsev AV. Blebbistatin delays mitochondrial depolarization and asystole during myocardial ischemia, and prevents cell death upon reperfusion (Abstract). Biophys J 106: 186a, 2014. [Google Scholar]
- 29.Venable PW, Taylor TG, Sciuto KJ, Zhao J, Shibayama J, Warren M, Spitzer KW, Zaitsev AV. Detection of mitochondrial depolarization/recovery during ischaemia-reperfusion using spectral properties of confocally recorded TMRM fluorescence. J Physiol 591: 2781–2794, 2013. [DOI] [PMC free article] [PubMed] [Google Scholar]
- 30.Venable PW, Taylor TG, Shibayama J, Warren M, Zaitsev AV. Complex structure of electrophysiological gradients emerging during long-duration ventricular fibrillation in the canine heart. Am J Physiol Heart Circ Physiol 299: H1405–H1418, 2010. [DOI] [PMC free article] [PubMed] [Google Scholar]
- 31.Weiss JN, Lamp ST. Cardiac ATP-sensitive K+ channels. Evidence for preferential regulation by glycolysis. J Gen Physiol 94: 911–935, 1989. [DOI] [PMC free article] [PubMed] [Google Scholar]
- 32.Wengrowski AM, Kuzmiak-Glancy S, Jaimes R 3rd, Kay MW. NADH changes during hypoxia, ischemia, and increased work differ between isolated heart preparations. Am J Physiol Heart Circ Physiol 306: H529–H537, 2014. [DOI] [PMC free article] [PubMed] [Google Scholar]